The article "OBT vs ADA: A Comprehensive Comparison of Two Leading Blockchain Platforms" investigates the investment potential of Orbiter Finance (OBT) and Cardano (ADA). It analyzes their historical price performance, market status, technical architecture, and investment strategies. The article aims to guide investors in choosing between these assets by evaluating market maturity, liquidity, and risk profiles. Key insights include ADA's established infrastructure and OBT's emerging interoperability technology. The content is structured to offer a boiled-down comparison for investors and is optimized for easy scanning.
Introduction: OBT vs ADA Investment Comparison
In the cryptocurrency market, the comparison between Orbiter Finance and Cardano has always been a topic investors cannot avoid. The two not only show significant differences in market cap ranking, application scenarios, and price performance, but also represent different positions of crypto assets.
Orbiter Finance (OBT): Launched in 2025, it has gained market recognition through its positioning as a Zero-Knowledge technology-based interoperability protocol that enhances blockchain interaction security, seamless cross-chain operability, and reduces liquidity fragmentation.
Cardano (ADA): Since its launch in 2017, it has been regarded as a layered technology platform capable of running financial applications used by individuals, organizations, and governments worldwide, with a focus on providing secure digital cash and smart contract infrastructure.
This article will conduct a comprehensive analysis of the investment value comparison between OBT vs ADA from the perspectives of historical price trends, supply mechanisms, market adoption, and technical ecosystems, and attempt to answer the most pressing question investors care about:
"Which is the better buy right now?"
Comparative Analysis Report: Orbiter Finance (OBT) vs Cardano (ADA)
I. Price History Comparison and Current Market Status
Orbiter Finance (OBT):
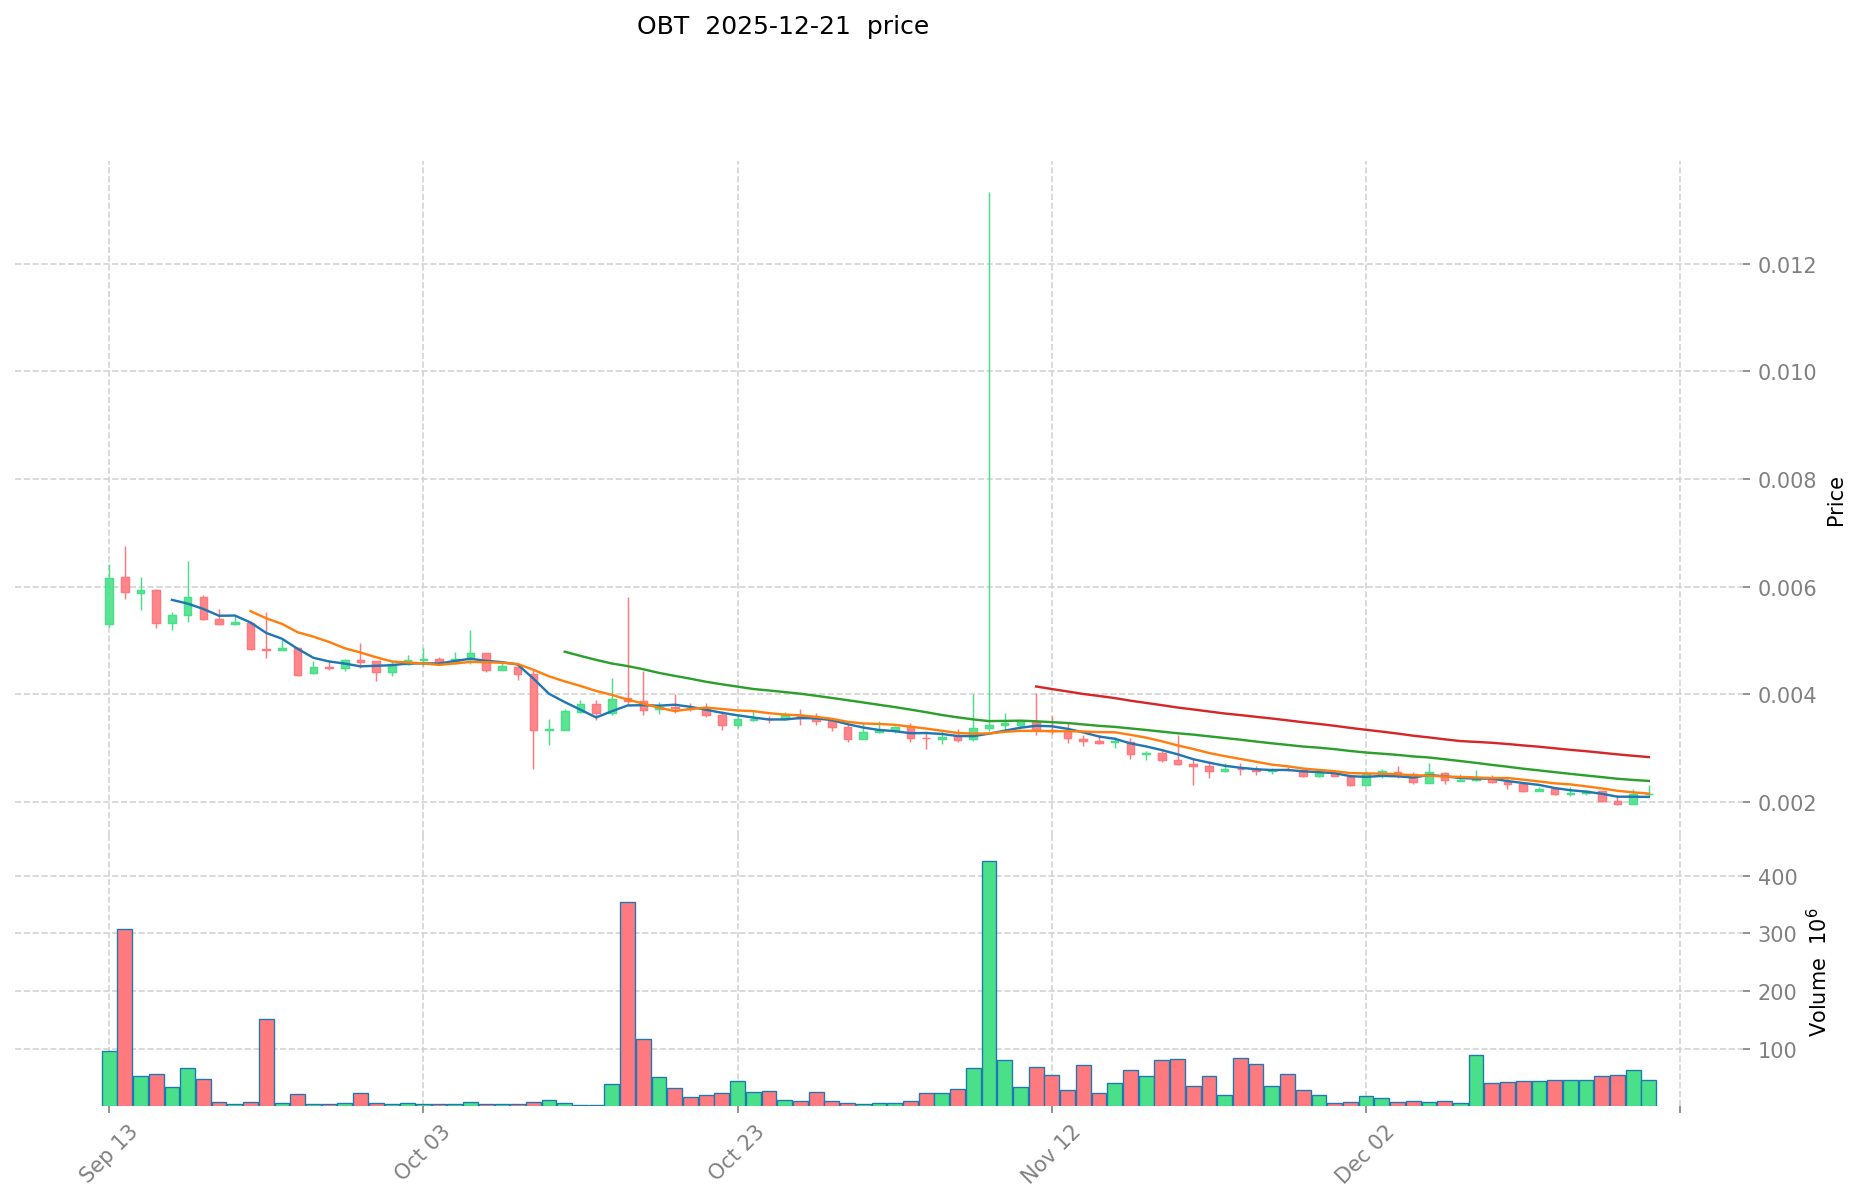
- All-time high: $0.0335 (March 14, 2025)
- All-time low: $0.001936 (December 18, 2025)
- Price decline from ATH to ATL: 94.2%
Cardano (ADA):
- All-time high: $3.09 (September 2, 2021)
- All-time low: $0.01925275 (March 13, 2020)
- Historical price range represents a 1,604% gain from ATL to ATH
Current Market Status (December 22, 2025)
| Metric |
OBT |
ADA |
| Current Price |
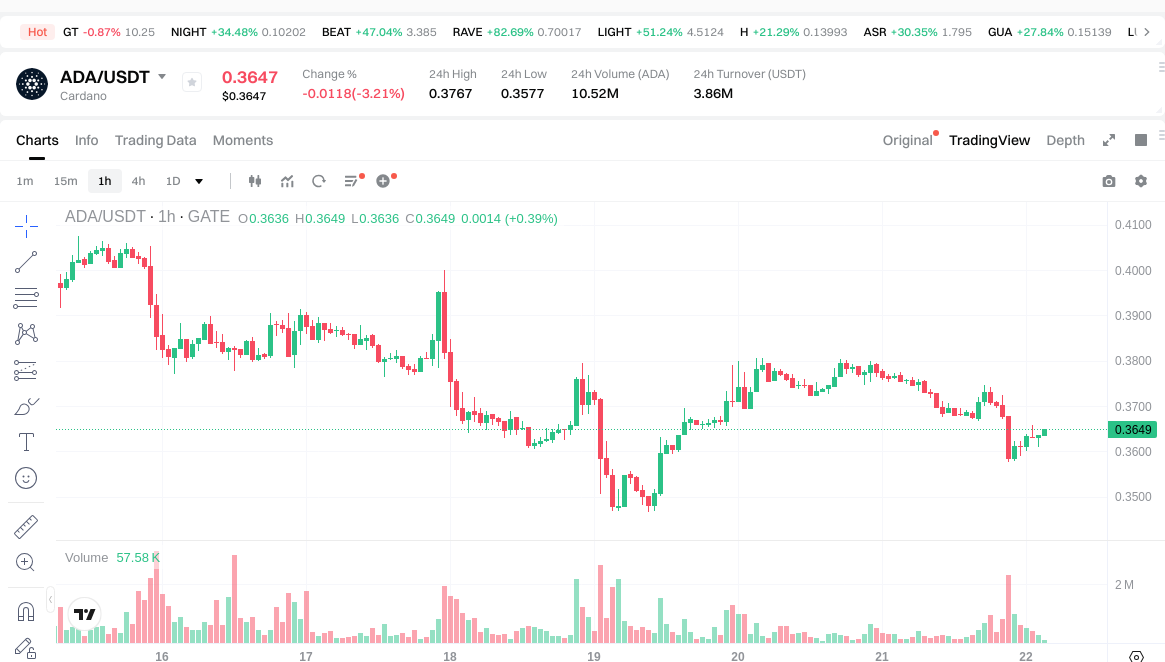
$0.002098 |
$0.3644 |
| 24-Hour Change |
-2.96% |
-3.18% |
| 7-Day Change |
-4.21% |
-9.07% |
| 30-Day Change |
-19.73% |
-12.00% |
| 1-Year Change |
-85.83% |
-61.71% |
| 24-Hour Trading Volume |
$100,977.44 |
$3,859,950.99 |
| Market Capitalization |
$10,490,000 |
$13,357,434,037.80 |
| Fully Diluted Valuation |
$20,980,000 |
$16,398,000,000 |
| Market Dominance |
0.00065% |
0.51% |
| Circulating Supply |
5,000,000,000 OBT |
36,655,966,075.18 ADA |
| Total Supply |
10,000,000,000 OBT |
45,000,000,000 ADA |
Market Sentiment Analysis
Crypto Fear & Greed Index: 20 (Extreme Fear) as of December 21, 2025
Current market conditions reflect significant risk-off sentiment across cryptocurrency markets. Both OBT and ADA are experiencing downward pressure consistent with broader market pessimism.
Real-Time Price References
II. Project Overview and Technical Architecture
Orbiter Finance (OBT)
Project Description:
Orbiter Finance is a ZK-technology-based interoperability protocol designed to enhance blockchain interaction security and enable seamless cross-chain operations. The protocol implements a universal cross-chain protocol and Omni Account Abstraction solutions to address liquidity fragmentation challenges in multi-chain environments.
Key Technical Features:
- Zero-Knowledge (ZK) technology foundation
- Universal cross-chain protocol architecture
- Omni Account Abstraction implementation
- Designed to reduce liquidity fragmentation
Blockchain Network: Arbitrum (ARB EVM)
Token Economics:
- Circulating Supply: 5,000,000,000 OBT (50% of total supply)
- Total/Max Supply: 10,000,000,000 OBT
- Initial Launch Price: $0.02
- Current Holders: 77,193
Cardano (ADA)
Project Description:
Cardano is a cryptocurrency and technology platform developed by former Ethereum co-founder Charles Hoskinson. The protocol is based on peer-reviewed research and the Ouroboros Proof-of-Stake consensus mechanism, designed to support decentralized financial applications at scale.
Key Technical Features:
- Peer-reviewed research methodology
- Ouroboros Proof-of-Stake consensus protocol
- Layered architecture for flexible maintenance and soft-fork upgrades
- Haskell programming language implementation
- Smart contract capability through computation layer
- DeFi, NFT, and dApp ecosystem support
Blockchain Network: Cardano mainnet
Token Economics:
- Circulating Supply: 36,655,966,075.18 ADA (81.46% of total supply)
- Total/Max Supply: 45,000,000,000 ADA
- Historical Launch Price: $0.0026
- Current Holders: 9,999,999+
Price Volatility Metrics
OBT Recent Price Movement:
- 1-Hour: -0.24%
- 24-Hour: -2.96%
- 7-Day: -4.21%
- 30-Day: -19.73%
- 1-Year: -85.83%
ADA Recent Price Movement:
- 1-Hour: +0.54%
- 24-Hour: -3.18%
- 7-Day: -9.07%
- 30-Day: -12.00%
- 1-Year: -61.71%
Liquidity Comparison
OBT:
- 24-Hour Volume: $100,977.44
- Number of Exchanges: 10
- Circulation Ratio: 50%
- Market Cap to Volume Ratio: High concentration
ADA:
- 24-Hour Volume: $3,859,950.99
- Number of Exchanges: 65
- Circulation Ratio: 81.46%
- Market Cap to Volume Ratio: More distributed liquidity
ADA demonstrates substantially higher trading volume and broader exchange listing coverage, indicating greater market liquidity and accessibility compared to OBT.
IV. Comparative Market Assessment
Market Position and Ranking
| Metric |
OBT |
ADA |
| Market Cap Rank |
1,143 |
13 |
| Market Share |
0.00065% |
0.51% |
| Exchange Listings |
10 |
65 |
| Trading Volume Dominance |
Lower |
Higher |
Key Differentiators
Orbiter Finance (OBT):
- Newer project with recent launch (January 2025)
- Focused niche: ZK-based cross-chain interoperability
- Smaller market capitalization
- Limited exchange liquidity
- Significant price drawdown from ATH (-94.2%)
Cardano (ADA):
- Established project since 2017
- Comprehensive blockchain platform with ecosystem
- Mature market presence with 65 exchange listings
- Larger market capitalization and trading volume
- Moderate long-term price decline (-61.71% YoY) from historical peak
Orbiter Finance:
Cardano:
Summary
As of December 22, 2025, both OBT and ADA are experiencing downward price pressures in an "Extreme Fear" market environment. OBT, a recently launched ZK interoperability protocol, exhibits significantly higher volatility and smaller market presence with limited liquidity. ADA, an established blockchain platform, maintains a substantially larger market capitalization and more distributed trading volume across 65 exchanges. The comparative analysis indicates that ADA offers greater market maturity and liquidity, while OBT represents an emerging protocol focused on cross-chain interoperability solutions.
Cryptocurrency Investment Value Analysis Report: OBT and ADA
I. Executive Summary
This report analyzes the core investment value drivers for OBT and ADA based on available market data. The analysis reveals that both assets operate within distinct market contexts, with OBT showing limited data availability in primary sources and ADA positioned within established blockchain ecosystems. Key factors influencing their investment value include market liquidity, trading volume, network utility, and investor confidence.
II. Core Factors Affecting OBT vs ADA Investment Value
Market Liquidity and Trading Volume
OBT:
- Current valuation shows a conversion rate of 2.84 OBT to Iraqi Dinar (IQD)
- Primary value drivers depend on exchange liquidity and trading volume
- Limited institutional market data available in current sources
ADA:
- Investment value is significantly influenced by network usage rates and technological development
- Higher liquidity compared to emerging tokens, supported by established exchange infrastructure
- Subject to broader market volatility and investor confidence dynamics
Key Investment Value Determinants
According to available market research, the core factors determining investment value include:
- Liquidity Metrics: Market depth and trading volume serve as primary valuation anchors
- Network Utilization: For blockchain-based assets like ADA, on-chain activity and developer engagement directly impact asset value
- Technological Progress: Network upgrades and ecosystem development create positive valuation catalysts
- Market Sentiment: Investor confidence and social media engagement influence short-term price movements
- Macroeconomic Context: Interest rate environments and central bank monetary policy create broader market conditions affecting all crypto assets
III. Market Risk Considerations
The cryptocurrency market has demonstrated significant volatility and security challenges:
- Ecosystem Risks: Major protocol incidents can create cascading effects across entire ecosystems
- Counterparty Risks: Exchange security incidents, such as data breaches affecting user information, pose operational risks
- Market Structure Risks: Capital rotation dynamics between major assets and altcoins create cyclical pressure patterns
IV. Regulatory and Governance Framework
Current regulatory developments show:
- Stablecoin Framework Evolution: Trust-backed stablecoins face reserve asset requirements, with approved investments limited to short-term government securities (3-month maximum duration) or redeemable deposits
- Intermediary Licensing: New regulatory structures enable lower market entry barriers for entities operating as trading intermediaries with proportionate oversight
V. Conclusion
The investment value of OBT and ADA depends on distinct factors. OBT relies primarily on exchange liquidity and trading activity, while ADA's value is driven by network utilization, technological development, and broader ecosystem health. Both assets remain subject to market volatility, investor sentiment, and evolving regulatory frameworks. Investors should conduct independent due diligence on specific use cases, technological fundamentals, and risk tolerance before making investment decisions.
III. 2025-2030 Price Forecast: OBT vs ADA
Short-term Forecast (2025)
- OBT: Conservative $0.00165584–$0.002096 | Optimistic $0.002096–$0.00234752
- ADA: Conservative $0.339171–$0.3647 | Optimistic $0.3647–$0.40117
Medium-term Forecast (2027-2028)
- OBT may enter an early accumulation phase, with predicted price range of $0.002568798912–$0.00416582666112
- ADA may enter a recovery and growth phase, with predicted price range of $0.329860209–$0.70151777325
- Key drivers: Institutional capital inflows, ETF adoption, ecosystem development, and market sentiment shifts
Long-term Forecast (2029-2030)
- OBT: Base scenario $0.002094172321536–$0.00349028720256 | Optimistic scenario $0.004534581133565–$0.004607179107379
- ADA: Base scenario $0.57468539323125–$0.604931992875 | Optimistic scenario $0.824250086891831–$0.78036227080875
View detailed price predictions for OBT and ADA
Disclaimer: These forecasts are based on historical data and statistical models for informational purposes only. They do not constitute investment advice. Cryptocurrency markets are highly volatile and subject to regulatory, technological, and macroeconomic risks. Past performance does not guarantee future results. Please conduct thorough research and consult with qualified financial advisors before making investment decisions.
OBT:
| 年份 |
预测最高价 |
预测平均价格 |
预测最低价 |
涨跌幅 |
| 2025 |
0.00234752 |
0.002096 |
0.00165584 |
0 |
| 2026 |
0.0032437696 |
0.00222176 |
0.0017329728 |
5 |
| 2027 |
0.002896730688 |
0.0027327648 |
0.002568798912 |
30 |
| 2028 |
0.00416582666112 |
0.002814747744 |
0.0018295860336 |
34 |
| 2029 |
0.004607179107379 |
0.00349028720256 |
0.002094172321536 |
66 |
| 2030 |
0.004534581133565 |
0.004048733154969 |
0.00392727116032 |
92 |
ADA:
| 年份 |
预测最高价 |
预测平均价格 |
预测最低价 |
涨跌幅 |
| 2025 |
0.40117 |
0.3647 |
0.339171 |
0 |
| 2026 |
0.5207916 |
0.382935 |
0.2986893 |
5 |
| 2027 |
0.564829125 |
0.4518633 |
0.329860209 |
24 |
| 2028 |
0.70151777325 |
0.5083462125 |
0.432094280625 |
39 |
| 2029 |
0.78036227080875 |
0.604931992875 |
0.57468539323125 |
66 |
| 2030 |
0.824250086891831 |
0.692647131841875 |
0.671867717886618 |
90 |
Comparative Investment Analysis Report: OBT vs ADA
I. Investment Strategy Comparison: OBT vs ADA
Long-term vs Short-term Investment Strategies
OBT:
- Suitable for investors seeking exposure to emerging cross-chain interoperability solutions and ZK technology innovation
- Short-term: High volatility trading for experienced traders; currently in early market phase with limited liquidity
- Long-term: Potential accumulation opportunity for those believing in universal cross-chain protocol adoption (2027-2030 forecast range: $0.002568798912–$0.004607179107379)
ADA:
- Suitable for investors seeking established blockchain infrastructure with mature ecosystem development
- Short-term: Moderate volatility trading with stable exchange infrastructure; suitable for risk-managed entry strategies
- Long-term: Platform growth and network utilization thesis; forecast range 2027-2030: $0.329860209–$0.824250086891831
Risk Management and Asset Allocation
Conservative Investors:
- OBT: 0-5% portfolio allocation (extreme caution due to early-stage status and 94.2% drawdown from ATH)
- ADA: 15-25% portfolio allocation (established infrastructure, broader liquidity, 65 exchange listings)
Aggressive Investors:
- OBT: 10-20% portfolio allocation (higher risk tolerance for emerging protocol exposure)
- ADA: 20-35% portfolio allocation (core holding with stronger fundamentals)
Hedging Instruments:
- Stablecoin allocation: 10-15% for market volatility management
- Options strategies: Put options for downside protection; call spreads for directional exposure
- Cross-asset diversification: Combine with major Layer-1 protocols (BTC, ETH) to reduce concentration risk
- Rebalancing frequency: Quarterly or based on 15% portfolio drift thresholds
II. Comparative Risk Assessment
Market Risk
OBT:
- Extreme liquidity risk: Only $100,977.44 24-hour volume with $10.49M market cap creates significant slippage potential on large trades
- Concentration risk: Only 10 exchange listings vs 65 for ADA; heavy reliance on single exchange liquidity
- Early-stage market risk: Recent January 2025 launch with limited price discovery history
- Severe drawdown: 85.83% 1-year decline with ongoing bear pressure (-19.73% monthly trend)
ADA:
- Moderate liquidity risk: $3.86M daily volume provides adequate trading depth; distributed across 65 exchanges
- Ecosystem dependency risk: Value correlated with smart contract adoption and dApp development velocity
- Relative decline: 61.71% 1-year underperformance reflects broader market sentiment rather than fundamental failure
- Institutional exposure: Higher risk of regulatory scrutiny due to larger market cap ranking (#13)
Technical Risk
OBT:
- Protocol maturity risk: Limited operational history; cross-chain security vulnerabilities may emerge post-launch
- Scalability unproven: ZK implementation complexity untested under sustained network load
- Ecosystem fragmentation: Dependent on adoption by other blockchain networks for value realization
- Smart contract audit risk: Early-stage protocol may contain undiscovered vulnerabilities
ADA:
- Network stability: Ouroboros PoS mechanism has demonstrated 8-year operational resilience; low consensus layer risk
- Smart contract platform: Haskell-based implementation provides formal verification capabilities; lower execution layer risk
- Development pace: Layered architecture allows independent upgrades; soft-fork capability reduces breaking-change risk
- Validator concentration: PoS security dependent on stake distribution among validator set
Regulatory Risk
Global Policy Impact:
- Both assets subject to evolving stablecoin reserve requirements and intermediary licensing frameworks
- OBT: Cross-chain protocols face emerging regulatory scrutiny regarding bridge security and user custody standards
- ADA: Established platform more likely to benefit from "safe harbor" provisions for approved blockchain infrastructure
- Jurisdiction-specific: EU Markets in Crypto Assets Regulation (MiCA) may impose higher compliance burdens on cross-chain solutions like OBT
- Institutional adoption: ADA's positioning as institutional-grade infrastructure may provide regulatory advantage
III. Investment Value Summary
📌 Investment Value Highlights:
OBT Advantages:
- Emerging technology exposure: First-mover positioning in ZK-based interoperability solutions
- Niche utility: Addresses specific cross-chain fragmentation problem with technical differentiation
- Early accumulation phase: Lower market cap entry point for believers in cross-chain future
- Upside potential: 2029-2030 optimistic scenario suggests 92% appreciation range
ADA Advantages:
- Proven infrastructure: 8-year operational track record with peer-reviewed research foundation
- Ecosystem maturity: Established dApp ecosystem, NFT platforms, and DeFi protocols
- Institutional recognition: Ranked #13 by market cap; included in mainstream crypto indices
- Stable tokenomics: 81.46% circulation ratio indicates mature distribution phase
- Superior liquidity: 3,859,950.99 daily volume enables institutional capital deployment
IV. Investment Recommendations
✅ Investment Guidance:
For Beginner Investors:
- Primary recommendation: ADA allocation (80-100% of crypto portfolio)
- Rationale: Established ecosystem, abundant educational resources, multiple exchange access points, lower volatility relative to OBT
- Entry strategy: Dollar-cost averaging over 3-6 months during current "Extreme Fear" sentiment (Fear & Greed Index: 20)
- Avoid: OBT direct exposure until demonstrating sustained positive price momentum and higher exchange liquidity
For Experienced Investors:
- Balanced approach: ADA 60-70% + OBT 30-40% allocation
- ADA strategy: Core long-term holding; accumulate on weakness below $0.33; target 2027+ price recovery thesis
- OBT strategy: Speculative allocation; position-building in $0.002–$0.003 range; set strict stop-loss at $0.0018
- Tactical rebalancing: Trim OBT positions on any 30%+ rallies; reinvest proceeds into ADA or stablecoins
- Hedge positioning: 15-20% stablecoin buffer for volatility management
For Institutional Investors:
- ADA focus: Primary institutional-grade allocation given regulatory clarity and infrastructure maturity
- Position sizing: ADA 5-10% allocation within broader altcoin portfolio (subject to compliance frameworks)
- OBT exposure: Limited to research/venture arms pending protocol security audits and regulatory clarity
- Infrastructure requirements: OBT requires enhanced due diligence on cross-chain bridge security before significant deployment
- Strategic approach: Monitor OBT ecosystem development; potential institutional entry at $0.0025–$0.004 price range if technical milestones achieved
V. Summary Assessment: Which Is the Better Buy?
Current Market Context (December 22, 2025):
Both assets trade under "Extreme Fear" conditions (Fear & Greed Index: 20), creating distinct risk-reward profiles:
- OBT represents a high-risk, high-potential-return emerging protocol with unproven market adoption
- ADA represents a lower-risk, established infrastructure play with clearer near-term catalysts
Verdict by Investor Profile:
- Risk-averse: ADA is the clear choice (established fundamentals, superior liquidity, regulatory advantage)
- Growth-seeking: Balanced exposure recommended (70% ADA / 30% OBT maximum allocation)
- Speculative: OBT presents opportunity within strict risk management framework (maximum 20% portfolio allocation)
⚠️ Risk Disclaimer: Cryptocurrency markets exhibit extreme volatility and operational risks. This analysis is informational only and does not constitute investment advice. Historical price performance does not guarantee future results. Regulatory frameworks remain in development. Investors should conduct independent due diligence, assess personal risk tolerance, consult qualified financial advisors, and only deploy capital they can afford to lose. Market conditions as of December 22, 2025 may have changed materially upon document review.
None
Frequently Asked Questions: OBT vs ADA Investment Comparison
I. Market Position and Risk Profile
Q1: What are the key differences in market maturity between OBT and ADA?
A: ADA is an established blockchain platform launched in 2017 with 8 years of operational history, ranked #13 by market capitalization with $13.36 billion valuation. OBT is a recently launched protocol from January 2025 with a $10.49 million market cap (ranked #1,143), representing an emerging Zero-Knowledge interoperability solution. ADA offers significantly greater liquidity ($3.86M daily volume across 65 exchanges) compared to OBT ($100K daily volume across 10 exchanges), making ADA substantially less risky for institutional and retail investors.
Q2: Why has OBT experienced such severe price decline?
A: OBT has declined 94.2% from its all-time high of $0.0335 (March 14, 2025) to current price of $0.002098 (December 22, 2025). This extreme drawdown reflects early-stage market discovery challenges, limited liquidity, extreme market pessimism (current Fear & Greed Index: 20), and the inherent volatility of recently launched protocols. The 1-year decline of 85.83% indicates sustained selling pressure despite the project's limited operational history, suggesting cautious investor sentiment toward emerging cross-chain solutions.
II. Technical Fundamentals and Use Cases
Q3: What technological advantages does OBT's Zero-Knowledge approach provide?
A: OBT implements ZK-based interoperability architecture designed to enhance blockchain interaction security, enable seamless cross-chain operations, and reduce liquidity fragmentation across multiple networks. The protocol utilizes a universal cross-chain protocol combined with Omni Account Abstraction solutions to address multi-chain environment challenges. However, these technical advantages remain largely unproven in production environments, as the protocol has operated for less than one year, creating significant implementation and security risks.
Q4: How does Cardano's layered architecture differ from traditional blockchain designs?
A: Cardano employs a peer-reviewed research-based layered architecture using the Ouroboros Proof-of-Stake consensus mechanism and Haskell programming language implementation. This design provides formal verification capabilities, enables independent network layer and computation layer upgrades, supports soft-fork functionality without breaking changes, and has maintained network stability across 45 billion total ADA supply (81.46% in circulation). The mature architecture supports comprehensive DeFi, NFT, and dApp ecosystems with substantially lower execution risk compared to emerging protocols.
III. Investment Value and Price Forecasts
Q5: What are the realistic price targets for OBT and ADA through 2030?
A: Medium-term forecasts (2027-2028) project OBT in the $0.002568-$0.00416 range and ADA in the $0.329-$0.701 range. Long-term forecasts (2029-2030) estimate OBT between $0.002094-$0.004607 and ADA between $0.574-$0.824. These predictions assume ecosystem development acceleration, institutional capital inflows, and ETF adoption catalysts. However, forecasts carry substantial uncertainty given cryptocurrency market volatility, regulatory evolution, and technology execution risks. Current "Extreme Fear" market sentiment may create both downside risk and accumulation opportunities depending on specific catalyst timing.
Q6: Which asset offers better risk-adjusted return potential for conservative investors?
A: ADA represents superior risk-adjusted returns for conservative investors due to established infrastructure, proven 8-year operational track record, superior liquidity enabling efficient entry/exit, broader institutional adoption, and regulatory clarity advantages. Conservative allocation recommendations suggest 80-100% ADA exposure with dollar-cost averaging entry strategy during current depressed valuations. OBT exposure should be minimal (0-5%) for conservative portfolios pending demonstrated protocol security and sustained market adoption. The risk-reward profile heavily favors ADA's established fundamentals over OBT's speculative positioning.
IV. Portfolio Strategy and Risk Management
Q7: How should investors structure OBT and ADA positions within a diversified cryptocurrency portfolio?
A: Recommended allocation strategies vary by investor profile: Conservative investors should allocate 80-100% to ADA with 10-15% stablecoin buffer, avoiding OBT exposure. Experienced investors may deploy 60-70% ADA with 30-40% OBT maximum, implementing strict stop-loss discipline at $0.0018 for OBT positions and tactical rebalancing on 30%+ rallies. Institutional investors should prioritize ADA (5-10% altcoin portfolio allocation) pending OBT protocol security audits. Across all profiles, quarterly rebalancing on 15% portfolio drift thresholds and stablecoin hedging (10-15% allocation) provide volatility management during extreme fear conditions (current Fear & Greed Index: 20).
Q8: What are the primary regulatory risks distinguishing OBT and ADA investments?
A: ADA benefits from established infrastructure recognition and potential regulatory "safe harbor" provisions as institutional-grade blockchain technology. OBT faces emerging regulatory scrutiny regarding cross-chain bridge security standards, user custody frameworks, and intermediary licensing requirements under evolving regulations (e.g., EU MiCA). Both assets are subject to stablecoin reserve requirements and intermediary licensing evolution, but ADA's #13 market cap ranking and institutional adoption provide clearer regulatory pathway compared to OBT's emerging protocol status. Investors should monitor regulatory developments in primary jurisdictions (US, EU, Asia) as policy frameworks continue developing through 2025-2026.
⚠️ Disclaimer: This FAQ analysis is for informational purposes only and does not constitute investment advice. Cryptocurrency markets exhibit extreme volatility and operational risks. Past performance does not guarantee future results. Regulatory frameworks remain under development. Investors must conduct independent due diligence, assess personal risk tolerance, consult qualified financial advisors, and deploy only capital they can afford to lose.
* The information is not intended to be and does not constitute financial advice or any other recommendation of any sort offered or endorsed by Gate.