ORION vs AAVE: Comparing Two Leading DeFi Lending Protocols
Introduction: ORION vs AAVE Investment Comparison
In the cryptocurrency market, the comparison between Orion Money and AAVE has been an unavoidable topic for investors. The two not only show significant differences in market cap ranking, application scenarios, and price performance, but also represent different positioning in the crypto asset space.
Orion Money (ORION): Launched in 2021, it has gained market recognition for its cross-chain stablecoin banking vision.
AAVE (AAVE): Since its inception in 2020, it has been hailed as a leading decentralized lending protocol, becoming one of the most traded and highest market cap cryptocurrencies in the DeFi space.
This article will comprehensively analyze the investment value comparison between Orion Money and AAVE, focusing on historical price trends, supply mechanisms, institutional adoption, technological ecosystems, and future predictions, attempting to answer the question investors care about most:
"Which is the better buy right now?"
I. Price History Comparison and Current Market Status
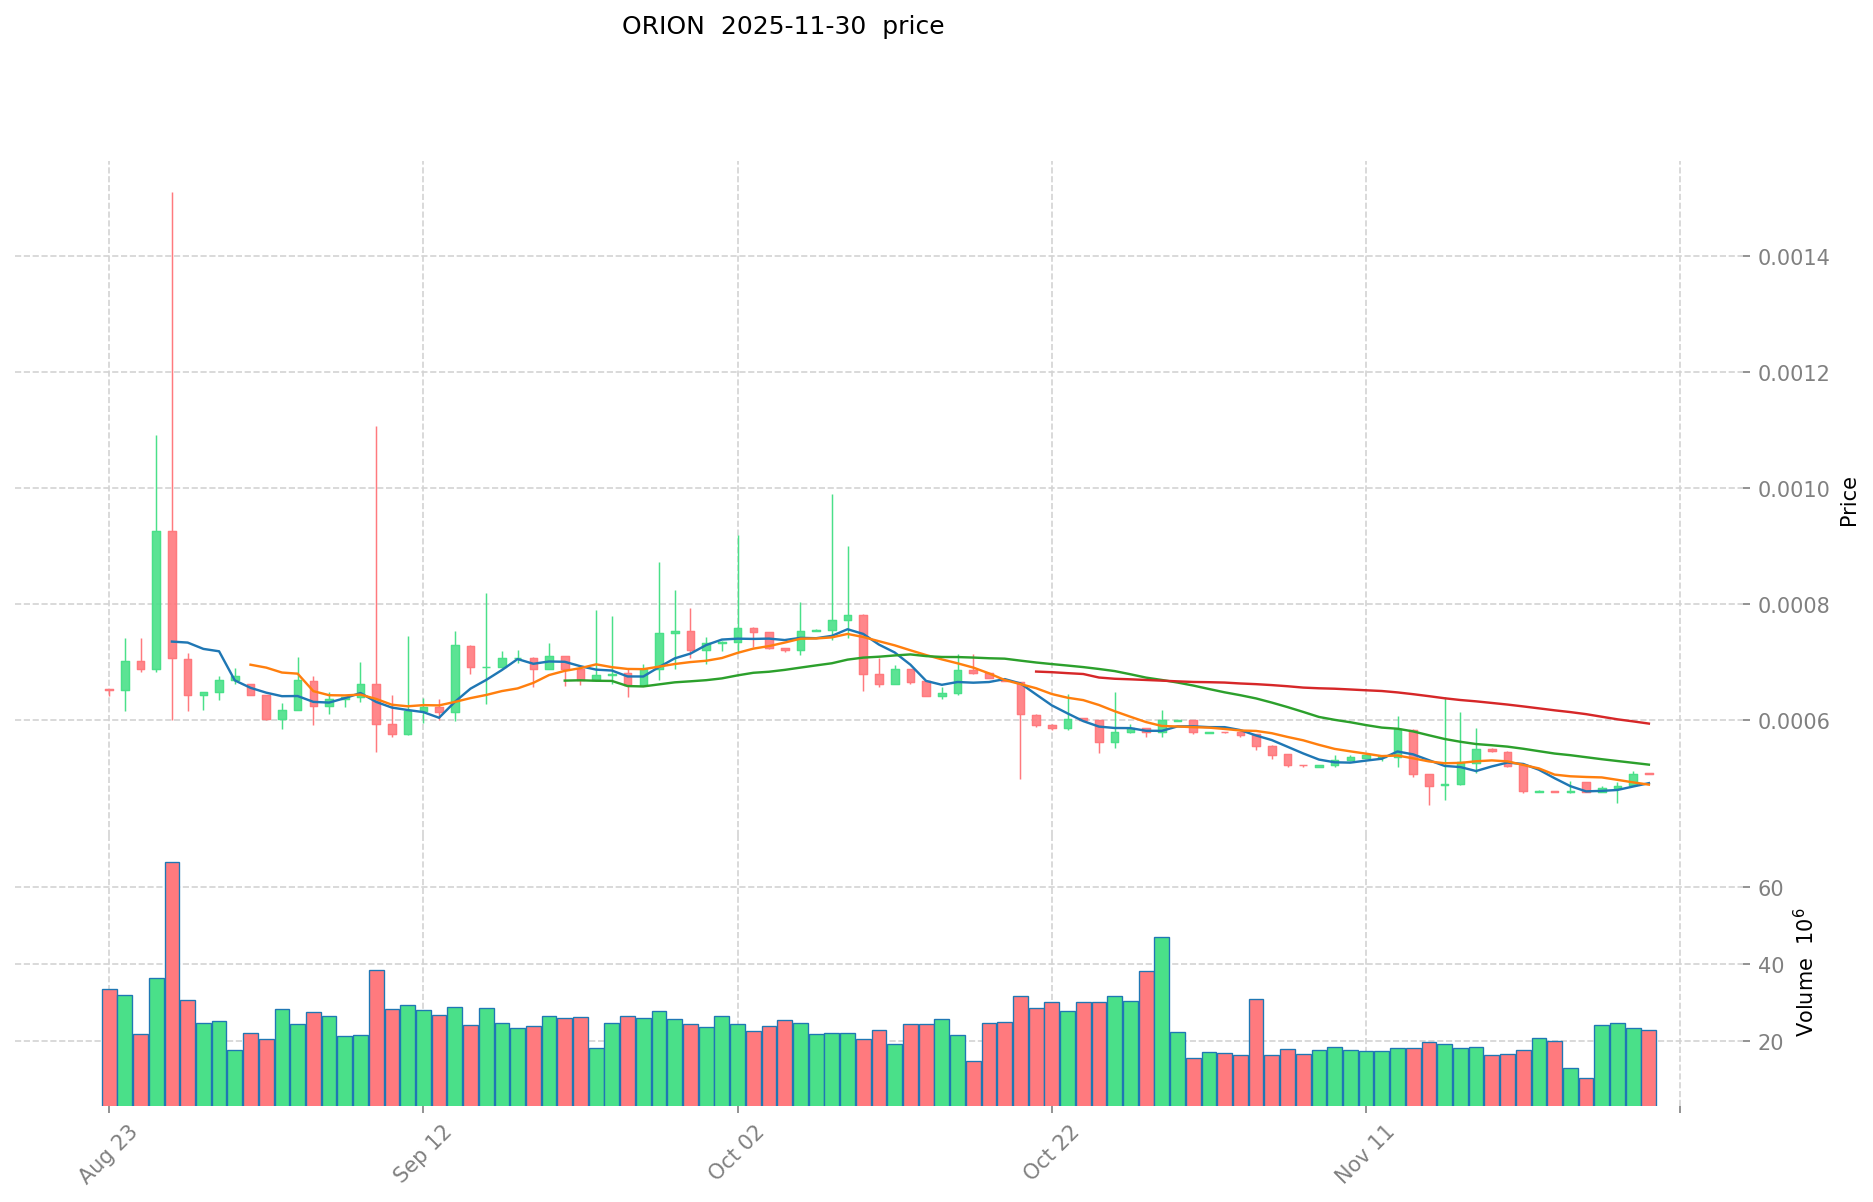
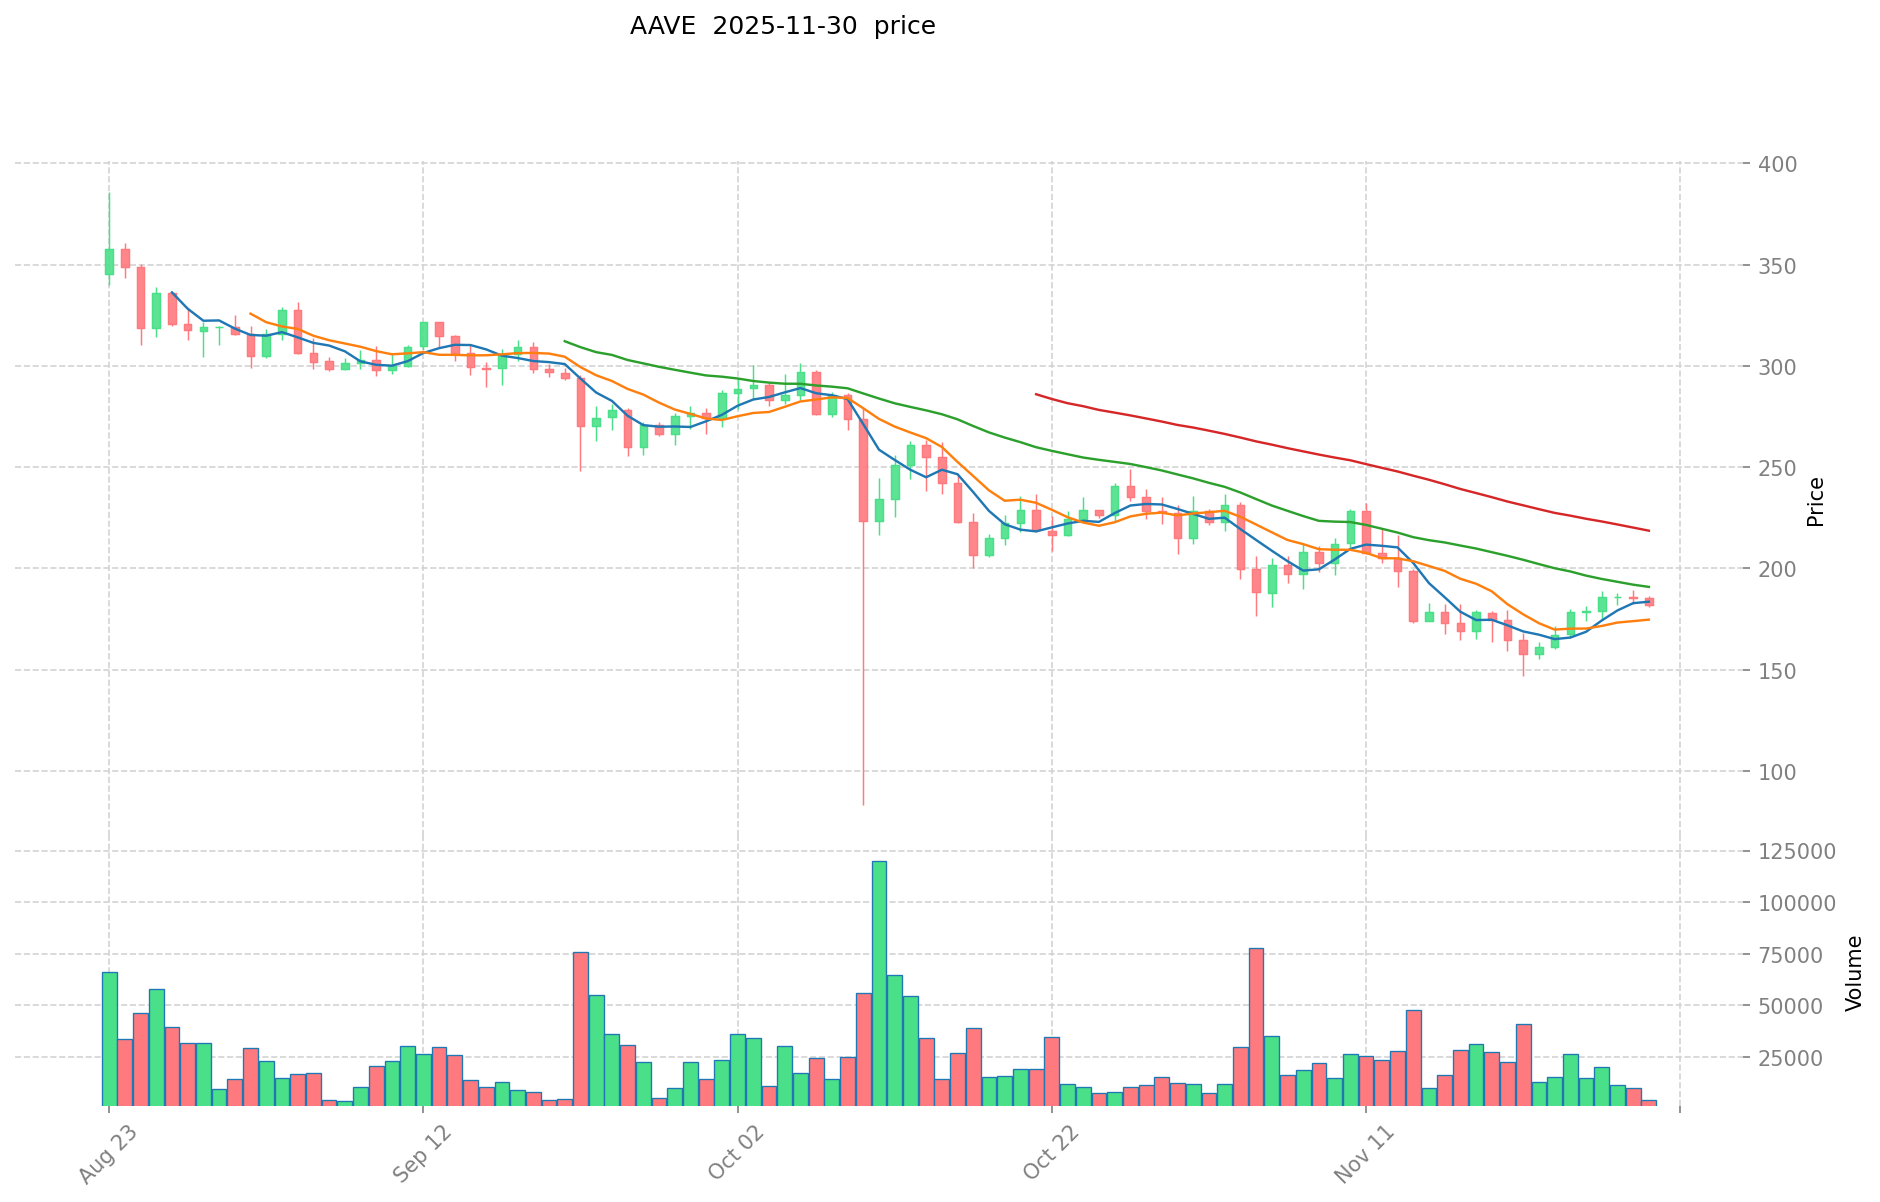
ORION (Coin A) and AAVE (Coin B) Historical Price Trends
- 2021: ORION reached its all-time high of $2.36 on October 15, 2021.
- 2020: AAVE launched through a token swap from LEND at a 100:1 ratio on October 3, 2020.
- Comparative analysis: In the market cycle, ORION dropped from its peak of $2.36 to a low of $0.00041046, while AAVE has shown more stability, currently trading at $185.32.
Current Market Situation (2025-11-30)
- ORION current price: $0.0005264
- AAVE current price: $185.32
- 24-hour trading volume: ORION $11,657.91 vs AAVE $1,291,009.11
- Market Sentiment Index (Fear & Greed Index): 28 (Fear)
Click to view real-time prices:
- View ORION current price Market Price
- View AAVE current price Market Price
II. Core Factors Affecting Investment Value of ORION vs AAVE
Supply Mechanism Comparison (Tokenomics)
- ORION: Fixed total supply of 100 million tokens, with 15% allocated to the team, 22% for ecosystem development, and 43% for staking rewards
- AAVE: Total supply of 16 million tokens with deflationary mechanism where 80% of protocol fees are used for token burns
- 📌 Historical pattern: Deflationary tokenomics like AAVE's tend to support price stability during market downturns, while ORION's larger allocation to staking rewards incentivizes long-term holding
Institutional Adoption and Market Applications
- Institutional holdings: AAVE has greater institutional adoption with significant DeFi TVL and partnerships with traditional finance entities
- Enterprise adoption: AAVE leads in cross-border settlement applications with over $9 billion in total value locked across lending markets, while ORION focuses on decentralized exchange functionality
- Regulatory attitudes: Both projects face similar regulatory scrutiny, though AAVE's longer market presence has established more regulatory clarity in certain jurisdictions
Technical Development and Ecosystem Building
- ORION technical upgrades: Integration with multiple blockchains including Ethereum, BSC, and Polygon, with cross-chain liquidity aggregation
- AAVE technical development: Continued improvement of V3 protocol with isolation mode, efficiency mode, and portal features for cross-chain expansion
- Ecosystem comparison: AAVE has more robust DeFi integration with lending markets across multiple networks and yield optimization strategies, while ORION focuses on trading infrastructure with lower TVL but potential growth in DEX aggregation
Macroeconomic and Market Cycles
- Performance in inflationary environments: AAVE has demonstrated better resilience during market volatility due to its established utility in lending markets
- Macroeconomic monetary policy: Both tokens show correlation with broader crypto market responses to interest rate changes, with AAVE showing slightly less volatility
- Geopolitical factors: Cross-border transaction demand benefits both protocols, with AAVE's lending functionality providing particular utility during economic uncertainty
III. 2025-2030 Price Prediction: ORION vs AAVE
Short-term Prediction (2025)
- ORION: Conservative $0.000398772 - $0.0005247 | Optimistic $0.0005247 - $0.000692604
- AAVE: Conservative $146.3633 - $185.27 | Optimistic $185.27 - $224.1767
Mid-term Prediction (2027)
- ORION may enter a growth phase, with expected prices ranging from $0.00066343068 to $0.000796116816
- AAVE may enter a bullish market, with expected prices ranging from $219.0539845 to $284.77017985
- Key drivers: Institutional capital inflow, ETF developments, ecosystem growth
Long-term Prediction (2030)
- ORION: Base scenario $0.000870911990863 - $0.001053803508944 | Optimistic scenario $0.001053803508944+
- AAVE: Base scenario $351.8959875902575 - $432.832064736016725 | Optimistic scenario $432.832064736016725+
Disclaimer: The above predictions are based on historical data and market analysis. Cryptocurrency markets are highly volatile and subject to change. This information should not be considered as financial advice.
ORION:
| 年份 | 预测最高价 | 预测平均价格 | 预测最低价 | 涨跌幅 |
|---|---|---|---|---|
| 2025 | 0.000692604 | 0.0005247 | 0.000398772 | 0 |
| 2026 | 0.00071820936 | 0.000608652 | 0.00059039244 | 15 |
| 2027 | 0.000796116816 | 0.00066343068 | 0.0003383496468 | 26 |
| 2028 | 0.00084653754768 | 0.000729773748 | 0.00048894841116 | 38 |
| 2029 | 0.000953668333886 | 0.00078815564784 | 0.000520182727574 | 49 |
| 2030 | 0.001053803508944 | 0.000870911990863 | 0.000522547194517 | 65 |
AAVE:
| 年份 | 预测最高价 | 预测平均价格 | 预测最低价 | 涨跌幅 |
|---|---|---|---|---|
| 2025 | 224.1767 | 185.27 | 146.3633 | 0 |
| 2026 | 233.384619 | 204.72335 | 155.589746 | 10 |
| 2027 | 284.77017985 | 219.0539845 | 164.290488375 | 18 |
| 2028 | 324.96658600575 | 251.912082175 | 229.23999477925 | 35 |
| 2029 | 415.35264109014 | 288.439334090375 | 274.01736738585625 | 55 |
| 2030 | 432.832064736016725 | 351.8959875902575 | 211.1375925541545 | 89 |
IV. Investment Strategy Comparison: ORION vs AAVE
Long-term vs Short-term Investment Strategies
- ORION: Suitable for investors focused on cross-chain solutions and DEX aggregation potential
- AAVE: Suitable for investors seeking DeFi stability and lending market exposure
Risk Management and Asset Allocation
- Conservative investors: ORION: 10% vs AAVE: 90%
- Aggressive investors: ORION: 30% vs AAVE: 70%
- Hedging tools: Stablecoin allocation, options, cross-token portfolios
V. Potential Risk Comparison
Market Risks
- ORION: High volatility, limited liquidity, and susceptibility to market sentiment
- AAVE: Correlation with broader DeFi market trends, interest rate sensitivity
Technical Risks
- ORION: Scalability, network stability across multiple chains
- AAVE: Smart contract vulnerabilities, protocol upgrade risks
Regulatory Risks
- Global regulatory policies may impact both, with AAVE potentially facing more scrutiny due to its larger market presence and lending functions
VI. Conclusion: Which Is the Better Buy?
📌 Investment Value Summary:
- ORION advantages: Cross-chain functionality, potential for growth in DEX aggregation
- AAVE advantages: Established DeFi presence, robust lending markets, institutional adoption
✅ Investment Advice:
- New investors: Consider a small allocation to AAVE for DeFi exposure
- Experienced investors: Balanced portfolio with higher AAVE allocation and some ORION for growth potential
- Institutional investors: Focus on AAVE for its established market position and liquidity
⚠️ Risk Warning: The cryptocurrency market is highly volatile. This article does not constitute investment advice. None
VII. FAQ
Q1: What are the main differences between ORION and AAVE? A: ORION focuses on cross-chain stablecoin banking and DEX aggregation, while AAVE is a leading decentralized lending protocol. AAVE has a larger market cap, higher trading volume, and more institutional adoption, whereas ORION offers potential growth in cross-chain functionality.
Q2: Which token has performed better historically? A: AAVE has shown more price stability and better overall performance. While ORION reached an all-time high of $2.36 in 2021, it has since dropped significantly. AAVE, launched in 2020, has maintained a higher price and is currently trading at $185.32.
Q3: How do the supply mechanisms of ORION and AAVE differ? A: ORION has a fixed total supply of 100 million tokens, with 43% allocated for staking rewards. AAVE has a total supply of 16 million tokens with a deflationary mechanism, where 80% of protocol fees are used for token burns.
Q4: What are the key factors affecting the investment value of these tokens? A: Key factors include supply mechanisms, institutional adoption, technical development, ecosystem building, and macroeconomic conditions. AAVE generally leads in institutional adoption and DeFi integration, while ORION offers potential in cross-chain solutions.
Q5: What are the predicted price ranges for ORION and AAVE in 2030? A: For ORION, the base scenario predicts $0.000870911990863 - $0.001053803508944, with an optimistic scenario above $0.001053803508944. For AAVE, the base scenario predicts $351.8959875902575 - $432.832064736016725, with an optimistic scenario above $432.832064736016725.
Q6: How should investors allocate their portfolio between ORION and AAVE? A: Conservative investors might consider allocating 10% to ORION and 90% to AAVE, while aggressive investors might opt for 30% ORION and 70% AAVE. The exact allocation depends on individual risk tolerance and investment goals.
Q7: What are the main risks associated with investing in ORION and AAVE? A: Both face market risks such as volatility and regulatory uncertainties. ORION has higher volatility and liquidity risks, while AAVE faces risks related to smart contract vulnerabilities and broader DeFi market trends. Regulatory risks are present for both, with AAVE potentially facing more scrutiny due to its larger market presence.
Share
Content
Introduction: ORION vs AAVE Investment Comparison
I. Price History Comparison and Current Market Status
II. Core Factors Affecting Investment Value of ORION vs AAVE
III. 2025-2030 Price Prediction: ORION vs AAVE
IV. Investment Strategy Comparison: ORION vs AAVE
V. Potential Risk Comparison
VI. Conclusion: Which Is the Better Buy?
VII. FAQ

