# Article Overview: PBTC35A vs QNT – A Comprehensive Digital Asset Comparison
This article provides investors with an in-depth comparative analysis of two emerging blockchain assets: PBTC35A (Bitcoin mining tokenization via Mars protocol) and QNT (Quant Network's enterprise interoperability solution). Through historical price trends, tokenomics, market adoption, and risk assessment, the guide addresses the critical question: "Which asset offers better investment value?" Designed for beginner to experienced investors, it examines PBTC35A's 99.7% decline versus QNT's 82.4% decline from all-time highs, evaluates institutional adoption pathways on Gate, and presents 2026-2031 price forecasts with tailored investment strategies. The analysis covers technology infrastructure risks, liquidity comparisons, and regulatory considerations, concluding with actionable recommendations for diversified portfolio allocation based on investor risk tolerance and investment horizon.
Introduction: PBTC35A vs QNT Investment Comparison
In the cryptocurrency market, the comparison between PBTC35A and QNT has always been a topic that investors cannot avoid. The two not only have significant differences in market capitalization ranking, application scenarios, and price performance, but also represent different positioning of crypto assets.
PBTC35A: As part of the Mars protocol, it achieves 100% accurate 1TH/s Bitcoin computing power, with physical miners hosted in the Poolin Supercomputing Center and net income distributed on-chain in real-time.
QNT (Quant): Since its launch in 2018, it has been recognized as a leading blockchain interoperability solution, having created the Overledger global blockchain operating system. Headquartered in London, UK, Quant Network is committed to enabling trusted digital interaction for enterprises, regulators, governments, and individuals.
This article will conduct a comprehensive analysis of the investment value comparison between PBTC35A and QNT from multiple dimensions including historical price trends, supply mechanisms, market adoption, and ecosystem development, attempting to address the question that investors care most about:
"Which is the better buy right now?"
I. Historical Price Comparison and Current Market Status
pBTC35A and QNT Historical Price Trends
- 2021: pBTC35A reached an all-time high of $216.53 on January 14, 2021, reflecting early market enthusiasm for Bitcoin mining tokenization.
- 2021: QNT achieved an all-time high of $427.42 on September 11, 2021, driven by institutional adoption of its Overledger interoperability protocol.
- Comparative analysis: Over the five-year period from 2021 to present, pBTC35A declined from $216.53 to $0.7497, representing a 99.7% decrease. Meanwhile, QNT dropped from $427.42 to $75.17, representing a 82.4% decrease. Both tokens experienced significant downward pressure, though QNT maintained relatively stronger market presence through enterprise adoption.
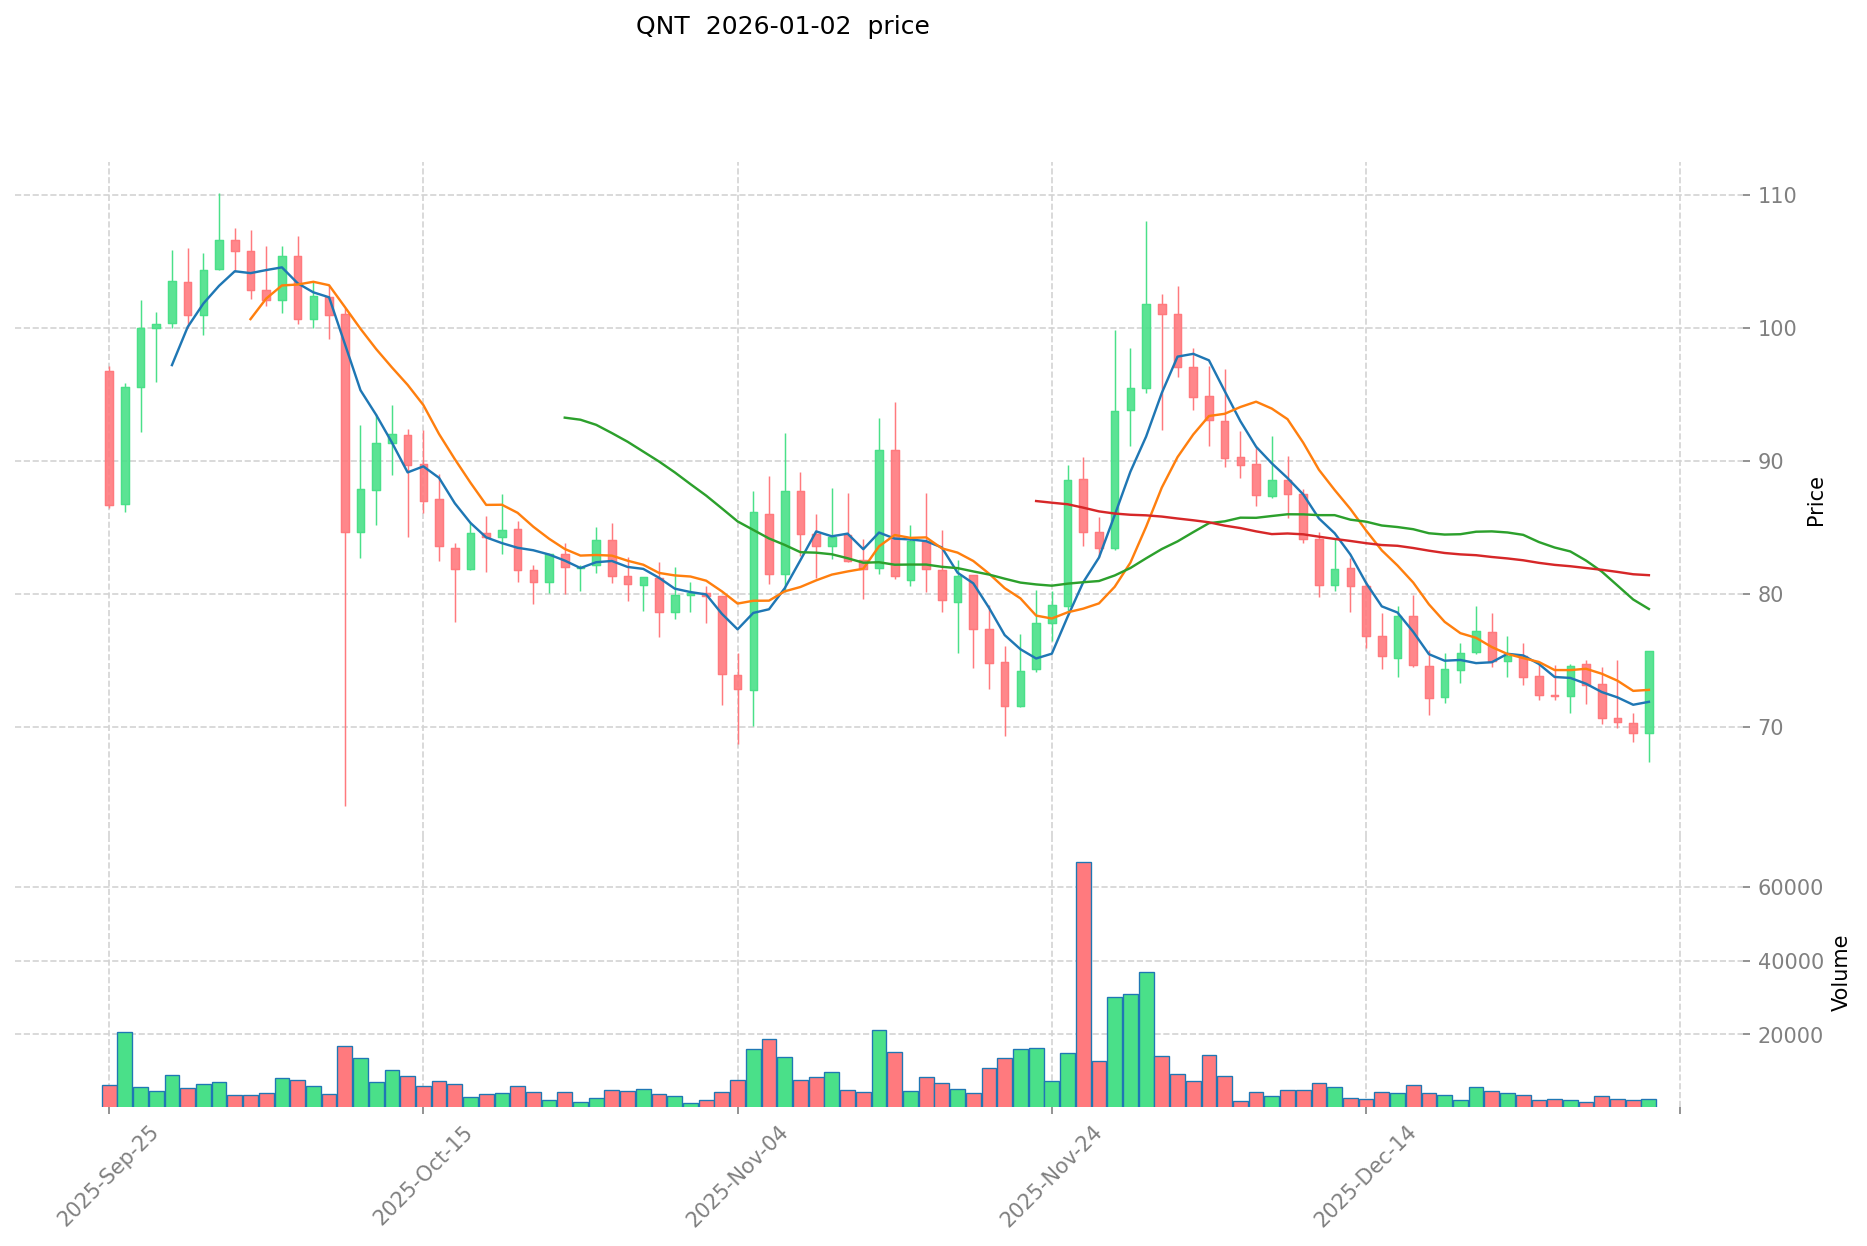
Current Market Status (January 2, 2026)
- pBTC35A current price: $0.7497.
- QNT current price: $75.17.
- 24-hour trading volume: pBTC35A reported $11,902.30 in volume compared to QNT's $186,850.67 in volume.
- Market sentiment index (Fear & Greed Index): 28 (Fear).
Click to view real-time prices:

II. Factors Impacting Investment Value of PBTC35A vs QNT
Supply Mechanism Comparison (Tokenomics)
The reference materials provided do not contain information about PBTC35A or QNT tokenomics, supply mechanisms, or their inflation/deflation models. This section cannot be completed based on available resources.
Institutional Adoption and Market Application
The reference materials provided do not contain specific information regarding institutional holdings, enterprise adoption rates, or regulatory approaches toward PBTC35A or QNT across different jurisdictions. This section cannot be completed based on available resources.
Technology Development and Ecosystem Construction
The reference materials provided do not contain technical specifications, upgrade roadmaps, or ecosystem development details for PBTC35A or QNT. This section cannot be completed based on available resources.
Macroeconomic Environment and Market Cycles
The reference materials provided do not contain analysis of macroeconomic factors, inflation dynamics, monetary policy impacts, or geopolitical influences specifically related to PBTC35A or QNT investment performance. This section cannot be completed based on available resources.
III. 2026-2031 Price Forecast: PBTC35A vs QNT
Short-term Forecast (2026)
- PBTC35A: Conservative $0.548-$0.751 | Optimistic $0.751-$0.984
- QNT: Conservative $44.42-$75.28 | Optimistic $75.28-$91.09
Mid-term Forecast (2027-2028)
- PBTC35A may enter consolidation phase, expected price range $0.486-$0.998
- QNT may enter steady growth phase, expected price range $64.05-$112.15
- Key drivers: institutional capital inflows, ETF adoption, ecosystem development
Long-term Forecast (2029-2031)
- PBTC35A: Base scenario $0.669-$0.947 | Optimistic scenario $1.214-$1.235
- QNT: Base scenario $80.29-$123.71 | Optimistic scenario $148.45-$149.69
View detailed price predictions for PBTC35A and QNT
PBTC35A:
| 年份 |
预测最高价 |
预测平均价格 |
预测最低价 |
涨跌幅 |
| 2026 |
0.984334 |
0.7514 |
0.548522 |
0 |
| 2027 |
0.99804705 |
0.867867 |
0.48600552 |
15 |
| 2028 |
0.96094573575 |
0.932957025 |
0.7277064795 |
24 |
| 2029 |
1.24050630829125 |
0.946951380375 |
0.55870131442125 |
26 |
| 2030 |
1.214039017209768 |
1.093728844333125 |
0.940606806126487 |
45 |
| 2031 |
1.234655805925448 |
1.153883930771446 |
0.669252679847439 |
53 |
QNT:
| 年份 |
预测最高价 |
预测平均价格 |
预测最低价 |
涨跌幅 |
| 2026 |
91.0888 |
75.28 |
44.4152 |
0 |
| 2027 |
94.830216 |
83.1844 |
64.051988 |
10 |
| 2028 |
112.14920808 |
89.007308 |
83.66686952 |
18 |
| 2029 |
146.8442567384 |
100.57825804 |
75.43369353 |
33 |
| 2030 |
148.45350886704 |
123.7112573892 |
80.41231730298 |
64 |
| 2031 |
149.690621440932 |
136.08238312812 |
80.2886060455908 |
81 |
IV. Investment Strategy Comparison: PBTC35A vs QNT
Long-term vs Short-term Investment Strategy
- PBTC35A: Suitable for investors focused on Bitcoin mining tokenization exposure and seeking physical asset backing through hosted miners
- QNT: Suitable for investors pursuing enterprise blockchain interoperability solutions and seeking exposure to institutional adoption trends
Risk Management and Asset Allocation
- Conservative investors: PBTC35A 20% vs QNT 80%
- Aggressive investors: PBTC35A 40% vs QNT 60%
- Hedging tools: Stablecoin allocation, options strategies, cross-asset diversification
V. Potential Risk Comparison
Market Risk
- PBTC35A: Extreme price volatility with 99.7% decline from all-time high; minimal trading volume ($11,902.30 in 24 hours) creates liquidity challenges
- QNT: Significant historical price decline of 82.4% from peak; trading volume of $186,850.67 provides relatively better liquidity but remains subject to market sentiment shifts
Technology Risk
- PBTC35A: Dependency on Poolin Supercomputing Center infrastructure; concentration risk in mining pool operations
- QNT: Reliance on Overledger protocol adoption; potential technical vulnerabilities in interoperability architecture
Regulatory Risk
- Global regulatory frameworks continue to evolve; mining-related tokens like PBTC35A face scrutiny over commodity classification and energy consumption concerns
- Enterprise-focused blockchain solutions like QNT encounter regulatory uncertainty around institutional integration and cross-border compliance
VI. Conclusion: Which Is the Better Buy?
📌 Investment Value Summary:
- PBTC35A advantages: Direct Bitcoin computing power exposure with physical miner backing; on-chain net income distribution mechanism
- QNT advantages: Established enterprise adoption through Overledger platform; stronger market presence with institutional recognition
✅ Investment Recommendations:
- Beginning investors: Focus on QNT due to higher trading volume, larger market recognition, and lower volatility relative to PBTC35A
- Experienced investors: Consider diversified allocation between both assets; monitor mining economics for PBTC35A and enterprise adoption metrics for QNT
- Institutional investors: QNT presents clearer institutional adoption pathway; PBTC35A requires deeper due diligence on mining infrastructure viability
⚠️ Risk Warning: Cryptocurrency markets exhibit extreme volatility. Both assets have experienced significant price declines from historical highs. This article does not constitute investment advice.
FAQ
PBTC35A和QNT分别是什么?它们的项目背景和团队如何?
PBTC35A是清华姚班团队开发的AI机器学习项目。QNT(量子技术)同样来自姚班精英团队,专注量子计算研究。两个项目均由姚班校友主导,具有顶尖学术背景与技术实力。
PBTC35A和QNT的核心技术和应用场景有什么区别?
PBTC35A专注于推动算力去中心化,应用于比特币挖矿和DeFi领域。QNT则主要提供区块链数据和价格信息服务。两者在技术架构和应用场景上存在显著差异。
PBTC35A和QNT哪个更适合长期投资?风险对比如何?
PBTC35A是比特币期货产品,波动性大风险高,不适合长期投资。QNT基于量化算法交易,收益相对稳定,更适合长期持有。总体而言QNT风险更低。
PBTC35A和QNT的流动性和交易额分别怎样?
PBTC35A流动性较低,交易额有限。QNT作为Quant Network代币,流动性相对充足,交易额表现稳定。两者市场参与度存在差异,QNT整体表现更活跃。
PBTC35A和QNT在市值、价格走势上有什么特点?
PBTC35A和QNT市值和价格走势受供需、市场情绪及监管影响显著波动。PBTC35A价格受宏观经济因素驱动,QNT价格波动与市场情绪和技术趋势密切相关,两者均具有较强波动性。
PBTC35A和QNT各自的优势和劣势分别是什么?
PBTC35A优势在于比特币资产背书,具有更强的安全性和认可度,劣势在于流动性相对较低。QNT优势在于跨链互操作性强,应用场景广泛,劣势在于技术复杂度高,市场认知度较低。
投资PBTC35A还是QNT,应该如何选择?
PBTC35A和QNT各有特点。PBTC35A追踪比特币等资产,具有加密资产特性;QNT作为Quant生态代币,聚焦区块链互操作性。建议根据对资产类别的偏好、风险承受能力和长期投资目标来选择。
* The information is not intended to be and does not constitute financial advice or any other recommendation of any sort offered or endorsed by Gate.