This article offers a comprehensive comparison between Pondo (PNDO) and Aptos (APT) as investment opportunities, highlighting historical price trends, token supply mechanisms, institutional adoption, and technological ecosystems. It addresses the key question of which token is a better buy currently, catering to both novice and experienced investors. Structured into sections detailing price history, investment strategies, risk assessments, and market conditions, the article provides valuable insights into the investment potential and risks of both tokens. Essential for investors seeking informed decisions, it emphasizes PNDO’s niche market and APT’s broader applications and enterprise solutions.
Introduction: Investment Comparison of PNDO vs APT
In the cryptocurrency market, the comparison between Pondo (PNDO) vs Aptos (APT) has been an unavoidable topic for investors. The two not only show significant differences in market cap ranking, application scenarios, and price performance, but also represent different positioning in crypto assets.
Pondo (PNDO): Launched as the first liquid-staking protocol on the Aleo blockchain, it has gained market recognition for enabling users to earn rewards from ALEO tokens while maintaining liquidity.
Aptos (APT): Since its inception in 2022, it has been hailed as a high-performance PoS Layer 1 project, focusing on delivering a secure and scalable blockchain.
This article will provide a comprehensive analysis of the investment value comparison between PNDO and APT, focusing on historical price trends, supply mechanisms, institutional adoption, technological ecosystems, and future predictions, attempting to answer the question most concerning to investors:
"Which is the better buy right now?"
I. Price History Comparison and Current Market Status
PNDO (Coin A) and APT (Coin B) Historical Price Trends
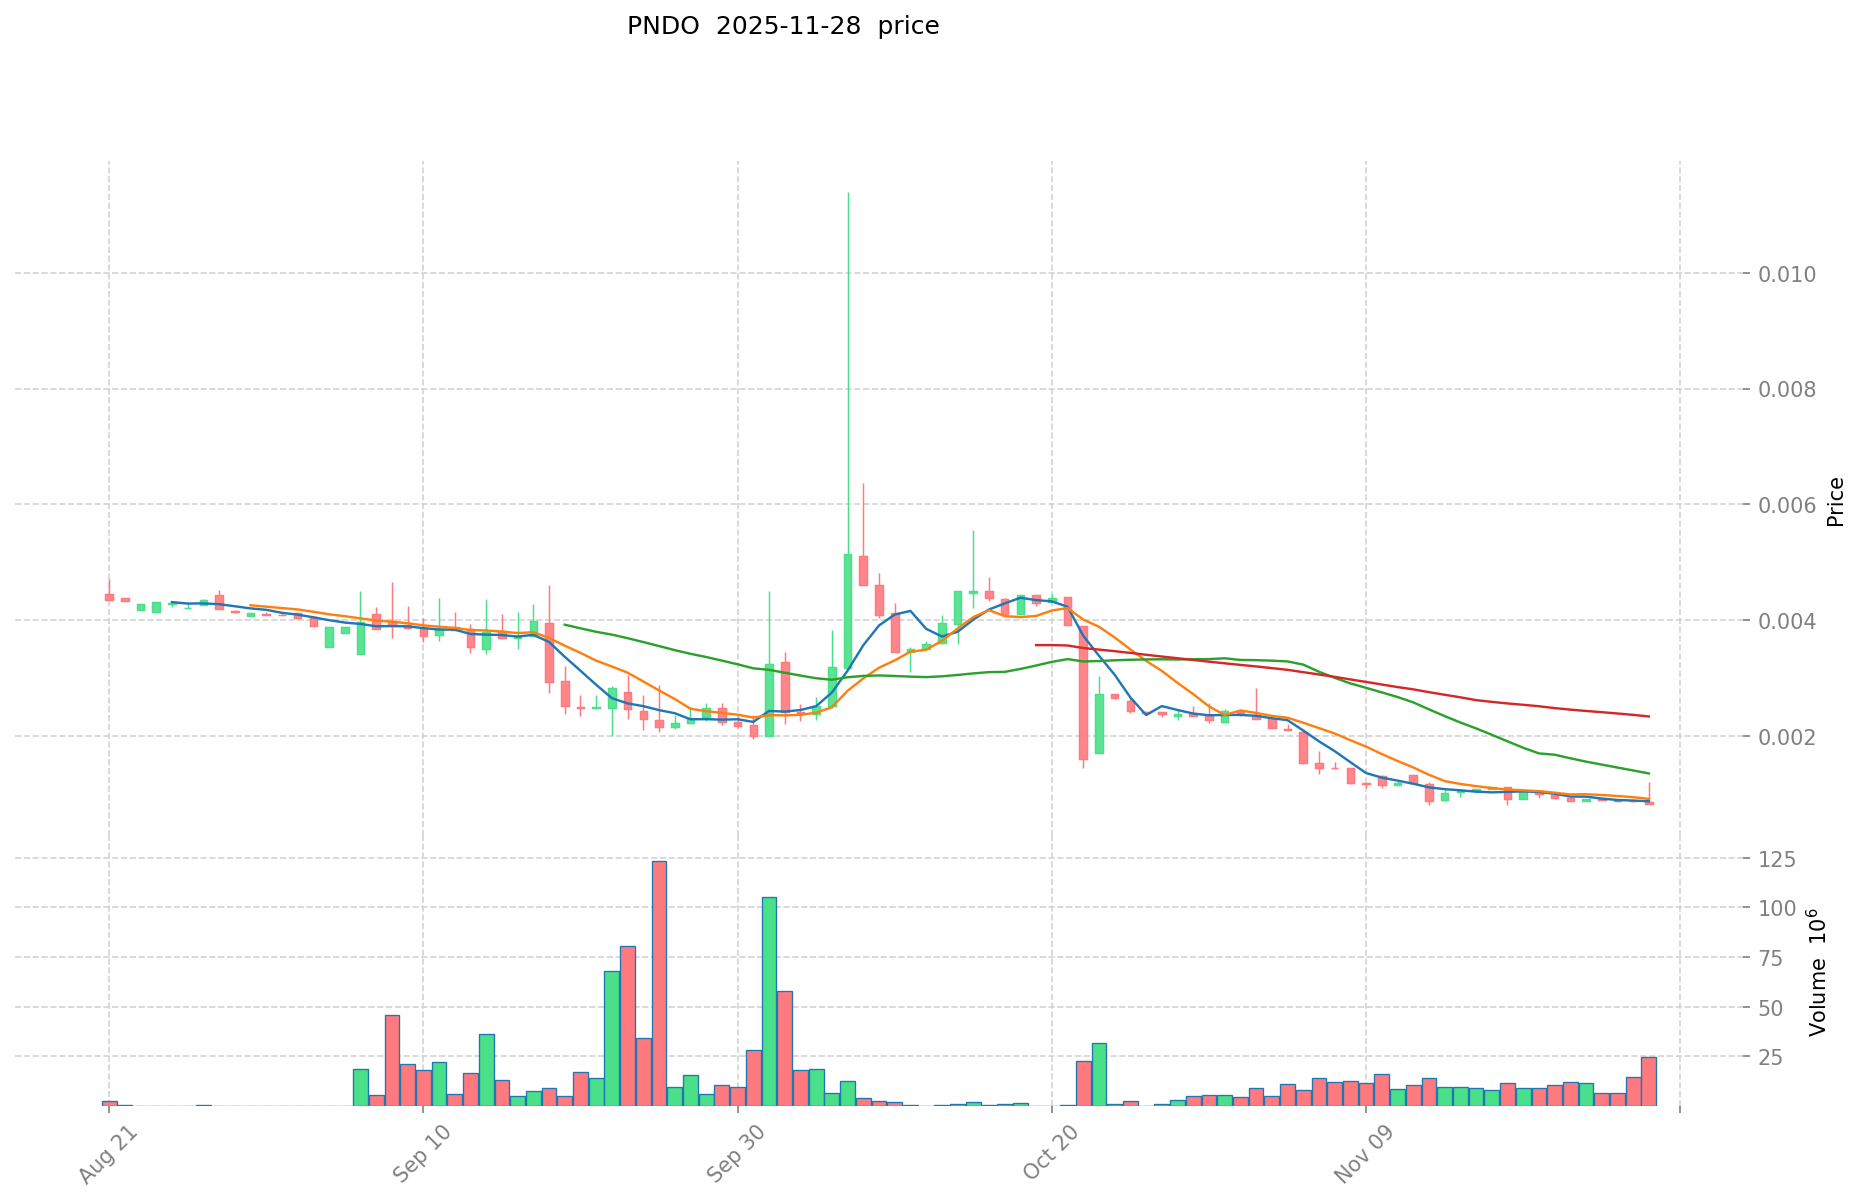
- 2025: PNDO reached its all-time high of $0.98996 on April 9, 2025, but has since experienced a significant decline.
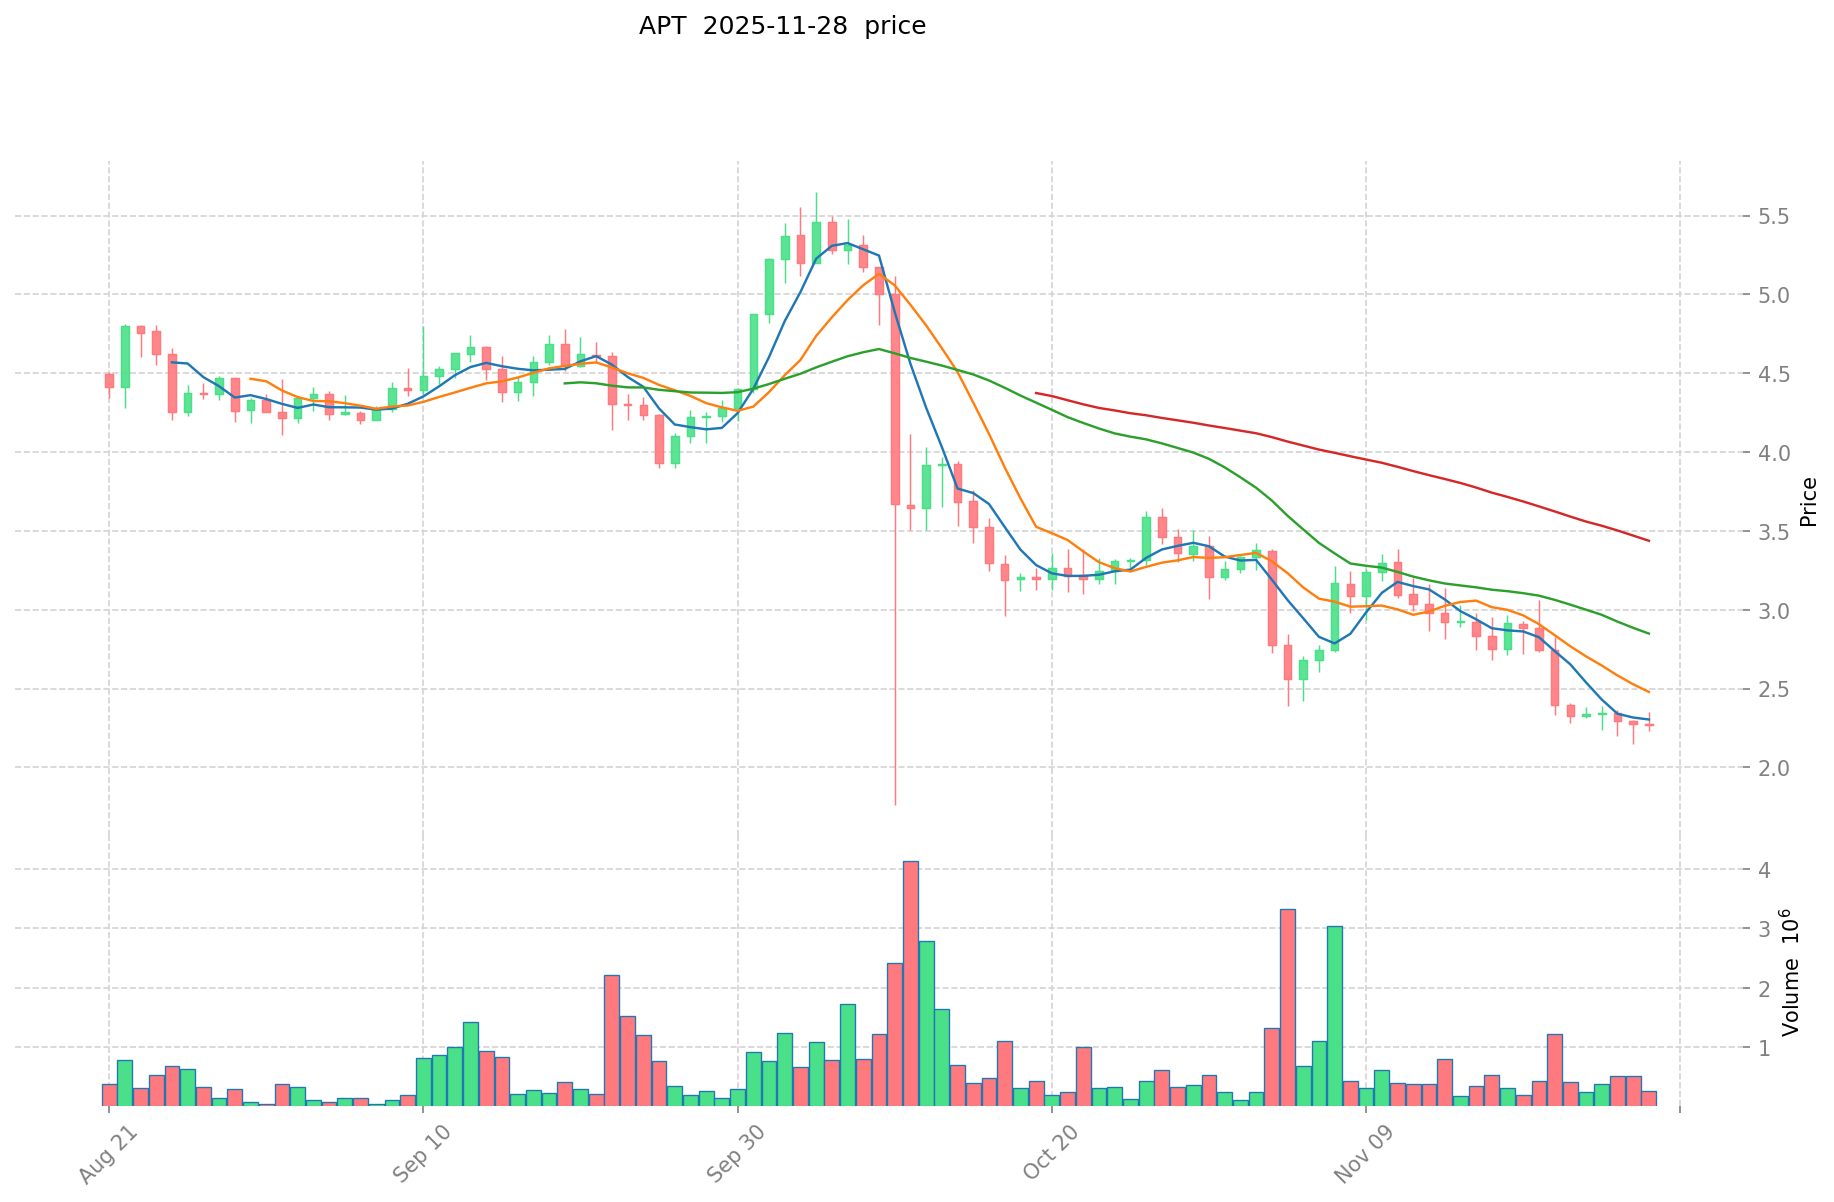
- 2025: APT hit its all-time low of $2.12 on November 29, 2025, showing a downward trend throughout the year.
- Comparative analysis: In the current market cycle, PNDO has dropped from its peak of $0.98996 to a low of $0.0008, while APT has fallen from its all-time high of $19.92 to its current price near its all-time low.
Current Market Situation (2025-11-29)
- PNDO current price: $0.0008578
- APT current price: $2.131
- 24-hour trading volume: PNDO $25,302.07 vs APT $796,933.20
- Market Sentiment Index (Fear & Greed Index): 25 (Extreme Fear)
Click to view real-time prices:
- Check PNDO current price Market Price
- Check APT current price Market Price
II. Core Factors Affecting PNDO vs APT Investment Value
Supply Mechanisms Comparison (Tokenomics)
- PNDO: Fixed supply of 88,800,000 tokens, with a deflationary model through token burning mechanism
- APT: Maximum supply of 1 billion tokens, with gradual distribution over time
- 📌 Historical pattern: Deflationary models like PNDO's typically create upward price pressure as supply decreases, while APT's larger but controlled distribution may lead to more gradual price appreciation.
Institutional Adoption and Market Applications
- Institutional holdings: APT has gained more institutional attention due to its connection with Aptos Labs and backing from major venture capital firms
- Enterprise adoption: APT has stronger enterprise applications through the Move programming language enabling more secure smart contracts, while PNDO focuses on the gaming ecosystem
- National policies: Regulatory clarity remains similar for both tokens, though APT's broader technological applications may offer more regulatory flexibility
Technology Development and Ecosystem Building
- PNDO technology: Integration with Pando.im ecosystem focusing on GameFi applications and play-to-earn models
- APT technology: Built on the Move programming language with parallel execution capabilities, offering higher transaction throughput and scalability
- Ecosystem comparison: APT has developed a more diverse ecosystem spanning DeFi, NFTs, gaming and enterprise solutions, while PNDO is more concentrated on gaming applications
Macroeconomic and Market Cycles
- Performance in inflationary environments: Both tokens lack sufficient historical data to determine clear patterns during inflation
- Macroeconomic monetary policy: Interest rates and USD strength affect both tokens similarly, with high correlation to broader crypto market movements
- Geopolitical factors: APT's broader technological applications may provide more resilience against regional regulatory changes
III. 2025-2030 Price Prediction: PNDO vs APT
Short-term Prediction (2025)
- PNDO: Conservative $0.00081491 - $0.0008578 | Optimistic $0.0008578 - $0.000935002
- APT: Conservative $1.33434 - $2.118 | Optimistic $2.118 - $2.7534
Mid-term Prediction (2027)
- PNDO may enter a growth phase, with an estimated price range of $0.00074889821545 - $0.0012643736105
- APT may enter a bullish market, with an estimated price range of $1.945515375 - $3.3978015
- Key drivers: Institutional capital inflow, ETF, ecosystem development
Long-term Prediction (2030)
- PNDO: Base scenario $0.001466360942009 - $0.00171564230215 | Optimistic scenario $0.00171564230215
- APT: Base scenario $4.2147864297 - $5.605665951501 | Optimistic scenario $5.605665951501
View detailed price predictions for PNDO and APT
Disclaimer
PNDO:
| 年份 |
预测最高价 |
预测平均价格 |
预测最低价 |
涨跌幅 |
| 2025 |
0.000935002 |
0.0008578 |
0.00081491 |
0 |
| 2026 |
0.00104878917 |
0.000896401 |
0.0007171208 |
4 |
| 2027 |
0.0012643736105 |
0.000972595085 |
0.00074889821545 |
13 |
| 2028 |
0.001442844808597 |
0.00111848434775 |
0.000570427017352 |
30 |
| 2029 |
0.001652057305844 |
0.001280664578173 |
0.000717172163777 |
49 |
| 2030 |
0.00171564230215 |
0.001466360942009 |
0.001422370113748 |
70 |
APT:
| 年份 |
预测最高价 |
预测平均价格 |
预测最低价 |
涨跌幅 |
| 2025 |
2.7534 |
2.118 |
1.33434 |
0 |
| 2026 |
3.044625 |
2.4357 |
1.412706 |
14 |
| 2027 |
3.3978015 |
2.7401625 |
1.945515375 |
29 |
| 2028 |
4.35795444 |
3.068982 |
2.3017365 |
44 |
| 2029 |
4.7161046394 |
3.71346822 |
2.7108318006 |
74 |
| 2030 |
5.605665951501 |
4.2147864297 |
3.413977008057 |
98 |
IV. Investment Strategy Comparison: PNDO vs APT
Long-term vs Short-term Investment Strategies
- PNDO: Suitable for investors focused on gaming ecosystems and potential growth in the Aleo blockchain space
- APT: Suitable for investors looking for a more established Layer 1 blockchain with broader technological applications
Risk Management and Asset Allocation
- Conservative investors: PNDO: 10% vs APT: 90%
- Aggressive investors: PNDO: 30% vs APT: 70%
- Hedging tools: Stablecoin allocation, options, cross-currency portfolio
V. Potential Risk Comparison
Market Risks
- PNDO: Higher volatility due to smaller market cap and focused ecosystem
- APT: Susceptible to broader cryptocurrency market trends and Layer 1 competition
Technical Risks
- PNDO: Scalability, network stability of the Aleo blockchain
- APT: Potential security vulnerabilities in the Move language, network congestion during high demand
Regulatory Risks
- Global regulatory policies may have a more significant impact on APT due to its broader application scope, while PNDO might face specific regulations related to gaming and gambling in certain jurisdictions
VI. Conclusion: Which Is the Better Buy?
📌 Investment Value Summary:
- PNDO advantages: Niche market in liquid staking on Aleo blockchain, potential for high growth in a specific ecosystem
- APT advantages: More established ecosystem, broader technological applications, stronger institutional backing
✅ Investment Advice:
- Novice investors: Consider a small allocation to APT as part of a diversified cryptocurrency portfolio
- Experienced investors: Balanced approach with a larger allocation to APT and a smaller, speculative position in PNDO
- Institutional investors: Focus on APT for its broader ecosystem and technological applications, with potential for enterprise solutions
⚠️ Risk Warning: The cryptocurrency market is highly volatile, and this article does not constitute investment advice.
None
VII. FAQ
Q1: What are the main differences between PNDO and APT?
A: PNDO is a liquid-staking protocol on the Aleo blockchain focusing on gaming ecosystems, while APT is a high-performance Layer 1 blockchain with broader applications across DeFi, NFTs, and enterprise solutions.
Q2: Which token has shown better price performance recently?
A: APT has shown better recent price stability, trading near $2.131, while PNDO has experienced a significant decline from its all-time high of $0.98996 to $0.0008578.
Q3: How do the supply mechanisms of PNDO and APT differ?
A: PNDO has a fixed supply of 88,800,000 tokens with a deflationary model, while APT has a maximum supply of 1 billion tokens with gradual distribution over time.
Q4: Which token has gained more institutional adoption?
A: APT has gained more institutional attention due to its connection with Aptos Labs and backing from major venture capital firms.
Q5: What are the long-term price predictions for PNDO and APT by 2030?
A: The base scenario for PNDO is $0.001466360942009 - $0.00171564230215, while for APT it's $4.2147864297 - $5.605665951501.
Q6: How should investors allocate their portfolio between PNDO and APT?
A: Conservative investors might consider 10% PNDO and 90% APT, while aggressive investors might opt for 30% PNDO and 70% APT.
Q7: What are the main risks associated with investing in PNDO and APT?
A: PNDO faces higher volatility due to its smaller market cap and focused ecosystem, while APT is susceptible to broader cryptocurrency market trends and Layer 1 competition. Both face potential regulatory risks.
* The information is not intended to be and does not constitute financial advice or any other recommendation of any sort offered or endorsed by Gate.


