This comprehensive guide compares ROCK and OP cryptocurrencies across multiple investment dimensions. ROCK is an emerging yield-bearing Bitcoin DeFi solution launched in 2024 utilizing dMPC technology, while OP is an established Ethereum Layer 2 scaling solution since 2022. The article analyzes historical price performance, tokenomics, institutional adoption, and technological ecosystems. Current market data shows ROCK at $0.019677 with $15,548.71 daily volume, while OP trades at $0.253 with $1,526,405.77 volume. Price projections through 2031 suggest different growth trajectories. Conservative investors favor OP's higher liquidity and market maturity, while aggressive investors may consider ROCK's emerging infrastructure potential. Both assets face market, technical, and regulatory risks requiring careful portfolio allocation and independent research before investment decisions.
Introduction: Investment Comparison Between ROCK and OP
In the cryptocurrency market, the comparison between ROCK vs OP has consistently been a topic investors cannot overlook. Both exhibit notable differences in market cap rankings, application scenarios, and price performance, representing distinct positioning within the crypto asset landscape.
ROCK (ROCK): Launched in 2024, it has gained market recognition through its positioning as a yield-bearing wrapped Bitcoin solution leveraging distributed Multi-Party Computation (dMPC) technology for DeFi integration.
OP (OP): Since its introduction in 2022, it has been recognized as a Layer 2 scaling solution for Ethereum, ranking among cryptocurrencies with significant trading volume and market presence in blockchain infrastructure.
This article will comprehensively analyze the investment value comparison between ROCK vs OP, focusing on historical price trends, supply mechanisms, institutional adoption, technical ecosystems, and future forecasts, attempting to address investors' most pressing question:
"Which is the better buy right now?"
I. Historical Price Comparison and Current Market Status
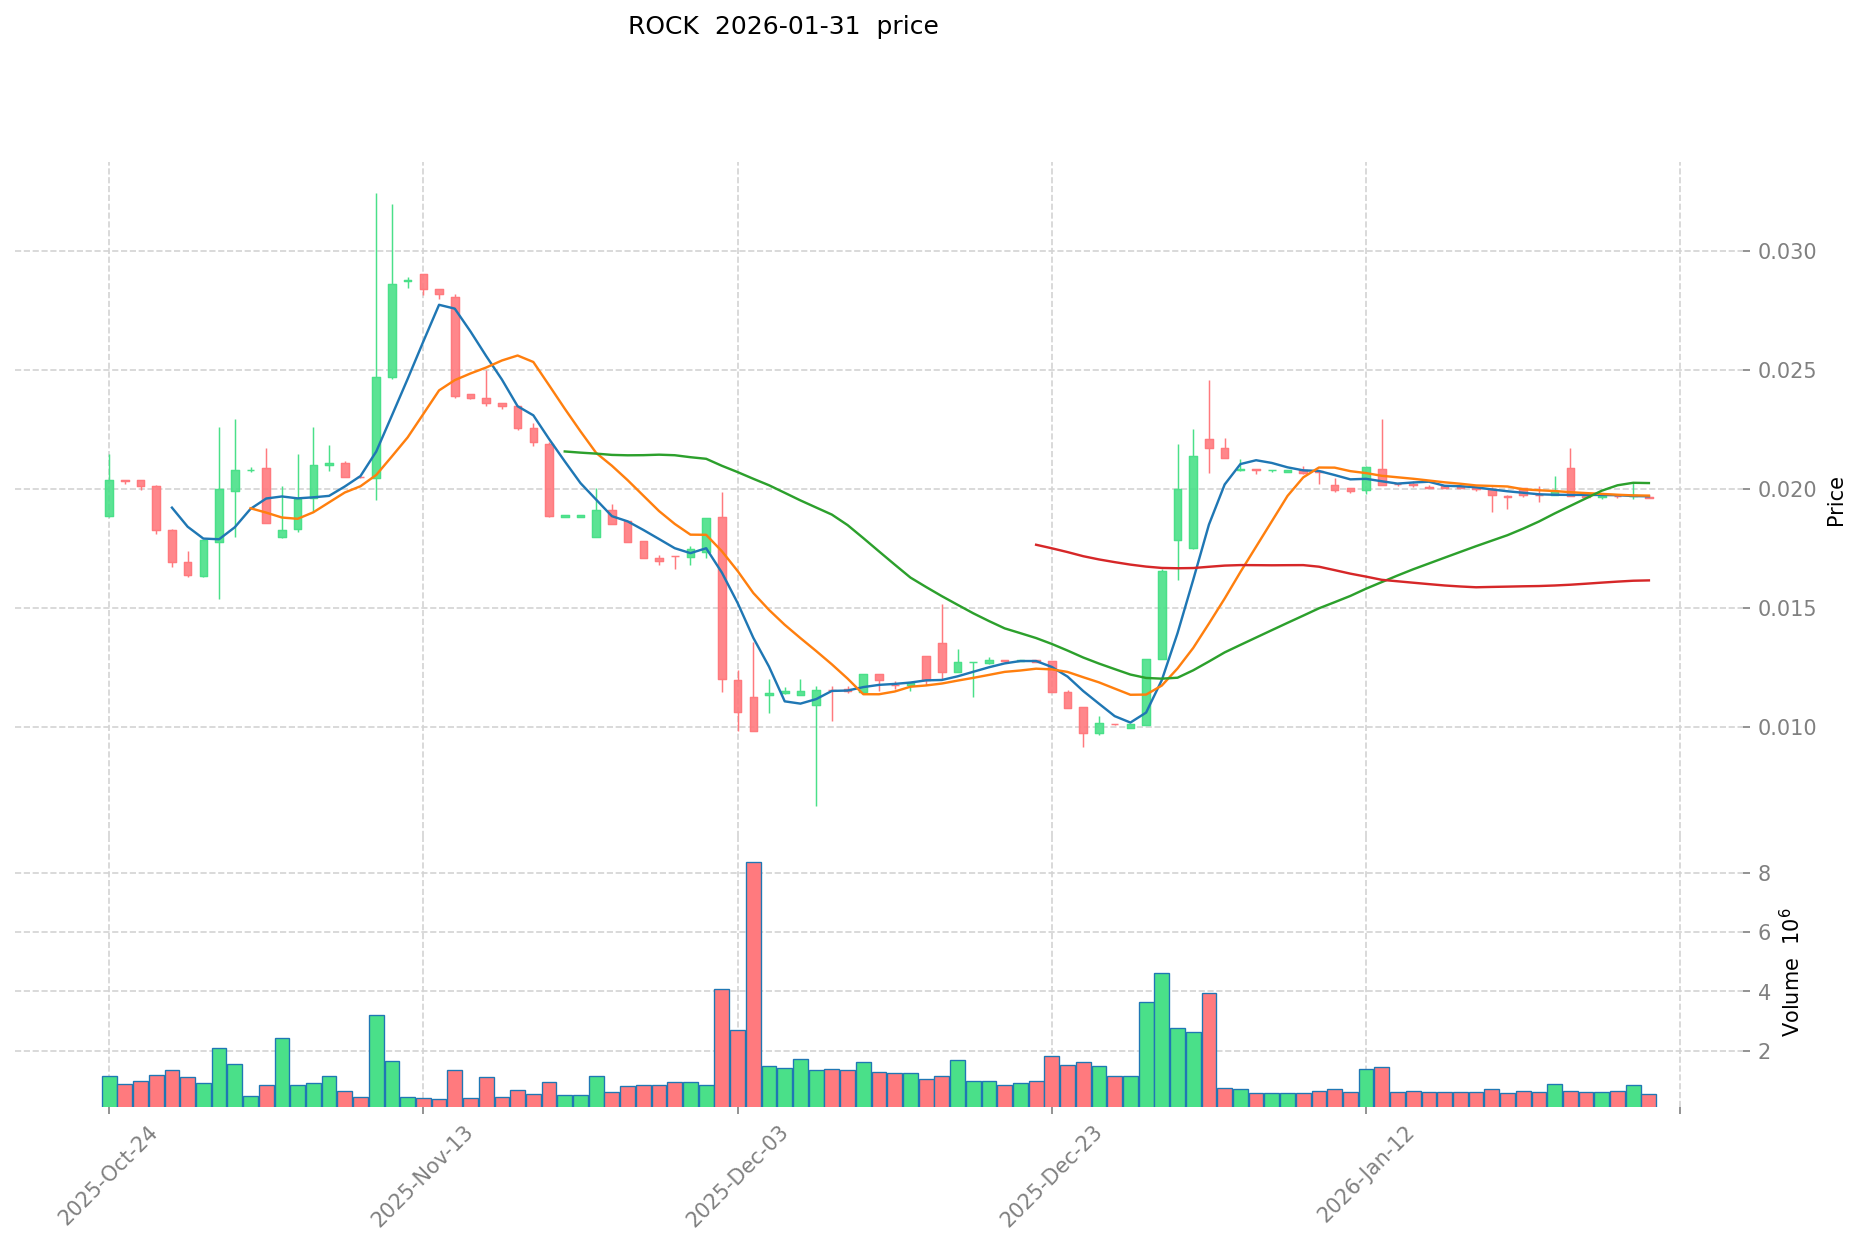
- 2024: ROCK reached its all-time high of $0.176 on November 29, 2024, shortly after its market debut in November 2024, reflecting initial investor enthusiasm for its decentralized Bitcoin DeFi solution.
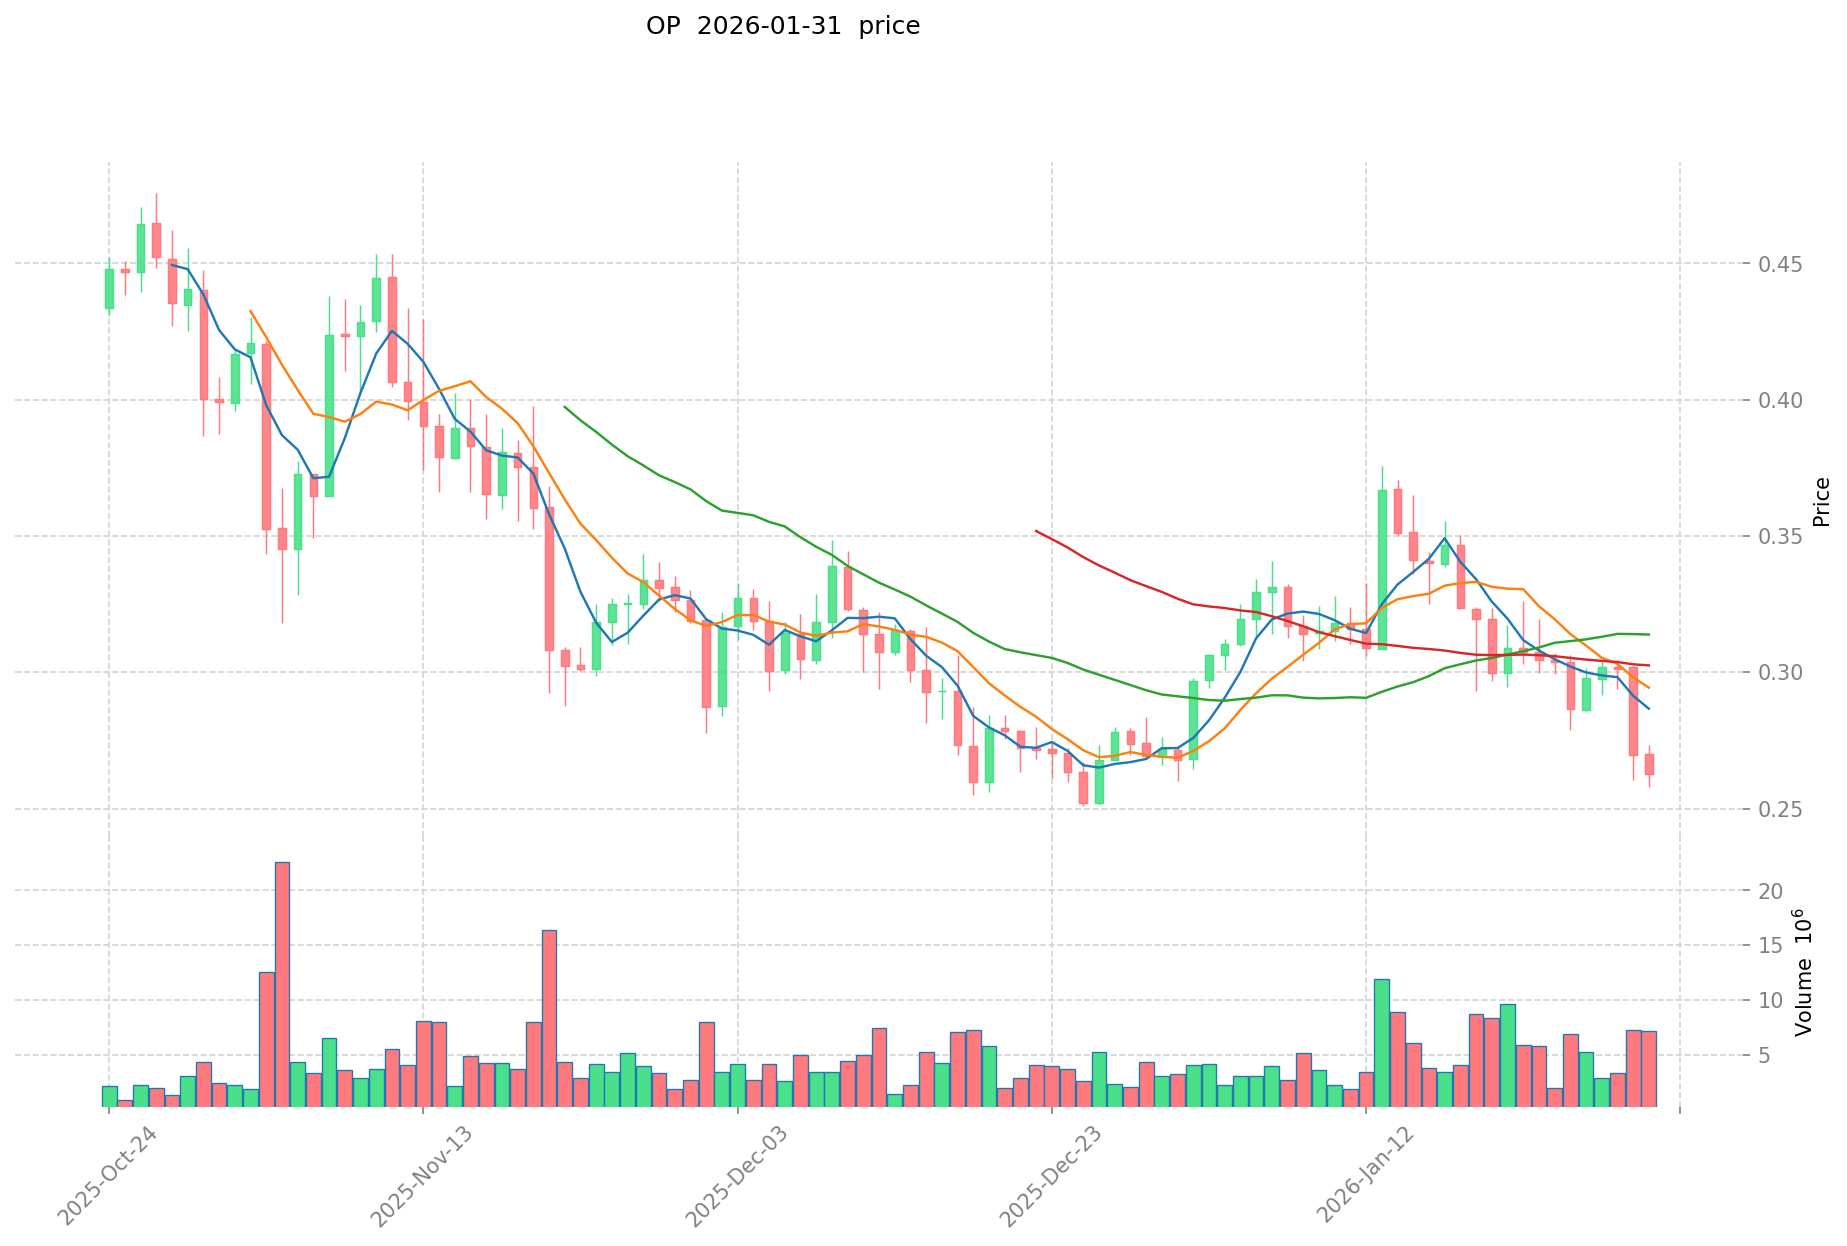
- 2024: OP experienced significant volatility, hitting its all-time high of $4.84 on March 6, 2024, driven by growing adoption of Layer 2 scaling solutions for Ethereum.
- Comparative Analysis: Throughout recent market cycles, ROCK declined from its peak of $0.176 to a low of $0.00668 in December 2025, representing a substantial correction. During a similar period, OP dropped from $4.84 to $0.251922 in late December 2025, demonstrating comparable downward pressure across the broader cryptocurrency market.
Current Market Conditions (2026-01-31)
- ROCK Current Price: $0.019677
- OP Current Price: $0.253
- 24-Hour Trading Volume: ROCK recorded $15,548.71, while OP demonstrated significantly higher liquidity with $1,526,405.77
- Market Sentiment Index (Fear & Greed Index): 20 (Extreme Fear)
View real-time prices:
II. Core Factors Influencing ROCK vs OP Investment Value
Supply Mechanism Comparison (Tokenomics)
The tokenomics framework represents a fundamental determinant of long-term value dynamics in crypto assets. Core elements include base value proposition, token supply structure, demand drivers, and utility mechanisms. When evaluating supply mechanisms, investors should examine initial token distribution patterns, vesting schedules, and unlock timelines to comprehensively assess the protocol's tokenomics architecture.
📌 Historical Pattern: Supply mechanism design has demonstrated significant influence on price cycle dynamics, with deflationary models and fixed supply caps potentially supporting different value trajectories compared to inflationary or uncapped models.
Institutional Adoption and Market Application
-
Institutional Holdings: Assessment of institutional preference requires examining on-chain data, custody solutions adoption, and institutional-grade infrastructure development around each asset.
-
Enterprise Adoption: Evaluation of real-world utility spans cross-border payment integration, settlement infrastructure deployment, and incorporation into diversified investment portfolios. The extent of enterprise-level adoption may vary significantly between different crypto assets.
-
National Policy Frameworks: Regulatory attitudes toward crypto assets differ substantially across jurisdictions, with some nations implementing clearer frameworks while others maintain more restrictive approaches. These policy variations can materially impact adoption trajectories.
Technology Development and Ecosystem Construction
Technological advancement and ecosystem maturation constitute critical evaluation dimensions. Development activities may include protocol upgrades, scalability enhancements, and security improvements. The comparative assessment should examine:
- DeFi integration depth and total value locked metrics
- NFT ecosystem development and marketplace activity
- Payment infrastructure deployment and merchant adoption
- Smart contract functionality and developer activity levels
Ecosystem vitality indicators include active developer communities, transaction volumes, and the breadth of use cases being deployed on each network.
Macroeconomic Context and Market Cycles
-
Performance in Inflationary Environments: Different crypto assets may exhibit varying characteristics during periods of elevated inflation, with some potentially serving as alternative stores of value while others demonstrate different behavior patterns.
-
Macroeconomic Monetary Policy Impact: Interest rate adjustments, central bank policy shifts, and dollar index fluctuations can influence crypto asset valuations through multiple channels, including risk appetite changes and alternative investment attractiveness.
-
Geopolitical Considerations: International dynamics, cross-border transaction demand patterns, and regional regulatory developments may affect adoption rates and market sentiment for different crypto assets in varying degrees.
III. 2026-2031 Price Projection: ROCK vs OP
Short-term Outlook (2026)
- ROCK: Conservative scenario suggests a range between $0.0150 and $0.0197, with optimistic projections reaching up to $0.0216
- OP: Conservative scenario indicates a range between $0.214 and $0.252, with optimistic estimates extending to $0.376
Medium-term Outlook (2028-2029)
- ROCK may enter a gradual accumulation phase, with projected price range between $0.0207 and $0.0297 by 2029
- OP may enter a moderate growth phase, with projected price range between $0.264 and $0.493 by 2029
- Key drivers: institutional capital flows, ETF developments, ecosystem expansion
Long-term Outlook (2030-2031)
- ROCK: Baseline scenario suggests $0.0226 to $0.0313, with optimistic scenario reaching $0.0388 by 2031
- OP: Baseline scenario indicates $0.312 to $0.480, with optimistic scenario extending to $0.672 by 2031
View detailed price predictions for ROCK and OP
Disclaimer
ROCK:
| Year |
Predicted High Price |
Predicted Average Price |
Predicted Low Price |
Price Change |
| 2026 |
0.0216447 |
0.019677 |
0.01495452 |
0 |
| 2027 |
0.0254128455 |
0.02066085 |
0.0163220715 |
5 |
| 2028 |
0.02487979557 |
0.02303684775 |
0.020733162975 |
17 |
| 2029 |
0.0297083188584 |
0.02395832166 |
0.021562489494 |
21 |
| 2030 |
0.035688315944736 |
0.0268333202592 |
0.02549165424624 |
36 |
| 2031 |
0.03876341444644 |
0.031260818101968 |
0.022507789033416 |
58 |
OP:
| Year |
Predicted High Price |
Predicted Average Price |
Predicted Low Price |
Price Change |
| 2026 |
0.375778 |
0.2522 |
0.21437 |
0 |
| 2027 |
0.35480757 |
0.313989 |
0.25433109 |
24 |
| 2028 |
0.36449413065 |
0.334398285 |
0.26417464515 |
32 |
| 2029 |
0.49271915303325 |
0.349446207825 |
0.30401820080775 |
38 |
| 2030 |
0.53898583094928 |
0.421082680429125 |
0.311601183517552 |
66 |
| 2031 |
0.672047957964883 |
0.480034255689202 |
0.312022266197981 |
89 |
IV. Investment Strategy Comparison: ROCK vs OP
Long-term vs Short-term Investment Strategies
- ROCK: May be suitable for investors interested in emerging DeFi infrastructure solutions and yield-bearing Bitcoin applications, with a focus on protocol development and ecosystem expansion potential.
- OP: May be suitable for investors seeking exposure to Ethereum Layer 2 scaling infrastructure, with established market presence and higher liquidity characteristics.
Risk Management and Asset Allocation
- Conservative Investors: ROCK: 20-30% vs OP: 70-80%
- Aggressive Investors: ROCK: 40-50% vs OP: 50-60%
- Hedging Tools: Stablecoin allocation, options strategies, cross-asset portfolio diversification
V. Potential Risk Comparison
Market Risk
- ROCK: Characterized by lower liquidity with 24-hour trading volume of $15,548.71, which may result in higher price volatility and potential challenges in executing large orders. The asset has experienced substantial price fluctuations from its peak, reflecting sensitivity to broader market conditions.
- OP: While demonstrating higher liquidity with 24-hour trading volume of $1,526,405.77, the asset has shown significant price corrections during market downturns, declining from $4.84 to recent levels, indicating exposure to broader crypto market volatility.
Technical Risk
- ROCK: As an emerging protocol utilizing distributed Multi-Party Computation (dMPC) technology, considerations include protocol maturity, adoption rate development, and the scaling capacity of its DeFi integration infrastructure.
- OP: As a Layer 2 scaling solution, considerations include network congestion management, bridge security between Layer 1 and Layer 2, and potential technical challenges associated with maintaining transaction finality and cross-layer interoperability.
Regulatory Risk
- Global regulatory frameworks continue to evolve, with varying approaches across jurisdictions potentially impacting both assets differently. Layer 2 solutions and DeFi protocols may face distinct regulatory scrutiny depending on their specific use cases and operational characteristics. Investors should monitor regulatory developments in key markets that may influence adoption trajectories and compliance requirements.
VI. Conclusion: Which Is the Better Buy?
📌 Investment Value Summary:
- ROCK Characteristics: Represents exposure to emerging Bitcoin DeFi infrastructure with dMPC technology integration, offering positioning in yield-bearing wrapped Bitcoin solutions, though with lower current liquidity and established market presence.
- OP Characteristics: Represents exposure to established Ethereum Layer 2 infrastructure with significantly higher trading volume, broader ecosystem adoption, and more mature market positioning within the scaling solutions sector.
✅ Investment Considerations:
- Novice Investors: May consider prioritizing assets with higher liquidity and more established market presence to facilitate easier position management and reduced execution risk.
- Experienced Investors: May evaluate portfolio allocation based on risk tolerance, with consideration for diversification across different infrastructure categories and liquidity profiles.
- Institutional Investors: May assess each asset based on custody solution availability, regulatory clarity, liquidity depth for position sizing, and alignment with broader portfolio infrastructure exposure objectives.
⚠️ Risk Disclosure: The cryptocurrency market exhibits significant volatility. This content does not constitute investment advice. Investors should conduct independent research and consult with qualified financial advisors before making investment decisions.
VII. FAQ
Q1: What is the primary difference between ROCK and OP in terms of use case?
ROCK is a yield-bearing wrapped Bitcoin solution utilizing distributed Multi-Party Computation (dMPC) technology for DeFi integration, while OP is an Ethereum Layer 2 scaling solution designed to improve transaction throughput and reduce costs. ROCK focuses on bringing Bitcoin liquidity into decentralized finance applications through innovative custody and yield mechanisms, whereas OP addresses Ethereum's scalability challenges by processing transactions off the main chain while maintaining security guarantees. These fundamental differences mean ROCK serves the Bitcoin DeFi infrastructure sector, while OP operates within the Ethereum scaling ecosystem, representing distinct positioning in the blockchain infrastructure landscape.
Q2: Which asset demonstrates higher liquidity for trading purposes?
OP exhibits significantly higher liquidity compared to ROCK, with 24-hour trading volume of $1,526,405.77 versus ROCK's $15,548.71 as of January 31, 2026. This substantial liquidity difference of approximately 98x means OP offers better price discovery, tighter bid-ask spreads, and reduced slippage for larger order executions. For investors requiring the ability to enter or exit positions efficiently, particularly institutional participants or those managing sizable allocations, OP's higher liquidity profile provides material advantages in trade execution quality and reduced market impact costs.
Q3: How have ROCK and OP performed since their respective launches?
ROCK launched in November 2024 and reached its all-time high of $0.176 on November 29, 2024, subsequently declining to $0.00668 by December 2025, representing a substantial correction from peak levels. OP, introduced in 2022, achieved its all-time high of $4.84 on March 6, 2024, later declining to $0.251922 in late December 2025. Both assets experienced significant drawdowns from their respective peaks, reflecting broader cryptocurrency market volatility. The percentage decline patterns demonstrate that emerging protocols like ROCK and more established infrastructure like OP both face considerable price fluctuation during market correction phases.
Q4: What are the projected price ranges for ROCK and OP through 2031?
For ROCK, conservative short-term 2026 projections suggest a range between $0.0150 and $0.0197, with long-term 2031 baseline scenarios indicating $0.0226 to $0.0313, and optimistic scenarios reaching $0.0388. For OP, conservative 2026 projections indicate a range between $0.214 and $0.252, with long-term 2031 baseline scenarios suggesting $0.312 to $0.480, and optimistic scenarios extending to $0.672. These projections reflect different growth trajectories influenced by factors including institutional adoption, ecosystem development, ETF developments, and broader market cycle dynamics. Actual outcomes may vary substantially based on technological advancement, regulatory developments, and macroeconomic conditions.
Q5: What allocation strategy is appropriate for different investor profiles?
Conservative investors may consider allocating 20-30% to ROCK and 70-80% to OP, emphasizing the more established infrastructure with higher liquidity. Aggressive investors might pursue 40-50% ROCK allocation versus 50-60% OP, accepting higher volatility for potential exposure to emerging Bitcoin DeFi infrastructure growth. These allocation frameworks assume diversified crypto portfolios and should be adjusted based on individual risk tolerance, investment timeframe, and overall portfolio construction. Institutional investors should additionally evaluate custody solution availability, regulatory compliance considerations, and liquidity requirements for position sizing before determining appropriate allocation percentages.
Q6: What are the primary risks associated with investing in ROCK versus OP?
ROCK faces lower liquidity risk given its $15,548.71 daily trading volume, which may result in higher price volatility and execution challenges, plus protocol maturity considerations as an emerging dMPC-based solution launched in 2024. OP confronts risks including network congestion management, Layer 1/Layer 2 bridge security, and cross-layer interoperability challenges despite its higher liquidity profile. Both assets face regulatory uncertainty as global frameworks continue evolving, with potential distinct treatment for Layer 2 solutions versus DeFi protocols. Additionally, both demonstrate sensitivity to broader cryptocurrency market corrections, as evidenced by substantial declines from peak valuations during recent market downturns.
Q7: How do technological architectures differ between ROCK and OP?
ROCK employs distributed Multi-Party Computation (dMPC) technology to create a yield-bearing wrapped Bitcoin solution, enabling Bitcoin to participate in DeFi protocols while maintaining security through distributed key management mechanisms. OP utilizes optimistic rollup technology as a Layer 2 scaling solution, processing transactions off Ethereum's main chain while periodically submitting transaction batches and fraud proofs to the base layer for security guarantees. ROCK's architecture focuses on cross-chain Bitcoin integration and custody innovation, while OP's architecture emphasizes transaction throughput optimization and cost reduction for Ethereum-based applications. These architectural differences reflect their distinct infrastructure objectives within the blockchain ecosystem.
Q8: What factors should novice investors prioritize when choosing between ROCK and OP?
Novice investors should prioritize liquidity considerations, with OP's 24-hour volume of $1,526,405.77 providing significantly easier position management compared to ROCK's $15,548.71. Market maturity represents another key factor, as OP launched in 2022 with established ecosystem presence versus ROCK's November 2024 launch. Price volatility tolerance is essential, given ROCK's lower liquidity may result in sharper price movements during market fluctuations. Understanding the underlying technology and use case—Bitcoin DeFi infrastructure versus Ethereum Layer 2 scaling—helps align investment choices with portfolio objectives. Additionally, novice investors should consider starting with smaller allocations and utilizing risk management tools including stablecoin reserves before increasing exposure to either asset.
* The information is not intended to be and does not constitute financial advice or any other recommendation of any sort offered or endorsed by Gate.