This article delves into the investment comparison between SDM and LINK in the cryptocurrency market, focusing on historical price trends, supply mechanisms, institutional adoption, and technological ecosystems. It aims to address investor concerns regarding which token offers better value, presenting analysis suitable for both new and experienced investors seeking insights into their investment strategies. The structure is designed to provide a clear, concise evaluation of price history, core factors affecting investment, risk assessments, and potential future scenarios. Relevant topics include tokenomics, technical risks, and regulatory impacts, accessible via real-time price links on Gate.
Introduction: SDM vs LINK Investment Comparison
In the cryptocurrency market, the comparison between SDM and LINK has always been a topic that investors cannot ignore. The two not only show significant differences in market cap ranking, application scenarios, and price performance, but also represent different positioning in crypto assets.
Shieldeum (SDM): Since its launch, it has gained market recognition for providing secure computing power through AI-driven Decentralized Physical Infrastructure Network (DePIN).
ChainLink (LINK): Since its inception in 2017, it has been hailed as a decentralized oracle network, and is one of the cryptocurrencies with the highest global trading volume and market capitalization.
This article will comprehensively analyze the investment value comparison between SDM and LINK, focusing on historical price trends, supply mechanisms, institutional adoption, technological ecosystems, and future predictions, attempting to answer the question most concerning investors:
"Which is the better buy right now?"
I. Price History Comparison and Current Market Status
SDM and LINK Historical Price Trends
- 2024: SDM reached its all-time high of $0.261739 on December 9, 2024.
- 2021: LINK reached its all-time high of $52.7 on May 10, 2021.
- Comparative Analysis: Since their respective peaks, SDM has fallen to $0.00124, while LINK has declined to $13.104.
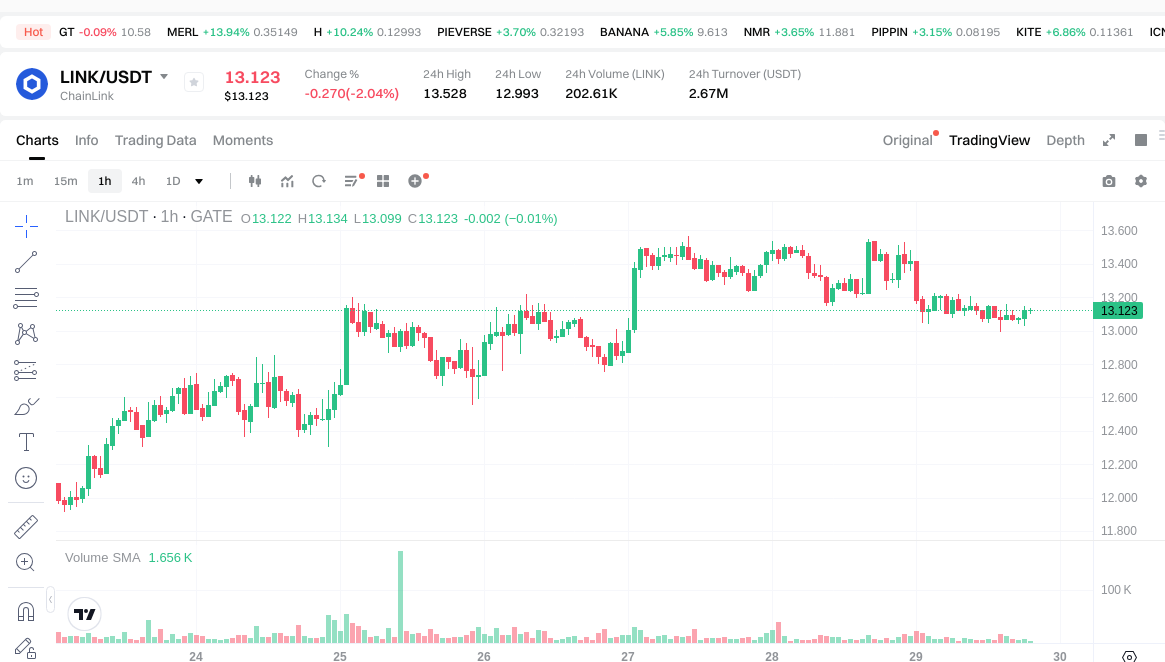
Current Market Situation (2025-11-29)
- SDM current price: $0.00124
- LINK current price: $13.104
- 24-hour trading volume: SDM $19,886.85 vs LINK $2,672,668.22
- Market Sentiment Index (Fear & Greed Index): 28 (Fear)
Click to view real-time prices:
- View SDM current price Market Price
- View LINK current price Market Price

II. Core Factors Affecting SDM vs LINK Investment Value
Supply Mechanism Comparison (Tokenomics)
- SDM: Fixed supply of 1 billion tokens; 33% was allocated to Space and Time team, 32% to investors through token sales, and 35% for ecosystem growth and incentives
- LINK: Maximum supply of 1 billion tokens; 35% was allocated to node operators and ecosystem participants, 30% to the company for development, and 35% sold in the ICO
Institutional Adoption and Market Applications
- Institutional Holdings: Chainlink has established partnerships with tech giants like Google, Oracle, and AWS, along with numerous traditional financial institutions, giving LINK stronger institutional backing compared to SDM
- Enterprise Adoption: Chainlink has seen widespread enterprise adoption with over 1,000 integrations across major blockchain platforms, while Space and Time is still building its enterprise connections
Technical Development and Ecosystem Building
- SDM Technical Development: Space and Time is developing a decentralized data warehouse with innovative Proof of SQL technology for tamper-proof computation
- LINK Technical Development: Chainlink focuses on cross-chain interoperability and has implemented CCIP (Cross-Chain Interoperability Protocol) to facilitate secure messaging and token movements across blockchains
- Ecosystem Comparison: Chainlink has an established ecosystem across DeFi, gaming, insurance, and enterprise applications, while Space and Time is building its ecosystem with a focus on data warehousing solutions
Macroeconomic Factors and Market Cycles
- Performance in Inflationary Environments: Both tokens face similar market pressures during inflationary periods as they are primarily utility tokens rather than explicit inflation hedges
- Impact of Monetary Policies: Interest rate changes and dollar strength affect both tokens similarly as part of broader crypto market sentiment
III. 2025-2030 Price Prediction: SDM vs LINK
Short-term Prediction (2025)
- SDM: Conservative $0.00081906 - $0.001241 | Optimistic $0.001241 - $0.00155125
- LINK: Conservative $10.6272 - $13.12 | Optimistic $13.12 - $17.3184
Mid-term Prediction (2027)
- SDM may enter a growth phase, with an estimated price range of $0.0010688733 - $0.00195960105
- LINK may enter a bullish market, with an estimated price range of $9.79431616 - $21.35482048
- Key drivers: Institutional capital inflow, ETF, ecosystem development
Long-term Prediction (2030)
- SDM: Base scenario $0.001607213230341 - $0.002087289909534 | Optimistic scenario $0.002087289909534 - $0.00273434978149
- LINK: Base scenario $15.34542499487232 - $21.313090270656 | Optimistic scenario $21.313090270656 - $22.80500658960192
View detailed price predictions for SDM and LINK
Disclaimer: The above predictions are based on historical data and market analysis. Cryptocurrency markets are highly volatile and subject to change. This information should not be considered as financial advice. Always conduct your own research before making investment decisions.
SDM:
| 年份 |
预测最高价 |
预测平均价格 |
预测最低价 |
涨跌幅 |
| 2025 |
0.00155125 |
0.001241 |
0.00081906 |
0 |
| 2026 |
0.001842885 |
0.001396125 |
0.0012006675 |
12 |
| 2027 |
0.00195960105 |
0.001619505 |
0.0010688733 |
30 |
| 2028 |
0.00209377703925 |
0.001789553025 |
0.00166428431325 |
44 |
| 2029 |
0.002232914786943 |
0.001941665032125 |
0.001048499117347 |
56 |
| 2030 |
0.00273434978149 |
0.002087289909534 |
0.001607213230341 |
68 |
LINK:
| 年份 |
预测最高价 |
预测平均价格 |
预测最低价 |
涨跌幅 |
| 2025 |
17.3184 |
13.12 |
10.6272 |
0 |
| 2026 |
16.893312 |
15.2192 |
7.761792 |
16 |
| 2027 |
21.35482048 |
16.056256 |
9.79431616 |
22 |
| 2028 |
20.7631474464 |
18.70553824 |
10.288046032 |
42 |
| 2029 |
22.891837698112 |
19.7343428432 |
10.656545135328 |
50 |
| 2030 |
22.80500658960192 |
21.313090270656 |
15.34542499487232 |
62 |
IV. Investment Strategy Comparison: SDM vs LINK
Long-term vs Short-term Investment Strategies
- SDM: Suitable for investors focused on emerging DePIN technologies and AI-driven infrastructure
- LINK: Suitable for investors seeking established oracle networks and cross-chain interoperability solutions
Risk Management and Asset Allocation
- Conservative investors: SDM: 10% vs LINK: 90%
- Aggressive investors: SDM: 30% vs LINK: 70%
- Hedging tools: Stablecoin allocation, options, cross-currency portfolios
V. Potential Risk Comparison
Market Risks
- SDM: Higher volatility due to lower market cap and trading volume
- LINK: Susceptible to broader crypto market trends and DeFi sector fluctuations
Technical Risks
- SDM: Scalability, network stability, and adoption of Proof of SQL technology
- LINK: Oracle network reliability, smart contract vulnerabilities
Regulatory Risks
- Global regulatory policies may impact both tokens differently, with LINK potentially facing more scrutiny due to its wider adoption and use in DeFi
VI. Conclusion: Which Is the Better Buy?
📌 Investment Value Summary:
- SDM advantages: Innovative AI-driven DePIN technology, potential for high growth in emerging market
- LINK advantages: Established market position, wide adoption, strong institutional partnerships
✅ Investment Advice:
- New investors: Consider a smaller allocation to LINK as part of a diversified crypto portfolio
- Experienced investors: Balanced approach with both LINK and SDM, adjusting based on risk tolerance
- Institutional investors: Focus on LINK for its established track record and enterprise adoption
⚠️ Risk Warning: Cryptocurrency markets are highly volatile. This article does not constitute investment advice.
None
VII. FAQ
Q1: What are the main differences between SDM and LINK?
A: SDM focuses on AI-driven Decentralized Physical Infrastructure Network (DePIN), while LINK is a decentralized oracle network. SDM is newer with a smaller market cap, while LINK is more established with wider adoption and institutional partnerships.
Q2: Which token has performed better historically?
A: LINK has historically performed better, reaching an all-time high of $52.7 in May 2021. SDM's all-time high was $0.261739 in December 2024. However, both have seen significant declines from their peaks.
Q3: How do the supply mechanisms of SDM and LINK compare?
A: Both have a maximum supply of 1 billion tokens. SDM allocated 33% to the team, 32% to investors, and 35% for ecosystem growth. LINK allocated 35% to node operators and participants, 30% to the company, and 35% for ICO.
Q4: Which token has stronger institutional adoption?
A: LINK has stronger institutional adoption, with partnerships including Google, Oracle, and AWS, as well as numerous integrations across major blockchain platforms. SDM is still building its enterprise connections.
Q5: What are the price predictions for SDM and LINK by 2030?
A: For SDM, the base scenario predicts $0.001607213230341 - $0.002087289909534, with an optimistic scenario of up to $0.00273434978149. For LINK, the base scenario predicts $15.34542499487232 - $21.313090270656, with an optimistic scenario of up to $22.80500658960192.
Q6: What are the main risks associated with investing in SDM and LINK?
A: SDM faces higher volatility due to its lower market cap and trading volume, as well as potential technical risks related to its new technology. LINK is susceptible to broader crypto market trends and DeFi sector fluctuations, as well as potential regulatory scrutiny due to its wider adoption.
Q7: How should investors approach allocating between SDM and LINK?
A: Conservative investors might consider allocating 10% to SDM and 90% to LINK, while more aggressive investors might opt for 30% SDM and 70% LINK. The exact allocation should be based on individual risk tolerance and investment goals.
* The information is not intended to be and does not constitute financial advice or any other recommendation of any sort offered or endorsed by Gate.


