This article provides a comprehensive comparison of two prominent blockchain protocols, Sentre (SNTR) and Quant (QNT), for enterprise solutions. It delves into price history, market status, tokenomics, institutional adoption, and technical ecosystem development. Readers will gain insights into investment strategies, potential risks, and price predictions for 2025-2030, allowing them to make informed decisions. The piece caters to both novice and experienced investors, with a strong emphasis on QNT's market stability and SNTR's growth potential within the Solana ecosystem. Check real-time prices on Gate and explore strategic investment advice tailored to diverse risk profiles.
Introduction: SNTR vs QNT Investment Comparison
In the cryptocurrency market, the comparison between Sentre (SNTR) vs Quant (QNT) has always been a topic that investors can't avoid. The two not only have significant differences in market cap ranking, application scenarios, and price performance, but also represent different crypto asset positioning.
Sentre (SNTR): Since its launch, it has gained market recognition for its open liquidity protocol built on Solana.
Quant (QNT): Since 2018, it has been hailed as a technology provider enabling trusted digital interaction, and is one of the cryptocurrencies with the highest global trading volume and market capitalization.
This article will provide a comprehensive analysis of the investment value comparison between SNTR and QNT, focusing on historical price trends, supply mechanisms, institutional adoption, technological ecosystems, and future predictions, and attempt to answer the question that investors are most concerned about:
"Which is the better buy right now?"
I. Price History Comparison and Current Market Status
SNTR and QNT Historical Price Trends
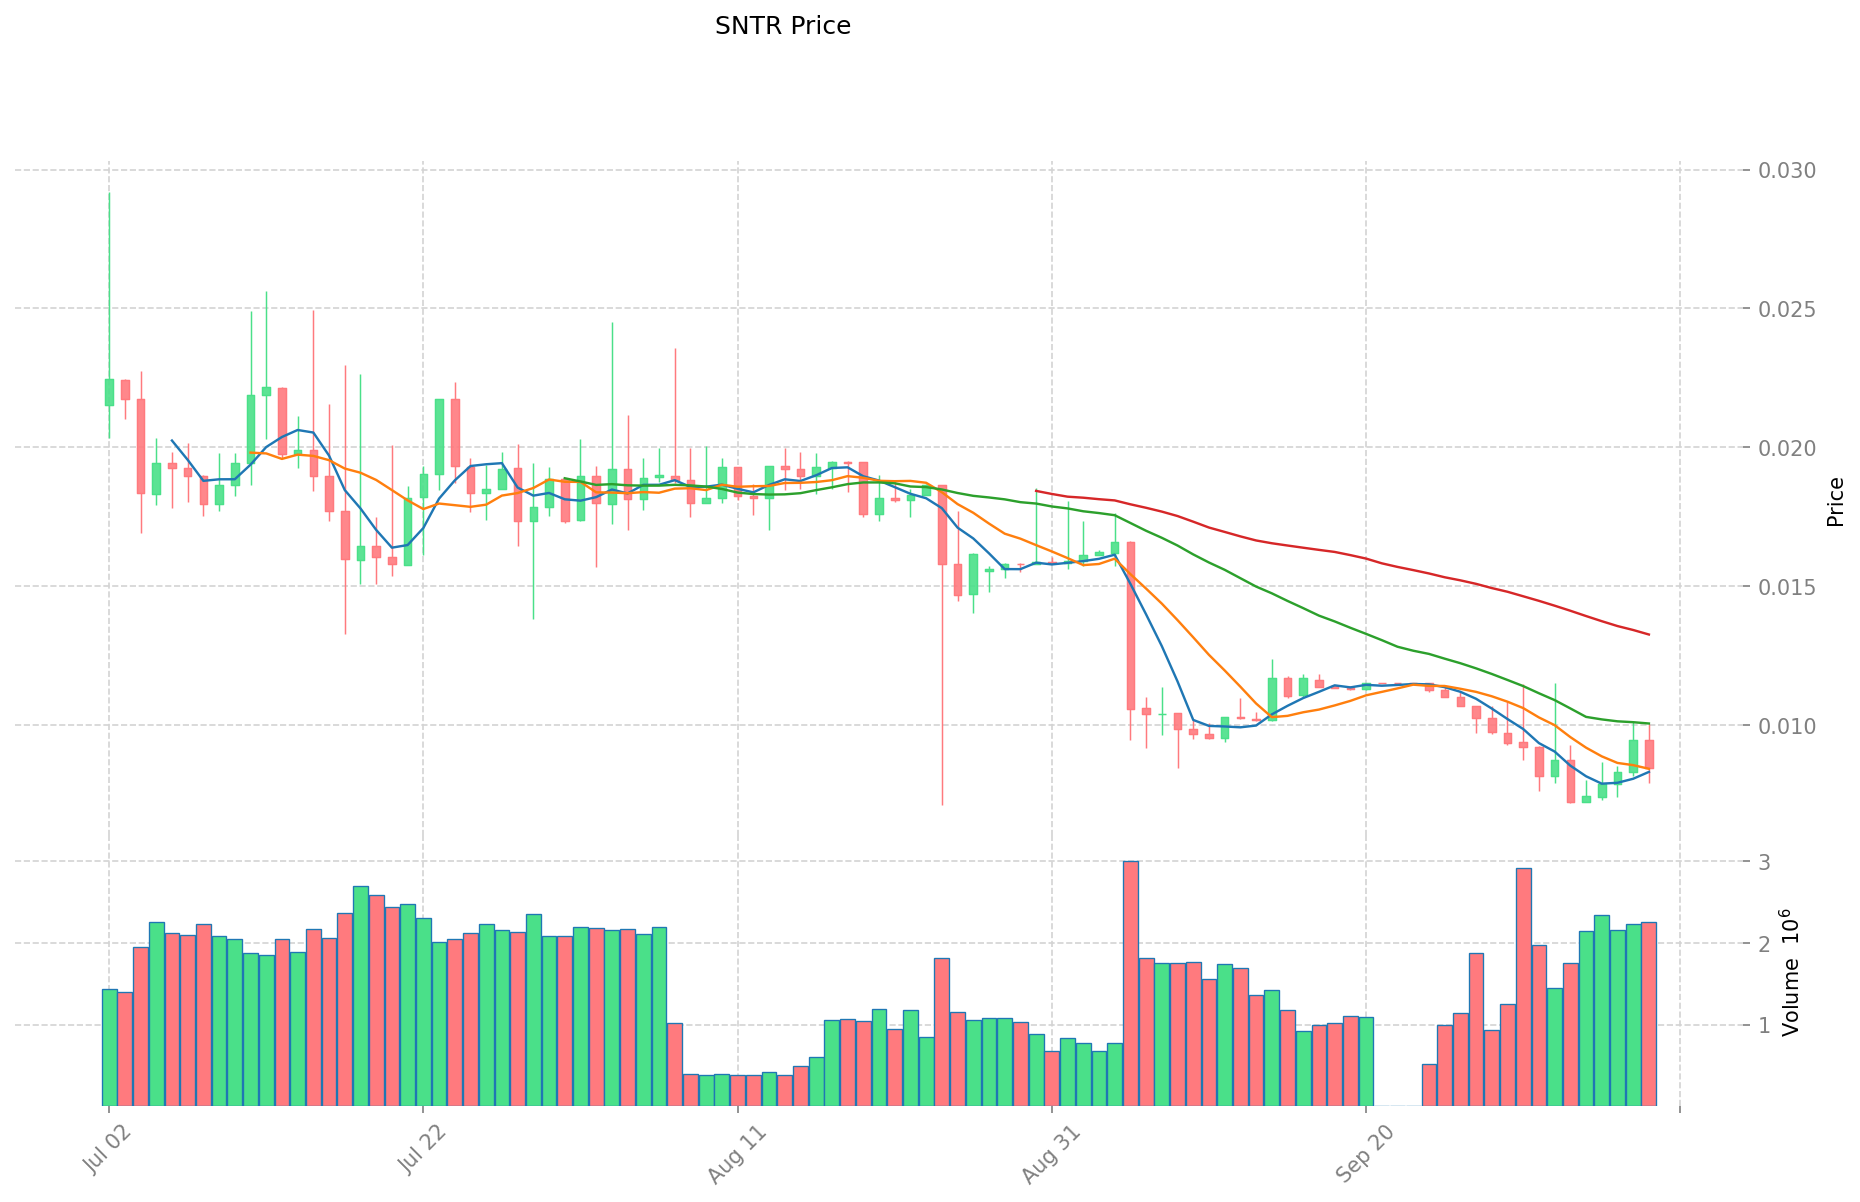
- 2024: SNTR reached an all-time high of $0.053225, followed by a significant decline.
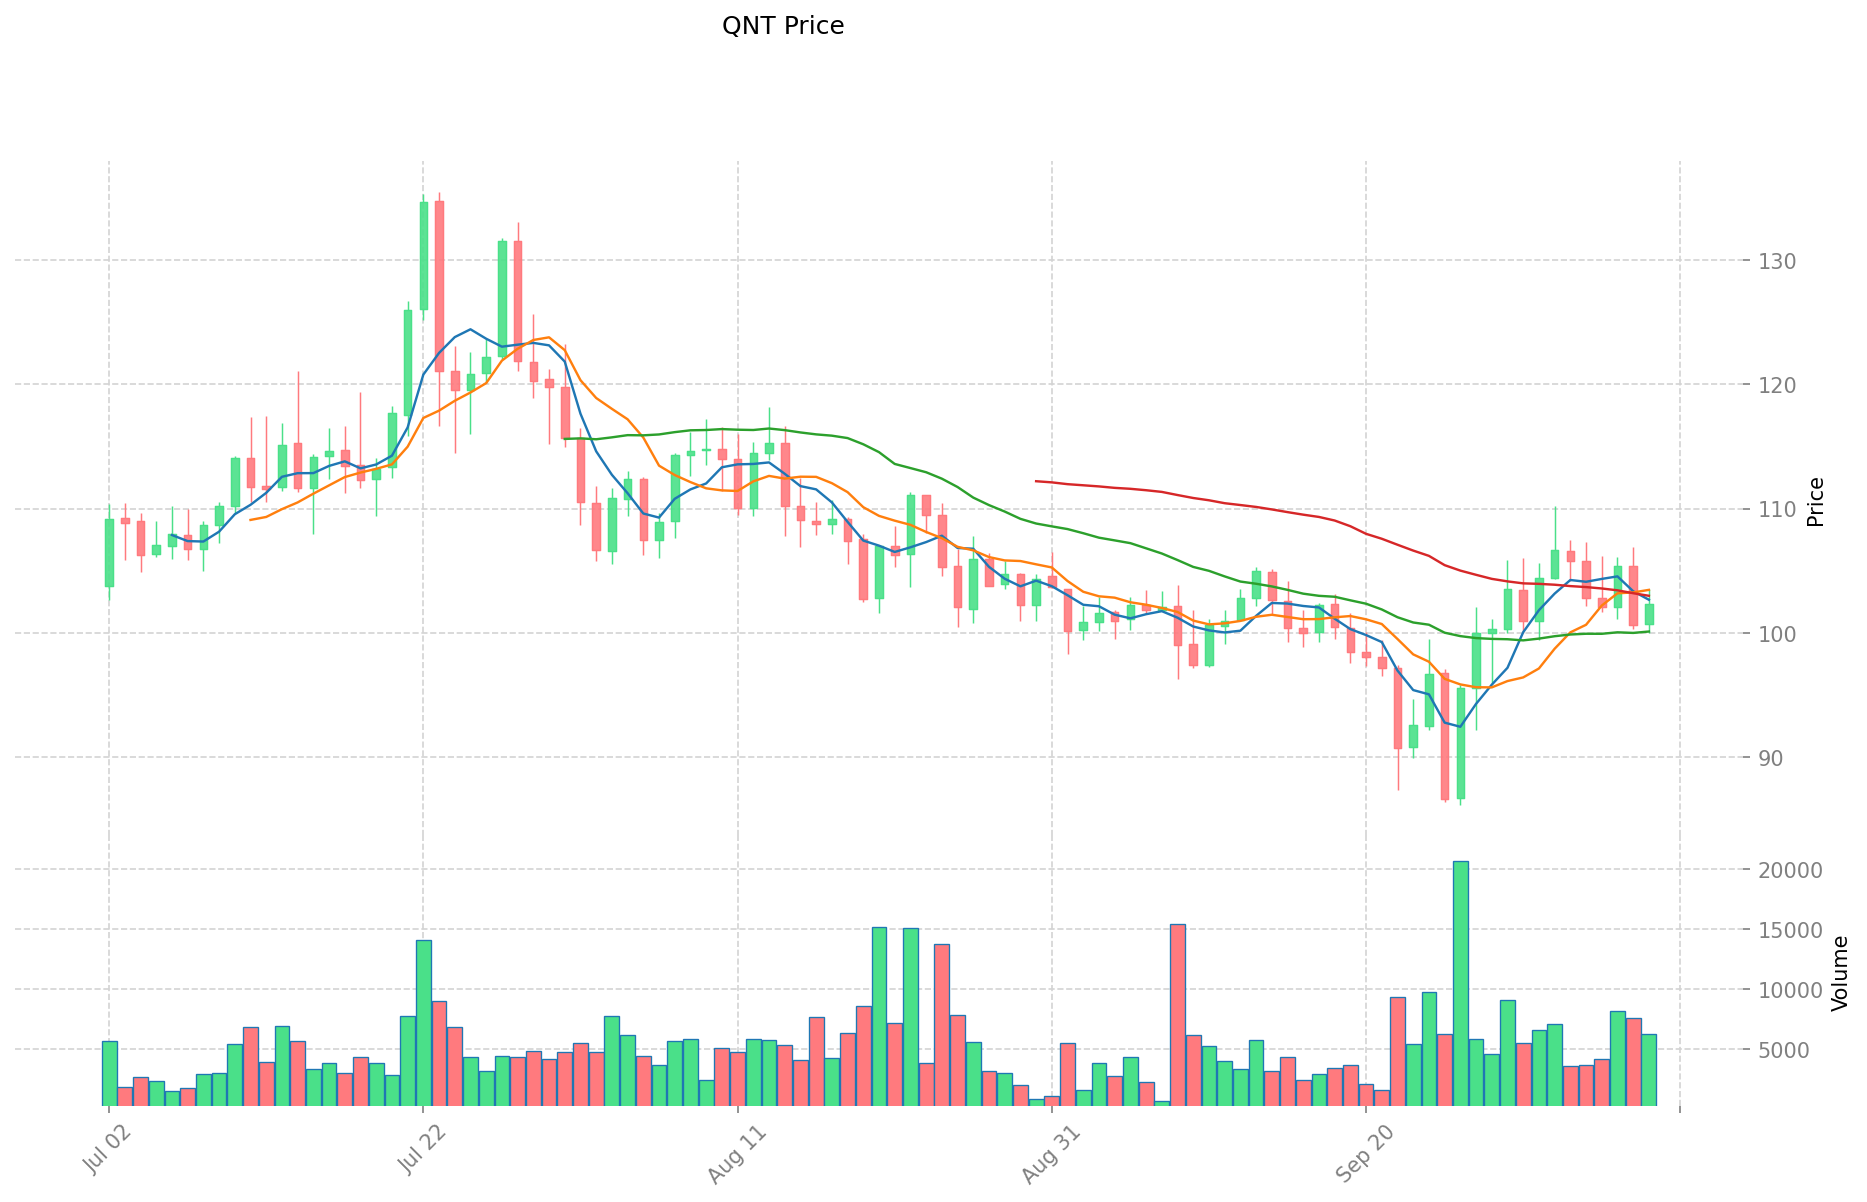
- 2021: QNT hit its all-time high of $427.42 in September, driven by increased adoption of its interoperability solutions.
- Comparative analysis: In the recent market cycle, SNTR dropped from its peak of $0.053225 to a low of $0.00016729, while QNT demonstrated more resilience, maintaining a higher price range.
Current Market Situation (2025-10-09)
- SNTR current price: $0.008439
- QNT current price: $102.12
- 24-hour trading volume: SNTR $20,230.91 vs QNT $631,030.91
- Market Sentiment Index (Fear & Greed Index): 70 (Greed)
Click to view real-time prices:
- Check SNTR current price Market Price
- Check QNT current price Market Price
II. Core Factors Affecting Investment Value of SNTR vs QNT
Supply Mechanism Comparison (Tokenomics)
Institutional Adoption and Market Applications
Technical Development and Ecosystem Building
Macroeconomic Factors and Market Cycles
III. 2025-2030 Price Prediction: SNTR vs QNT
Short-term Prediction (2025)
- SNTR: Conservative $0.00810432 - $0.008442 | Optimistic $0.008442 - $0.0097083
- QNT: Conservative $95.0274 - $102.18 | Optimistic $102.18 - $152.2482
Mid-term Prediction (2027)
- SNTR may enter a growth phase, with an estimated price range of $0.00666479016 - $0.01293753384
- QNT may enter a bullish market, with an estimated price range of $115.10331768 - $168.02438328
- Key drivers: Institutional capital inflow, ETF, ecosystem development
Long-term Prediction (2030)
- SNTR: Base scenario $0.013136192906496 - $0.014435376820326 | Optimistic scenario $0.014435376820326 - $0.015734560734155
- QNT: Base scenario $159.84103716626526 - $204.924406623417 | Optimistic scenario $204.924406623417 - $233.61382355069538
View detailed price predictions for SNTR and QNT
Disclaimer: The above predictions are based on historical data and market analysis. Cryptocurrency markets are highly volatile and subject to rapid changes. These forecasts should not be considered as financial advice. Always conduct your own research before making investment decisions.
SNTR:
| 年份 |
预测最高价 |
预测平均价格 |
预测最低价 |
涨跌幅 |
| 2025 |
0.0097083 |
0.008442 |
0.00810432 |
0 |
| 2026 |
0.010527174 |
0.00907515 |
0.0075323745 |
7 |
| 2027 |
0.01293753384 |
0.009801162 |
0.00666479016 |
16 |
| 2028 |
0.0162581675256 |
0.01136934792 |
0.0089817848568 |
34 |
| 2029 |
0.015056995917852 |
0.0138137577228 |
0.011879831641608 |
63 |
| 2030 |
0.015734560734155 |
0.014435376820326 |
0.013136192906496 |
71 |
QNT:
| 年份 |
预测最高价 |
预测平均价格 |
预测最低价 |
涨跌幅 |
| 2025 |
152.2482 |
102.18 |
95.0274 |
0 |
| 2026 |
137.391228 |
127.2141 |
86.505588 |
24 |
| 2027 |
168.02438328 |
132.302664 |
115.10331768 |
29 |
| 2028 |
220.7403797508 |
150.16352364 |
85.5932084748 |
46 |
| 2029 |
224.396861551434 |
185.4519516954 |
172.470315076722 |
81 |
| 2030 |
233.61382355069538 |
204.924406623417 |
159.84103716626526 |
100 |
IV. Investment Strategy Comparison: SNTR vs QNT
Long-term vs Short-term Investment Strategies
- SNTR: Suitable for investors focused on Solana ecosystem potential
- QNT: Suitable for investors seeking established interoperability solutions
Risk Management and Asset Allocation
- Conservative investors: SNTR: 20% vs QNT: 80%
- Aggressive investors: SNTR: 40% vs QNT: 60%
- Hedging tools: Stablecoin allocation, options, cross-currency portfolios
V. Potential Risk Comparison
Market Risk
- SNTR: Higher volatility due to lower market cap and trading volume
- QNT: Relatively more stable but still subject to overall crypto market trends
Technical Risk
- SNTR: Scalability, network stability on Solana
- QNT: Centralization concerns, potential security vulnerabilities
Regulatory Risk
- Global regulatory policies may have differing impacts on both tokens
VI. Conclusion: Which Is the Better Buy?
📌 Investment Value Summary:
- SNTR advantages: Potential for growth within Solana ecosystem
- QNT advantages: Established market position, higher trading volume
✅ Investment Advice:
- Novice investors: Consider QNT for its more established market presence
- Experienced investors: Balanced portfolio with both SNTR and QNT
- Institutional investors: Focus on QNT for its higher liquidity and market cap
⚠️ Risk Warning: Cryptocurrency markets are highly volatile. This article does not constitute investment advice.
None
VII. FAQ
Q1: What are the main differences between SNTR and QNT?
A: SNTR is an open liquidity protocol built on Solana, while QNT is a technology provider enabling trusted digital interaction. QNT has a higher market cap, trading volume, and price compared to SNTR.
Q2: Which token has shown better price performance historically?
A: QNT has demonstrated more resilience in price performance. While SNTR dropped significantly from its all-time high, QNT has maintained a higher price range.
Q3: How do the current prices of SNTR and QNT compare?
A: As of 2025-10-09, SNTR's price is $0.008439, while QNT's price is $102.12.
Q4: What are the short-term price predictions for SNTR and QNT?
A: For 2025, SNTR is predicted to range from $0.00810432 to $0.0097083, while QNT is expected to range from $95.0274 to $152.2482.
Q5: How do the long-term predictions for SNTR and QNT differ?
A: By 2030, SNTR is predicted to reach $0.013136192906496 - $0.015734560734155, while QNT is expected to reach $159.84103716626526 - $233.61382355069538.
Q6: Which token is considered more suitable for novice investors?
A: QNT is generally considered more suitable for novice investors due to its more established market presence and higher trading volume.
Q7: How should investors approach risk management when investing in SNTR and QNT?
A: Conservative investors might allocate 20% to SNTR and 80% to QNT, while aggressive investors might opt for 40% SNTR and 60% QNT. Using stablecoins, options, and cross-currency portfolios can help with risk management.
Q8: What are the potential risks associated with investing in SNTR and QNT?
A: Both tokens face market risks, with SNTR potentially having higher volatility. Technical risks include scalability issues for SNTR and centralization concerns for QNT. Both are subject to regulatory risks depending on global policies.
* The information is not intended to be and does not constitute financial advice or any other recommendation of any sort offered or endorsed by Gate.


