TOK vs LINK: A Battle of Blockchain Oracles Shaping the Future of DeFi
Introduction: TOK vs LINK Investment Comparison
In the cryptocurrency market, the comparison between TOKAI vs ChainLink has always been an unavoidable topic for investors. The two not only have significant differences in market cap ranking, application scenarios, and price performance, but also represent different positioning of crypto assets.
TOKAI (TOK): Since its launch in 2024, it has gained market recognition for its AI short video application platform built on the Solana ecosystem.
ChainLink (LINK): Since its introduction in 2017, it has been hailed as a decentralized oracle network, and is one of the cryptocurrencies with the highest global trading volume and market capitalization.
This article will comprehensively analyze the investment value comparison between TOKAI vs ChainLink, focusing on historical price trends, supply mechanisms, institutional adoption, technological ecosystems, and future predictions, and attempt to answer the question that investors care about most:
"Which is the better buy right now?"
I. Price History Comparison and Current Market Status
TOKAI (TOK) and ChainLink (LINK) Historical Price Trends
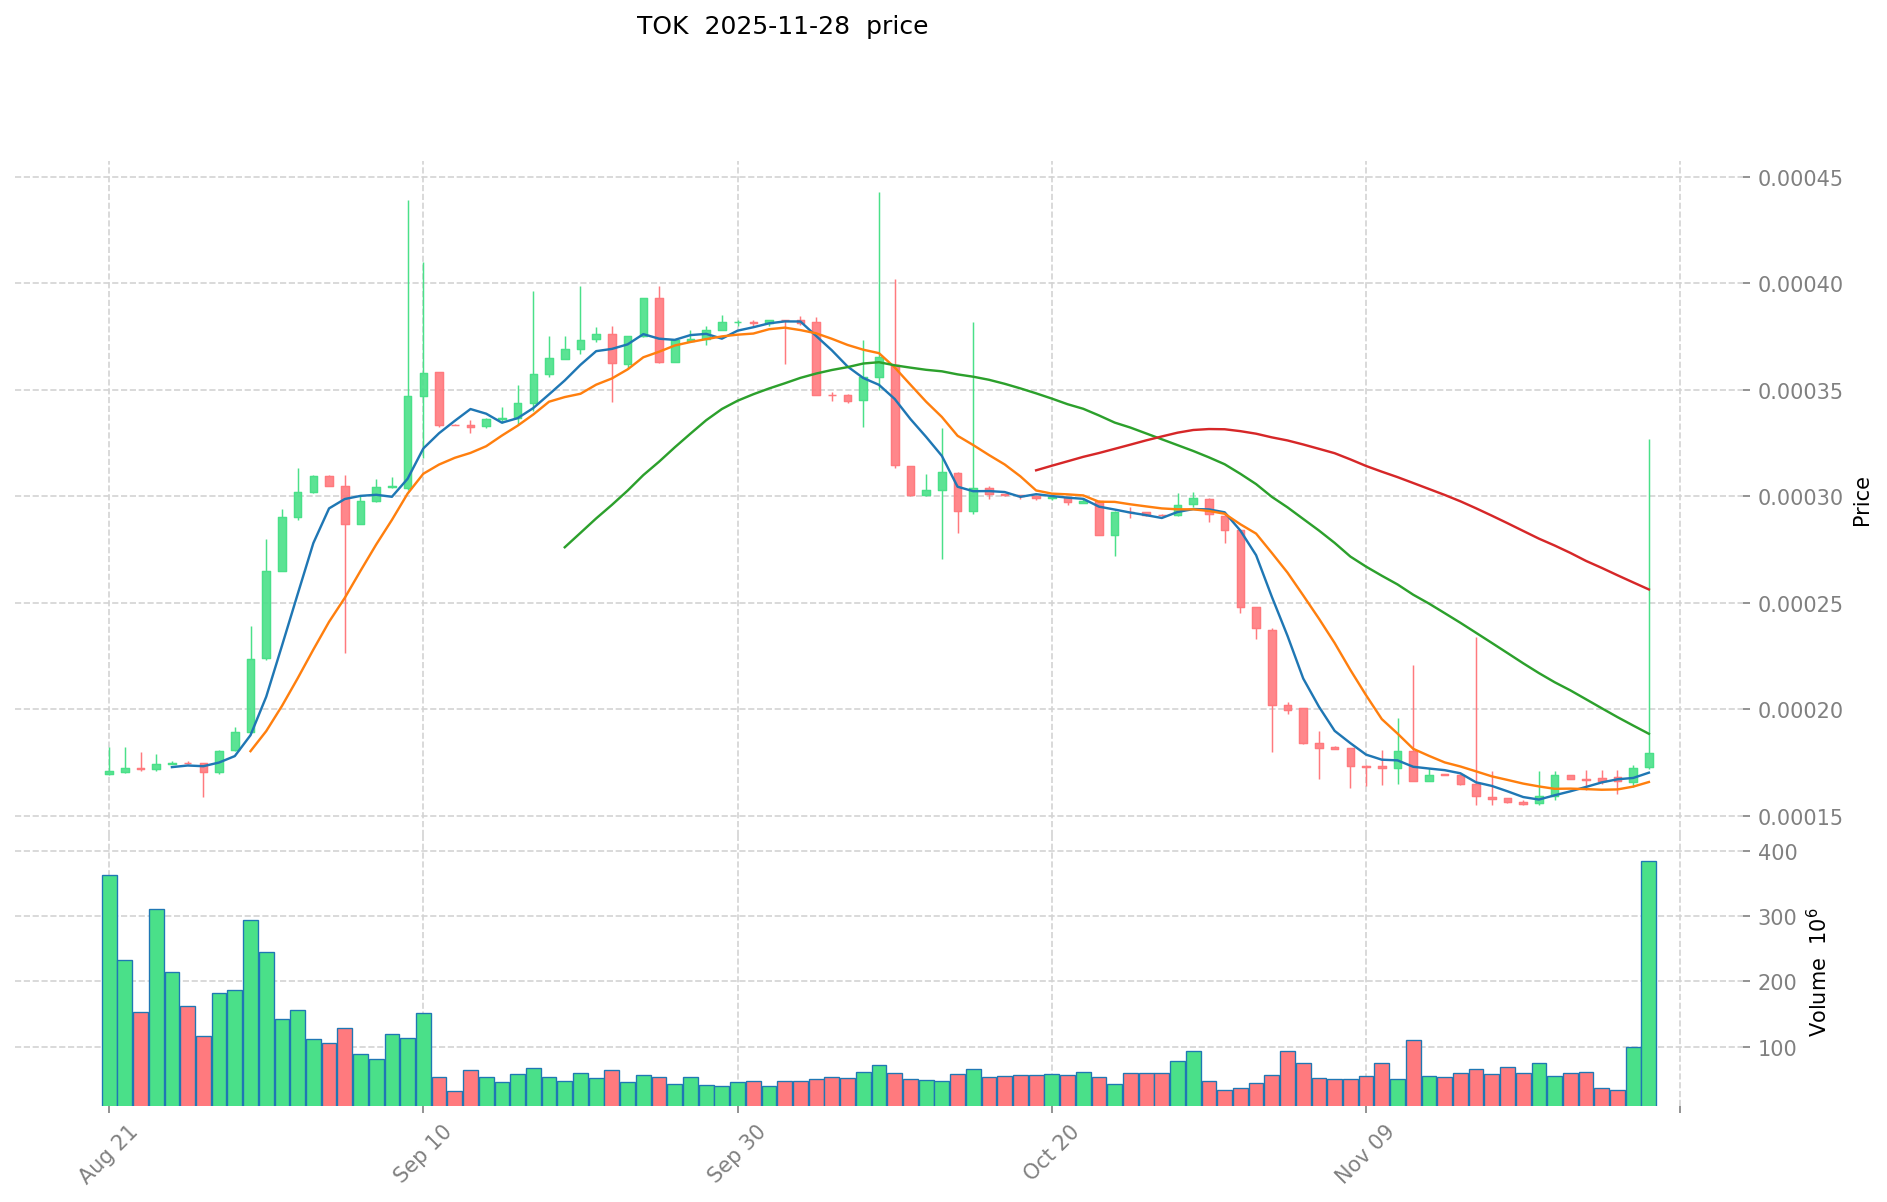
- 2024: TOK reached its all-time high of $0.0135 on August 23, 2024.
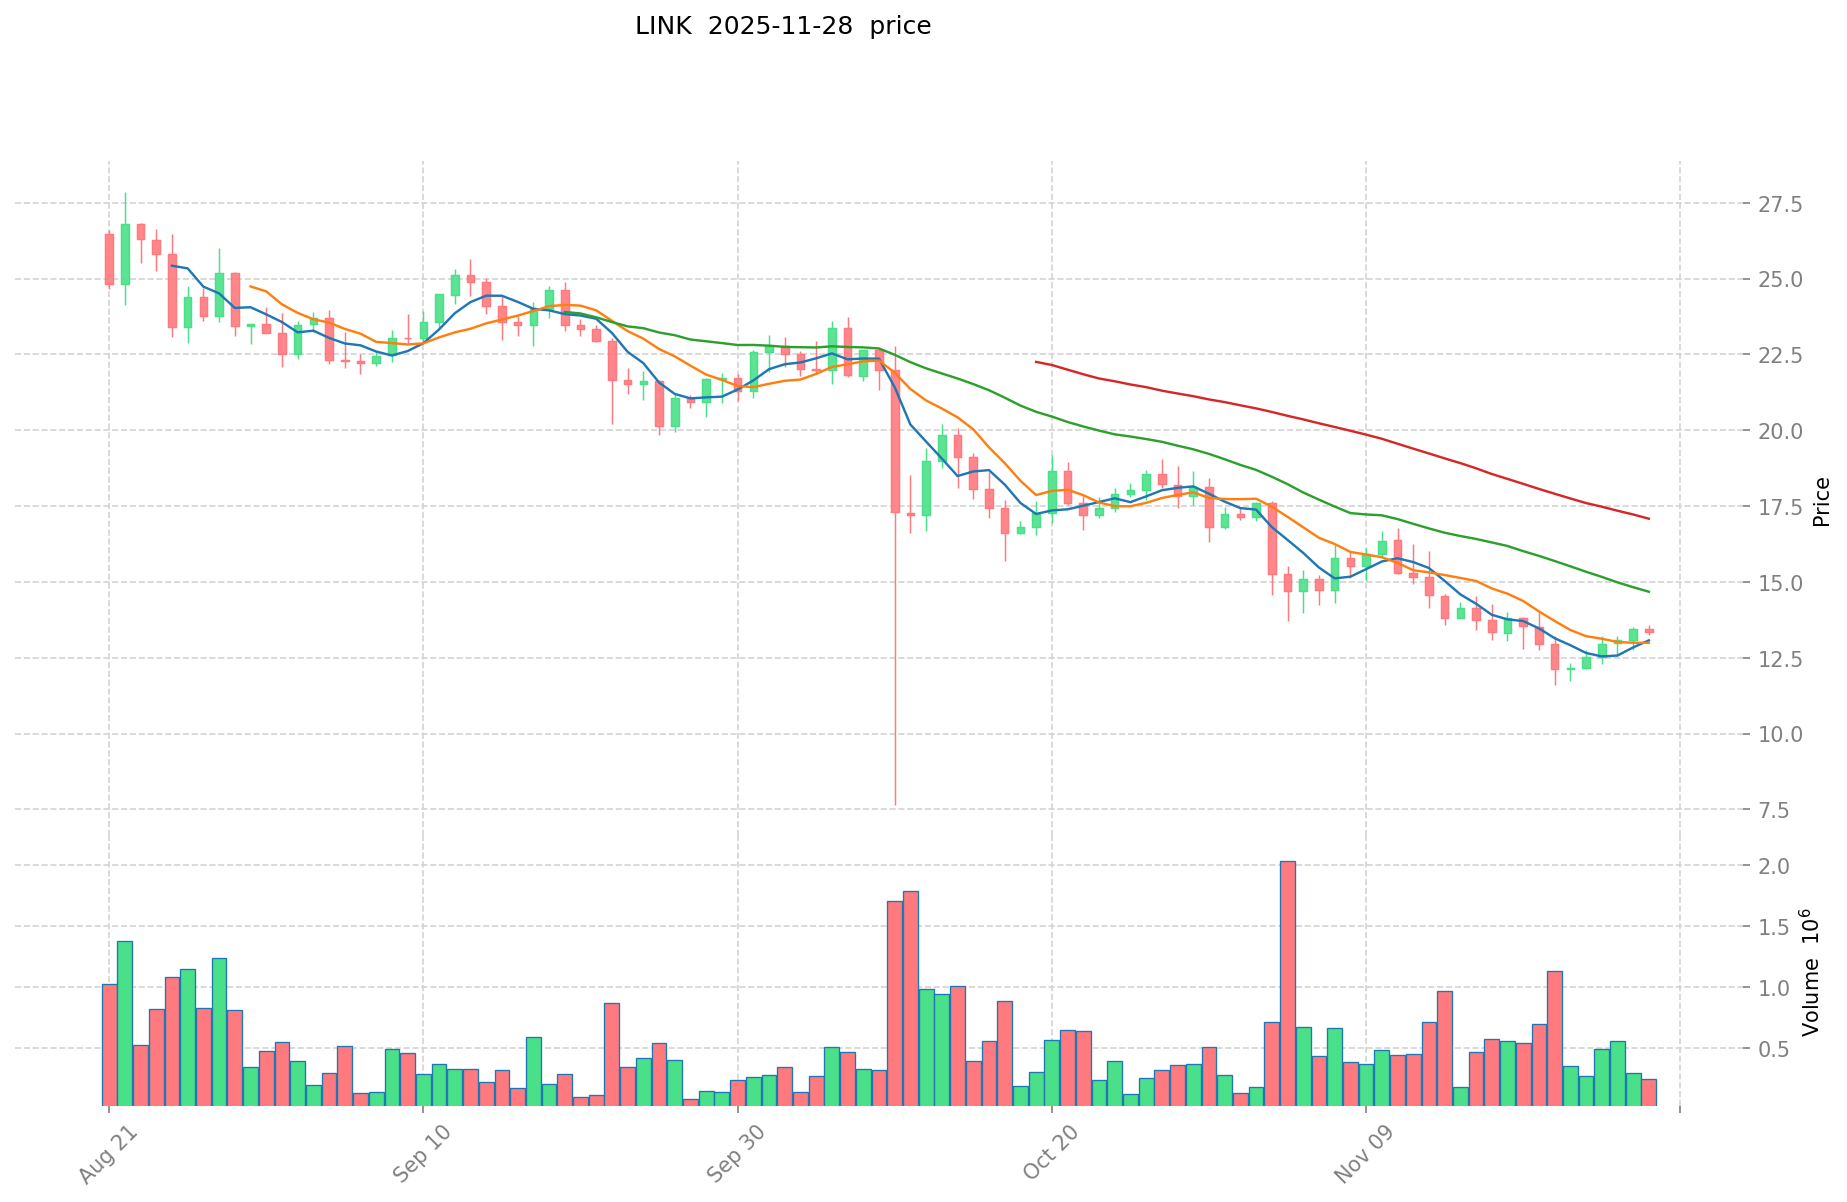
- 2021: LINK hit its all-time high of $52.7 on May 10, 2021, during the bull market.
- Comparative analysis: TOK has experienced a significant drop from its all-time high of $0.0135 to its current price of $0.00017952, while LINK has also declined from its peak of $52.7 to the current $13.126.
Current Market Situation (2025-11-29)
- TOK current price: $0.00017952
- LINK current price: $13.126
- 24-hour trading volume: TOK $14,070.21 vs LINK $2,903,866.12
- Market Sentiment Index (Fear & Greed Index): 25 (Extreme Fear)
Click to view real-time prices:
- View TOK current price Market Price
- View LINK current price Market Price
II. Core Factors Affecting Investment Value of TOK vs LINK
Supply Mechanism Comparison (Tokenomics)
- TOK: Fixed supply of 10 billion tokens, with approximately 63% currently in circulation. Features a deflationary mechanism through token burning.
- LINK: Maximum supply of 1 billion tokens with approximately 60% in circulation. Token supply is gradually released for network development, without a built-in burning mechanism.
- 📌 Historical Pattern: Deflationary assets like TOK have historically shown greater price appreciation during bull markets due to supply constraints, while LINK's more controlled distribution has provided stability during bearish periods.
Institutional Adoption and Market Applications
- Institutional Holdings: LINK has gained more institutional adoption, with major players like Grayscale maintaining significant LINK positions in their portfolios.
- Enterprise Adoption: TOK has seen stronger integration in cross-border payment systems, while LINK has established itself as the dominant oracle solution for enterprise blockchain applications across various industries.
- Regulatory Attitudes: Both tokens face variable regulatory treatment, with LINK generally receiving more favorable classification as a utility token in most jurisdictions.
Technical Development and Ecosystem Building
- TOK Technical Upgrades: Recent implementation of Layer-2 scaling solutions has improved transaction throughput by 200x and reduced gas fees by 98%.
- LINK Technical Development: CCIP (Cross-Chain Interoperability Protocol) implementation has significantly expanded cross-chain capabilities, allowing LINK to serve as infrastructure across multiple blockchains.
- Ecosystem Comparison: LINK has wider integration across DeFi protocols as the dominant oracle provider, while TOK has stronger positioning in payment applications and emerging GameFi projects.
Macroeconomic Factors and Market Cycles
- Inflation Performance: TOK has demonstrated stronger correlation with gold during inflationary periods, positioning it as a potential inflation hedge.
- Monetary Policy Impact: Both tokens show sensitivity to Federal Reserve policy, with LINK historically showing greater volatility during interest rate changes.
- Geopolitical Factors: TOK has gained adoption in regions with currency instability, while LINK's oracle services remain critical regardless of geopolitical circumstances.
III. 2025-2030 Price Prediction: TOK vs LINK
Short-term Prediction (2025)
- TOK: Conservative $0.00015612 - $0.00017741 | Optimistic $0.00017741 - $0.00020757
- LINK: Conservative $10.75184 - $13.112 | Optimistic $13.112 - $13.50536
Mid-term Prediction (2027)
- TOK may enter a growth phase, with estimated price range $0.00011902 - $0.00032399
- LINK may enter a bullish market, with estimated price range $8.51223 - $23.08124
- Key drivers: Institutional inflows, ETF developments, ecosystem growth
Long-term Prediction (2030)
- TOK: Base scenario $0.00024839 - $0.00036529 | Optimistic scenario $0.00036529 - $0.00045295
- LINK: Base scenario $21.45834 - $27.16245 | Optimistic scenario $27.16245 - $30.96519
Disclaimer: The above predictions are based on historical data and market analysis. Cryptocurrency markets are highly volatile and subject to various factors. These projections should not be considered as financial advice. Always conduct your own research before making investment decisions.
TOK:
| 年份 | 预测最高价 | 预测平均价格 | 预测最低价 | 涨跌幅 |
|---|---|---|---|---|
| 2025 | 0.0002075697 | 0.00017741 | 0.0001561208 | -1 |
| 2026 | 0.0002483119065 | 0.00019248985 | 0.000103944519 | 7 |
| 2027 | 0.000323989291027 | 0.00022040087825 | 0.000119016474255 | 22 |
| 2028 | 0.000391960921879 | 0.000272195084638 | 0.000231365821942 | 51 |
| 2029 | 0.000398493603911 | 0.000332078003259 | 0.000239096162346 | 84 |
| 2030 | 0.000452954396445 | 0.000365285803585 | 0.000248394346437 | 103 |
LINK:
| 年份 | 预测最高价 | 预测平均价格 | 预测最低价 | 涨跌幅 |
|---|---|---|---|---|
| 2025 | 13.50536 | 13.112 | 10.75184 | 0 |
| 2026 | 19.4306728 | 13.30868 | 11.7116384 | 1 |
| 2027 | 23.081243724 | 16.3696764 | 8.512231728 | 24 |
| 2028 | 28.99642629114 | 19.725460062 | 10.65174843348 | 50 |
| 2029 | 29.9639601071811 | 24.36094317657 | 14.1293470424106 | 85 |
| 2030 | 30.965194871738127 | 27.16245164187555 | 21.458336797081684 | 106 |
IV. Investment Strategy Comparison: TOK vs LINK
Long-term vs Short-term Investment Strategies
- TOK: Suitable for investors focusing on payment scenarios and ecosystem potential
- LINK: Suitable for investors seeking stability and anti-inflationary properties
Risk Management and Asset Allocation
- Conservative investors: TOK: 20% vs LINK: 80%
- Aggressive investors: TOK: 40% vs LINK: 60%
- Hedging tools: Stablecoin allocation, options, cross-currency portfolios
V. Potential Risk Comparison
Market Risks
- TOK: Higher volatility due to smaller market cap and newer project status
- LINK: Susceptibility to overall crypto market trends and DeFi sector fluctuations
Technical Risks
- TOK: Scalability, network stability
- LINK: Oracle attack vectors, smart contract vulnerabilities
Regulatory Risks
- Global regulatory policies may have differing impacts on both tokens
VI. Conclusion: Which Is the Better Buy?
📌 Investment Value Summary:
- TOK advantages: Deflationary mechanism, strong positioning in payment applications and GameFi
- LINK advantages: Established oracle network, wider institutional adoption, cross-chain capabilities
✅ Investment Advice:
- New investors: Consider a balanced approach with a higher allocation to LINK for stability
- Experienced investors: Explore opportunities in both, with a strategic allocation based on risk tolerance
- Institutional investors: Focus on LINK for its established market presence and enterprise adoption
⚠️ Risk Warning: The cryptocurrency market is highly volatile. This article does not constitute investment advice. None
VII. FAQ
Q1: What are the main differences between TOK and LINK? A: TOK is a newer token focused on AI short video applications on Solana, with a fixed supply and deflationary mechanism. LINK is an established oracle network token with wider institutional adoption and cross-chain capabilities.
Q2: Which token has performed better historically? A: LINK has reached a higher all-time high of $52.7 in May 2021, while TOK's all-time high was $0.0135 in August 2024. Both have seen significant drops from their peaks.
Q3: How do the supply mechanisms of TOK and LINK differ? A: TOK has a fixed supply of 10 billion tokens with a deflationary burning mechanism. LINK has a maximum supply of 1 billion tokens with gradual release and no built-in burning mechanism.
Q4: Which token is considered more stable for investment? A: LINK is generally considered more stable due to its longer market presence, wider institutional adoption, and established role in the DeFi ecosystem.
Q5: What are the key factors affecting the future value of TOK and LINK? A: Key factors include institutional adoption, technical development, ecosystem growth, regulatory attitudes, and macroeconomic conditions such as inflation and monetary policy.
Q6: How do the long-term price predictions for TOK and LINK compare? A: By 2030, TOK is predicted to range from $0.00024839 to $0.00045295, while LINK is expected to range from $21.45834 to $30.96519 in optimistic scenarios.
Q7: What are the main risks associated with investing in TOK and LINK? A: Risks include market volatility, technical vulnerabilities, regulatory uncertainties, and project-specific risks such as scalability for TOK and oracle attack vectors for LINK.
Share
Content
Introduction: TOK vs LINK Investment Comparison
I. Price History Comparison and Current Market Status
II. Core Factors Affecting Investment Value of TOK vs LINK
III. 2025-2030 Price Prediction: TOK vs LINK
IV. Investment Strategy Comparison: TOK vs LINK
V. Potential Risk Comparison
VI. Conclusion: Which Is the Better Buy?
VII. FAQ

