TST vs QNT: A Comparative Analysis of Two Emerging Cryptocurrencies in the Digital Asset Market
Introduction: TST vs QNT Investment Comparison
In the cryptocurrency market, the comparison between TeleportDAO vs Quant has always been an unavoidable topic for investors. The two not only show significant differences in market cap ranking, application scenarios, and price performance, but also represent different cryptocurrency asset positioning.
TeleportDAO (TST): Since its launch in 2024, it has gained market recognition for its trustless and Bitcoin-grade secure connections from Bitcoin to EVM chains.
Quant (QNT): Since its inception in 2018, it has been hailed as a technology provider enabling trusted digital interaction, and is one of the leading cryptocurrencies in terms of global trading volume and market capitalization.
This article will comprehensively analyze the investment value comparison between TeleportDAO vs Quant, focusing on historical price trends, supply mechanisms, institutional adoption, technological ecosystems, and future predictions, attempting to answer the question investors care about most:
"Which is the better buy right now?"
I. Price History Comparison and Current Market Status
TST and QNT Historical Price Trends
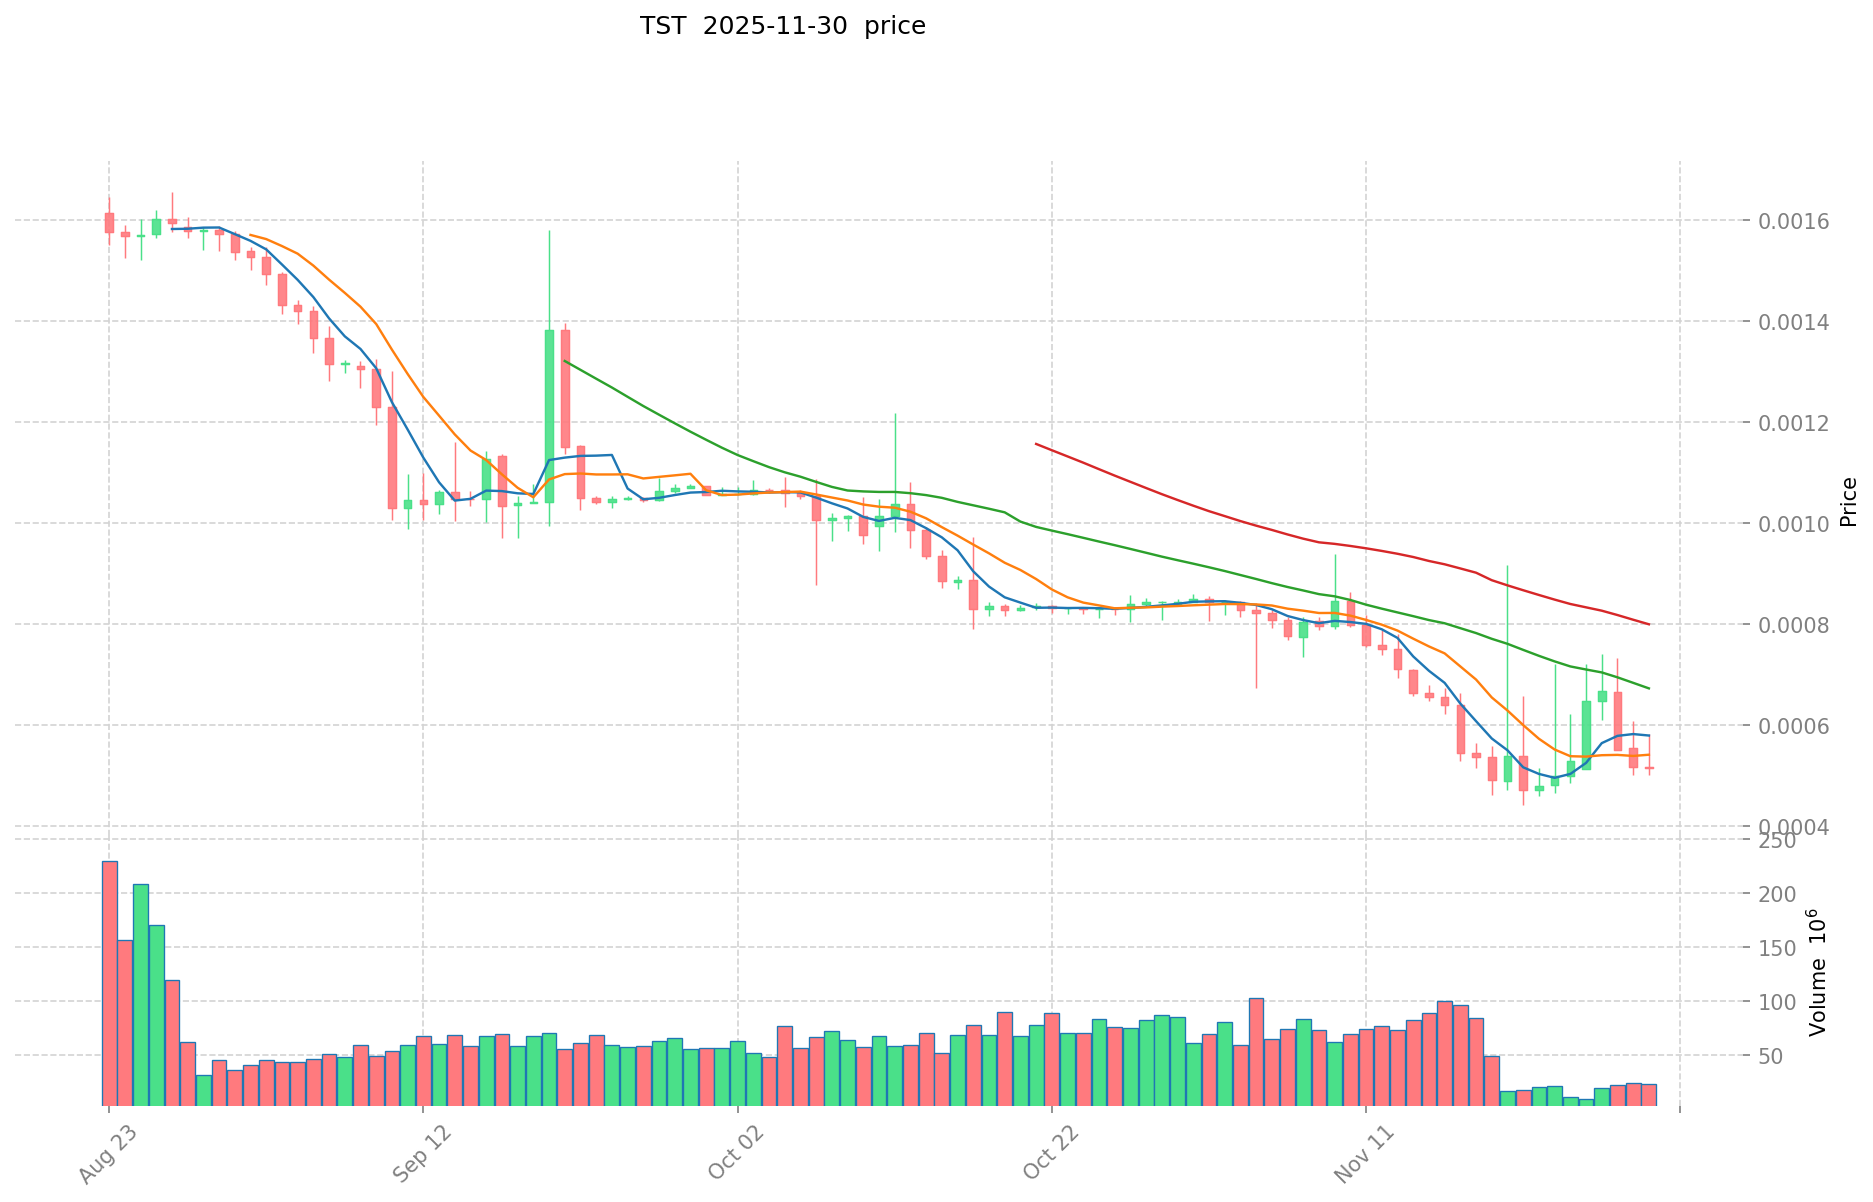
- 2024: TST reached its all-time high of $0.225 on June 27, 2024.
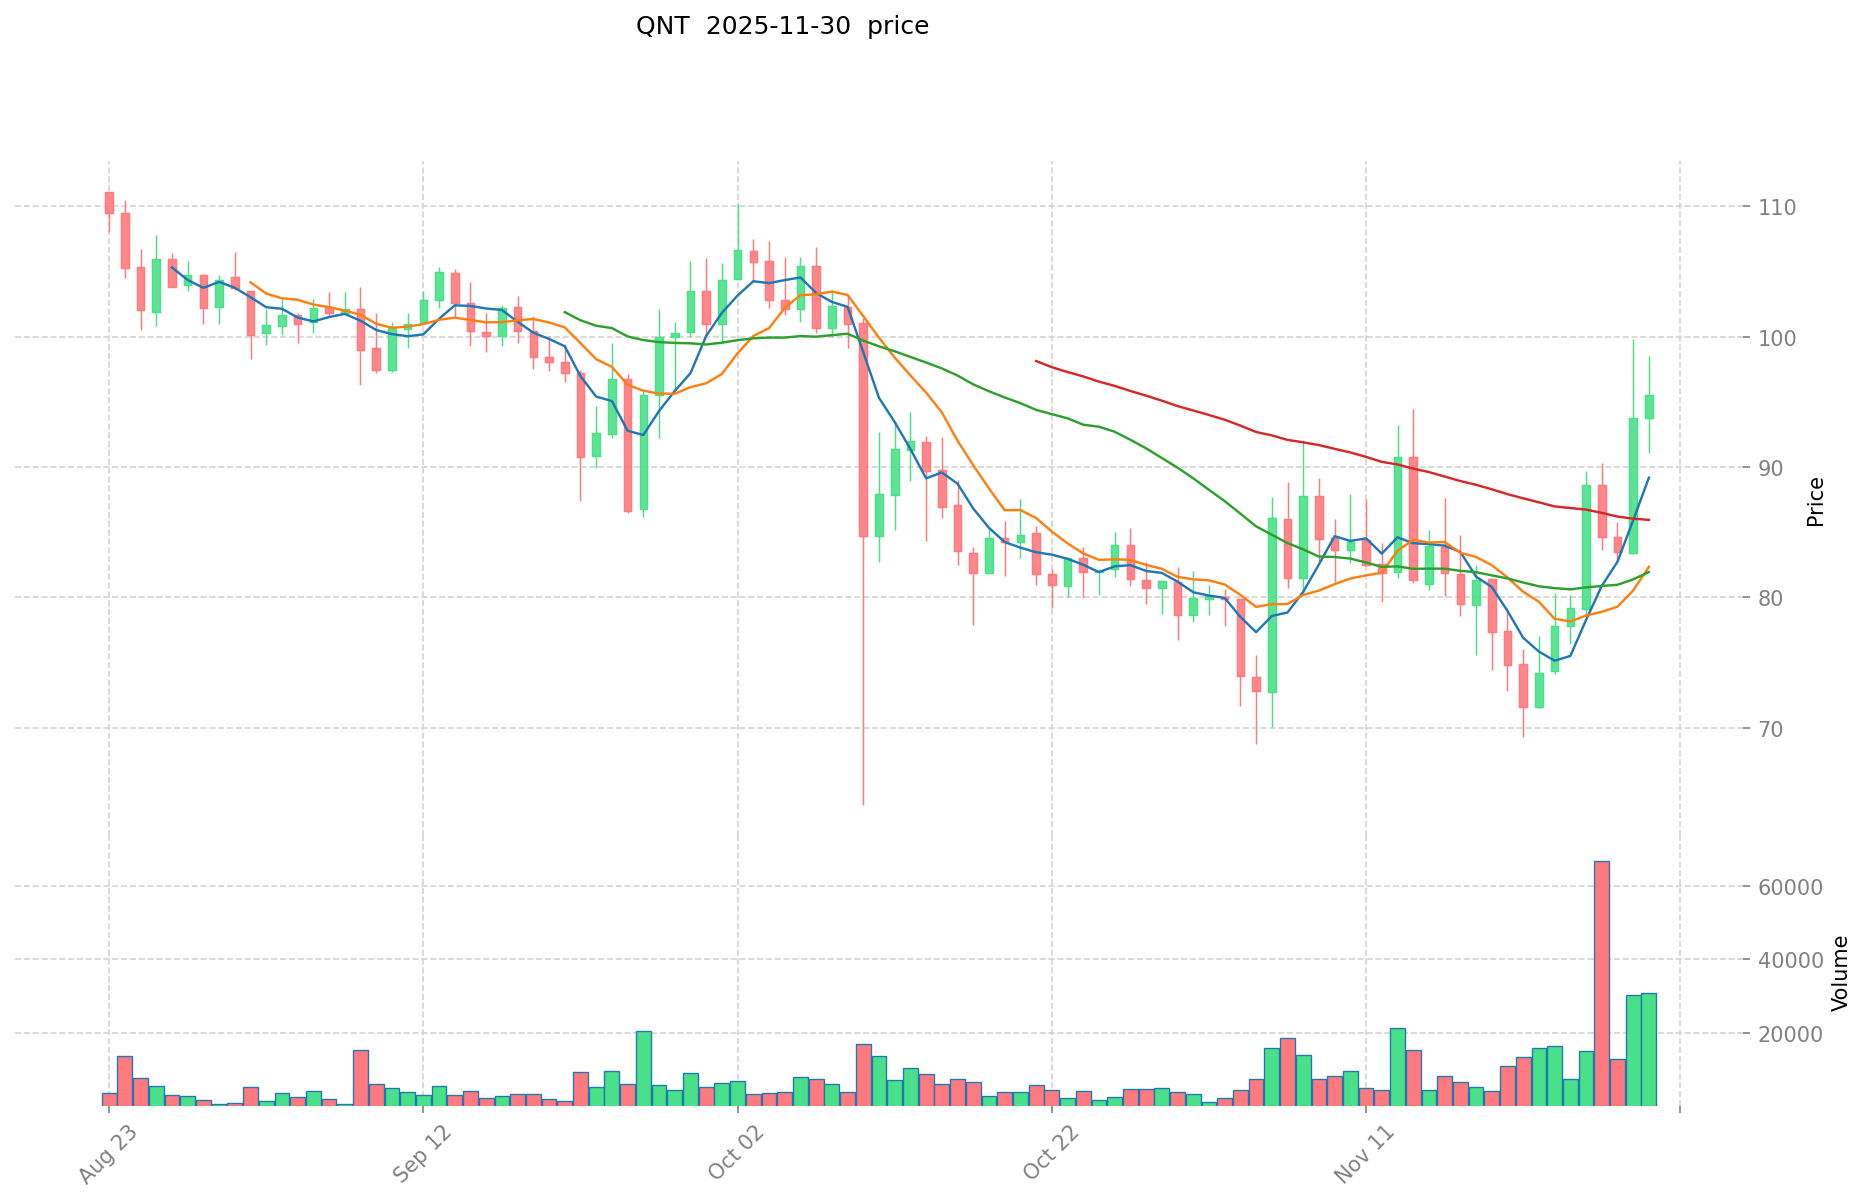
- 2025: QNT experienced a significant price drop, falling to $95.41 as of November 30, 2025.
- Comparative analysis: In the recent market cycle, TST dropped from its high of $0.225 to a low of $0.00044, while QNT showed more stability, maintaining a price above $90.
Current Market Situation (2025-11-30)
- TST current price: $0.0005143
- QNT current price: $95.41
- 24-hour trading volume: TST $12,156.19 vs QNT $2,953,675.81
- Market Sentiment Index (Fear & Greed Index): 28 (Fear)
Click to view real-time prices:
- View TST current price Market Price
- View QNT current price Market Price
II. Key Factors Affecting Investment Value of TST vs QNT
Supply Mechanism Comparison (Tokenomics)
- TST: The token uses a deflationary model with a maximum supply cap. Its burning mechanism is designed to gradually reduce available supply over time.
- QNT: Quant has a fixed supply of 14.6 million tokens, with no new tokens being created. This limited supply is intended to create scarcity as adoption increases.
- 📌 Historical Pattern: Capped supply tokens like QNT have historically shown stronger price resilience during market downturns compared to tokens with more elastic supplies.
Institutional Adoption and Market Applications
- Institutional Holdings: QNT has gained more institutional interest, with adoption by financial institutions looking to leverage the Overledger network.
- Enterprise Adoption: QNT has established partnerships with major enterprises and financial institutions for interoperability solutions, while TST has focused more on retail-oriented applications and cross-border payments.
- Regulatory Attitudes: Both tokens face varying regulatory approaches across jurisdictions, but QNT's focus on enterprise blockchain interoperability aligns better with regulatory frameworks in major financial markets.
Technical Development and Ecosystem Building
- QNT Technical Upgrades: Quant's Overledger technology enables interoperability between different blockchain networks, positioning it as infrastructure for enterprise blockchain adoption.
- TST Technical Development: Focuses on scalability improvements and expanding cross-chain capabilities for DeFi applications.
- Ecosystem Comparison: QNT has stronger enterprise and institutional payment applications, while TST shows more activity in decentralized finance and cross-chain functionalities.
Macroeconomic Factors and Market Cycles
- Inflation Environment Performance: QNT's fixed supply model provides stronger inflation-resistant properties compared to TST.
- Macroeconomic Monetary Policy: Both tokens show sensitivity to interest rate changes and USD strength, with high correlation to overall crypto market trends.
- Geopolitical Factors: QNT's focus on institutional interoperability positions it better for adoption in cross-border transaction networks, potentially providing greater resilience during geopolitical uncertainty.
III. 2025-2030 Price Predictions: TST vs QNT
Short-term Forecast (2025)
- TST: Conservative $0.00046287 - $0.0005143 | Optimistic $0.0005143 - $0.000745735
- QNT: Conservative $62.0165 - $95.41 | Optimistic $95.41 - $101.1346
Mid-term Forecast (2027)
- TST may enter a growth phase, with prices estimated between $0.000618141670125 and $0.000817542208875
- QNT may enter a consolidation phase, with prices estimated between $58.42288235 and $104.7582718
- Key drivers: Institutional fund inflows, ETF developments, ecosystem growth
Long-term Forecast (2030)
- TST: Base scenario $0.000596198862163 - $0.000917229018713 | Optimistic scenario $0.000917229018713 - $0.001008951920584
- QNT: Base scenario $83.626017201290025 - $144.18278827808625 | Optimistic scenario $144.18278827808625 - $206.181387237663337
Disclaimer: The above forecasts are based on historical data and market analysis. Cryptocurrency markets are highly volatile and unpredictable. These predictions should not be considered as financial advice. Always conduct your own research before making investment decisions.
TST:
| 年份 | 预测最高价 | 预测平均价格 | 预测最低价 | 涨跌幅 |
|---|---|---|---|---|
| 2025 | 0.000745735 | 0.0005143 | 0.00046287 | 0 |
| 2026 | 0.000699319425 | 0.0006300175 | 0.0006048168 | 22 |
| 2027 | 0.000817542208875 | 0.0006646684625 | 0.000618141670125 | 29 |
| 2028 | 0.000904148509538 | 0.000741105335687 | 0.000585473215193 | 44 |
| 2029 | 0.001011831114814 | 0.000822626922613 | 0.00076504303803 | 59 |
| 2030 | 0.001008951920584 | 0.000917229018713 | 0.000596198862163 | 78 |
QNT:
| 年份 | 预测最高价 | 预测平均价格 | 预测最低价 | 涨跌幅 |
|---|---|---|---|---|
| 2025 | 101.1346 | 95.41 | 62.0165 | 0 |
| 2026 | 103.185915 | 98.2723 | 93.358685 | 3 |
| 2027 | 104.7582718 | 100.7291075 | 58.42288235 | 5 |
| 2028 | 146.9234761995 | 102.74368965 | 82.19495172 | 7 |
| 2029 | 163.5319936314225 | 124.83358292475 | 118.5919037785125 | 30 |
| 2030 | 206.181387237663337 | 144.18278827808625 | 83.626017201290025 | 51 |
IV. Investment Strategy Comparison: TST vs QNT
Long-term vs Short-term Investment Strategies
- TST: Suitable for investors focused on DeFi applications and cross-chain capabilities
- QNT: Suitable for investors seeking institutional adoption and interoperability solutions
Risk Management and Asset Allocation
- Conservative investors: TST: 20% vs QNT: 80%
- Aggressive investors: TST: 40% vs QNT: 60%
- Hedging tools: Stablecoin allocation, options, cross-currency portfolios
V. Potential Risk Comparison
Market Risks
- TST: Higher volatility and susceptibility to market sentiment
- QNT: Potential overvaluation due to institutional hype
Technical Risks
- TST: Scalability, network stability
- QNT: Centralization concerns, potential security vulnerabilities
Regulatory Risks
- Global regulatory policies may have differing impacts on both tokens, with QNT potentially facing less scrutiny due to its enterprise focus
VI. Conclusion: Which Is the Better Buy?
📌 Investment Value Summary:
- TST advantages: Cross-chain capabilities, deflationary model, DeFi focus
- QNT advantages: Institutional adoption, fixed supply, interoperability solutions
✅ Investment Advice:
- New investors: Consider a balanced approach with a slight bias towards QNT due to its institutional backing
- Experienced investors: Explore a diversified portfolio with both TST and QNT, adjusting based on risk tolerance
- Institutional investors: Focus on QNT for its enterprise-grade solutions and regulatory alignment
⚠️ Risk Warning: The cryptocurrency market is highly volatile. This article does not constitute investment advice. None
VII. FAQ
Q1: What are the main differences between TST and QNT? A: TST focuses on trustless and Bitcoin-grade secure connections from Bitcoin to EVM chains, while QNT enables trusted digital interaction and interoperability between different blockchain networks. TST is newer (launched in 2024) and more focused on DeFi applications, while QNT (launched in 2018) has stronger institutional adoption and enterprise-grade solutions.
Q2: Which token has shown better price stability? A: Based on historical data, QNT has shown better price stability. While TST dropped from its high of $0.225 to a low of $0.00044, QNT maintained a price above $90 during the same period.
Q3: How do the supply mechanisms of TST and QNT differ? A: TST uses a deflationary model with a maximum supply cap and a burning mechanism designed to reduce available supply over time. QNT has a fixed supply of 14.6 million tokens with no new tokens being created, aiming to create scarcity as adoption increases.
Q4: Which token is more suitable for institutional investors? A: QNT is generally more suitable for institutional investors due to its focus on enterprise blockchain interoperability, established partnerships with major financial institutions, and better alignment with regulatory frameworks in major financial markets.
Q5: What are the key factors affecting the long-term value of TST and QNT? A: Key factors include institutional adoption, technical development and ecosystem building, macroeconomic factors, regulatory environment, and market cycles. QNT's institutional focus and interoperability solutions give it an edge in enterprise adoption, while TST's cross-chain capabilities and DeFi focus may appeal to retail investors and DeFi enthusiasts.
Q6: How should investors approach risk management when investing in TST and QNT? A: Investors should consider a diversified portfolio approach. Conservative investors might allocate 20% to TST and 80% to QNT, while more aggressive investors could consider a 40% TST to 60% QNT split. Additionally, using stablecoins, options, and cross-currency portfolios can help manage risk.
Q7: What are the potential risks associated with investing in TST and QNT? A: For TST, risks include higher volatility, market sentiment susceptibility, and technical challenges related to scalability and network stability. QNT faces potential overvaluation due to institutional hype, centralization concerns, and potential security vulnerabilities. Both tokens are subject to regulatory risks, although QNT may face less scrutiny due to its enterprise focus.
Share
Content
Introduction: TST vs QNT Investment Comparison
I. Price History Comparison and Current Market Status
II. Key Factors Affecting Investment Value of TST vs QNT
III. 2025-2030 Price Predictions: TST vs QNT
IV. Investment Strategy Comparison: TST vs QNT
V. Potential Risk Comparison
VI. Conclusion: Which Is the Better Buy?
VII. FAQ

