This article compares TURT and SAND, focusing on their investment value and market position in the cryptocurrency space. It examines price history, supply mechanisms, institutional adoption, technical development, and market risks. The piece caters to both novice and experienced investors by offering insights into investment strategies, risk management, and potential growth. The analysis aims to help investors decide on asset allocation between TURT and SAND. Key factors are discussed to clarify which token presents the better buying opportunity.
Introduction: TURT vs SAND Investment Comparison
In the cryptocurrency market, the comparison between TURT and SAND has been an unavoidable topic for investors. The two not only show significant differences in market cap ranking, application scenarios, and price performance, but also represent different positions in crypto assets.
Turtsat (TURT): Launched in 2023, it has gained market recognition for its position as a community-driven open platform for Ordinals.
Sandbox (SAND): Since its inception in 2020, it has been hailed as a virtual game world, becoming one of the cryptocurrencies with high global trading volume and market capitalization.
This article will comprehensively analyze the investment value comparison between TURT and SAND, focusing on historical price trends, supply mechanisms, institutional adoption, technological ecosystems, and future predictions, attempting to answer the question investors care about most:
"Which is the better buy right now?"
I. Price History Comparison and Current Market Status
TURT (Coin A) and SAND (Coin B) Historical Price Trends
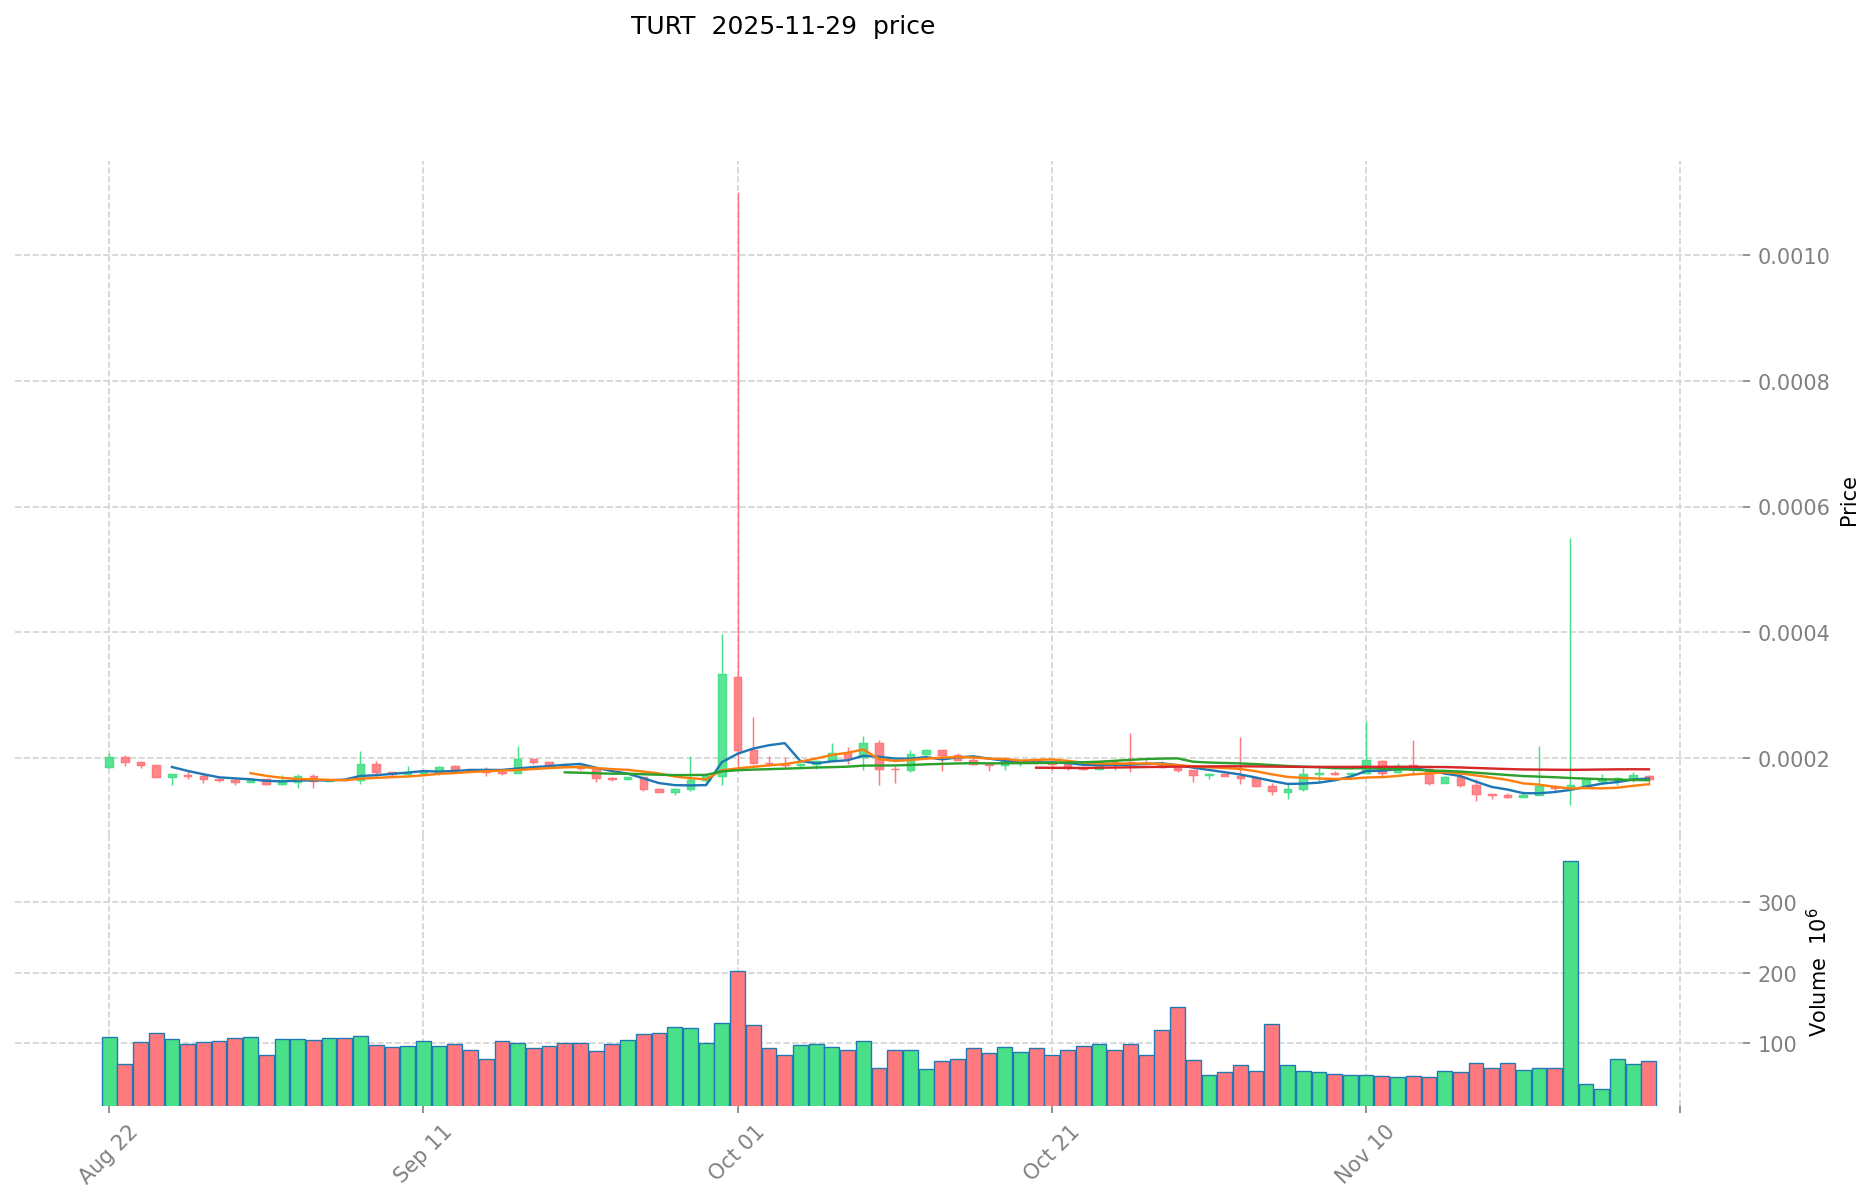
- 2023: TURT reached its all-time high of $0.088 on December 26, 2023.
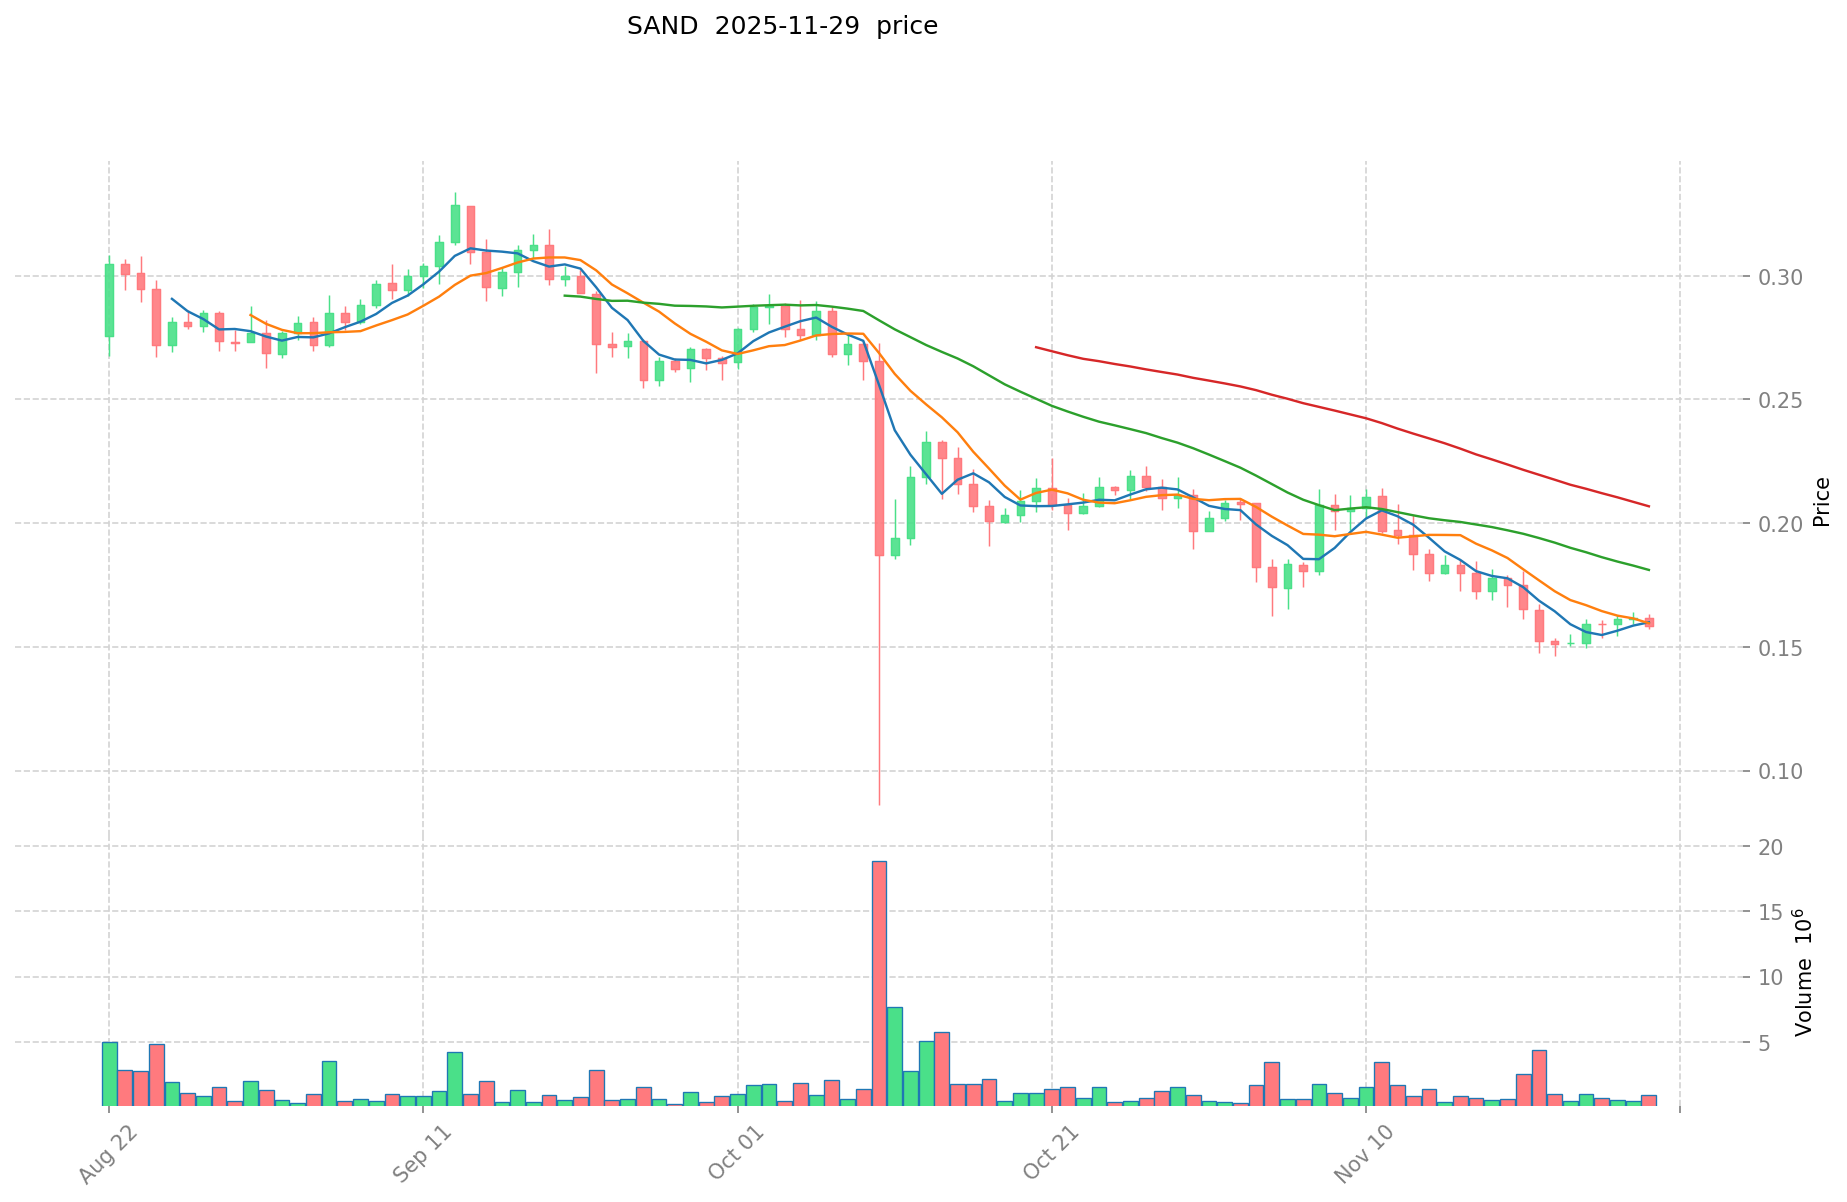
- 2021: SAND reached its all-time high of $8.4 on November 25, 2021.
- Comparative analysis: From their respective peaks, TURT has dropped to $0.0001661, while SAND has declined to $0.1569.
Current Market Situation (2025-11-29)
- TURT current price: $0.0001661
- SAND current price: $0.1569
- 24-hour trading volume: TURT $11,812.99 vs SAND $124,713.57
- Market Sentiment Index (Fear & Greed Index): 28 (Fear)
Click to view real-time prices:
- Check TURT current price Market Price
- Check SAND current price Market Price
II. Core Factors Affecting the Investment Value of TURT vs SAND
Supply Mechanism Comparison (Tokenomics)
- TURT: Limited total supply of 10 billion tokens with scheduled releases over time
- SAND: Maximum supply capped at 3 billion tokens with token distribution across ecosystem components
- 📌 Historical pattern: Fixed supply models like TURT's tend to create scarcity that can drive price appreciation during high demand periods, while SAND's smaller maximum supply may lead to faster market responses to adoption changes.
Institutional Adoption and Market Applications
- Institutional holdings: SAND has more established institutional presence with partnerships like Adidas, Gucci, and Warner Music Group
- Enterprise adoption: SAND has gained traction in brand integration and metaverse presence, while TURT aims to capture gaming and virtual real estate markets
- Regulatory attitudes: Both face similar regulatory environments as metaverse tokens, with jurisdictions increasingly focusing on virtual asset regulations
Technical Development and Ecosystem Building
- TURT technical upgrades: Focuses on Ethereum scaling solutions and future cross-chain functionality
- SAND technical development: Established Polygon integration with ongoing improvements to The Sandbox platform
- Ecosystem comparison: SAND has a more mature ecosystem with active virtual land sales, creator tools, and brand partnerships; TURT is developing its Turtle Islands ecosystem with emphasis on gaming and community governance
Macroeconomic and Market Cycles
- Performance during inflation: Neither has established strong anti-inflationary characteristics, both tend to move with broader crypto market sentiment
- Macroeconomic monetary policy: Interest rate changes affect both similarly as risk assets, with high rates typically suppressing growth
- Geopolitical factors: Both tokens cater to global virtual world participation, with potential benefits from increasing digital asset adoption worldwide
III. 2025-2030 Price Prediction: TURT vs SAND
Short-term Prediction (2025)
- TURT: Conservative $0.00010002 - $0.0001667 | Optimistic $0.000191705
- SAND: Conservative $0.14148 - $0.1572 | Optimistic $0.209076
Mid-term Prediction (2027)
- TURT may enter a growth phase, estimated price range $0.000135073884375 - $0.000268131740625
- SAND may enter a bullish market, estimated price range $0.213172632 - $0.298881216
- Key drivers: Institutional capital inflow, ETF, ecosystem development
Long-term Prediction (2030)
- TURT: Base scenario $0.00030961965901 | Optimistic scenario $0.000374639787402
- SAND: Base scenario $0.3418595656812 | Optimistic scenario $0.437580244071936
View detailed price predictions for TURT and SAND
Disclaimer: The above predictions are based on historical data and market analysis. Cryptocurrency markets are highly volatile and subject to change. This information should not be considered as financial advice.
TURT:
| 年份 |
预测最高价 |
预测平均价格 |
预测最低价 |
涨跌幅 |
| 2025 |
0.000191705 |
0.0001667 |
0.00010002 |
0 |
| 2026 |
0.000224003125 |
0.0001792025 |
0.0001576982 |
7 |
| 2027 |
0.000268131740625 |
0.0002016028125 |
0.000135073884375 |
21 |
| 2028 |
0.000274794713578 |
0.000234867276562 |
0.000206683203375 |
41 |
| 2029 |
0.00036440832295 |
0.00025483099507 |
0.00014525366719 |
53 |
| 2030 |
0.000374639787402 |
0.00030961965901 |
0.000167194615865 |
86 |
SAND:
| 年份 |
预测最高价 |
预测平均价格 |
预测最低价 |
涨跌幅 |
| 2025 |
0.209076 |
0.1572 |
0.14148 |
0 |
| 2026 |
0.2563932 |
0.183138 |
0.13185936 |
16 |
| 2027 |
0.298881216 |
0.2197656 |
0.213172632 |
39 |
| 2028 |
0.37083247344 |
0.259323408 |
0.21523842864 |
65 |
| 2029 |
0.3686411906424 |
0.31507794072 |
0.2426100143544 |
100 |
| 2030 |
0.437580244071936 |
0.3418595656812 |
0.29058063082902 |
117 |
IV. Investment Strategy Comparison: TURT vs SAND
Long-term vs Short-term Investment Strategy
- TURT: Suitable for investors focusing on community-driven platforms and potential in the Ordinals ecosystem
- SAND: Suitable for investors interested in metaverse and virtual gaming worlds with established partnerships
Risk Management and Asset Allocation
- Conservative investors: TURT: 20% vs SAND: 80%
- Aggressive investors: TURT: 40% vs SAND: 60%
- Hedging tools: Stablecoin allocation, options, cross-currency portfolios
V. Potential Risk Comparison
Market Risk
- TURT: Higher volatility due to newer market entry and smaller market cap
- SAND: Susceptible to broader metaverse and gaming industry trends
Technical Risk
- TURT: Scalability, network stability as a newer platform
- SAND: Dependence on Polygon network, potential security vulnerabilities in smart contracts
Regulatory Risk
- Global regulatory policies may impact both, with SAND potentially facing more scrutiny due to its established presence in virtual asset markets
VI. Conclusion: Which Is the Better Buy?
📌 Investment Value Summary:
- TURT advantages: Community-driven platform, potential for growth in Ordinals ecosystem
- SAND advantages: Established partnerships, mature ecosystem in virtual gaming and metaverse
✅ Investment Advice:
- Novice investors: Consider a smaller allocation to TURT for potential growth, larger allocation to SAND for established presence
- Experienced investors: Balanced approach with both tokens, adjusting based on risk tolerance and market trends
- Institutional investors: SAND may be more suitable due to its established partnerships and ecosystem
⚠️ Risk Warning: Cryptocurrency markets are highly volatile. This article does not constitute investment advice.
None
VII. FAQ
Q1: What are the main differences between TURT and SAND?
A: TURT is a newer, community-driven open platform for Ordinals launched in 2023, while SAND is an established virtual game world cryptocurrency launched in 2020. TURT has a total supply of 10 billion tokens, whereas SAND has a maximum supply of 3 billion tokens. SAND has more institutional partnerships and a more mature ecosystem, while TURT is still developing its Turtle Islands ecosystem.
Q2: Which token has performed better historically?
A: SAND has historically reached a higher all-time high of $8.4 in November 2021, compared to TURT's all-time high of $0.088 in December 2023. However, both have seen significant price declines since their peaks.
Q3: How do their current market situations compare?
A: As of 2025-11-29, TURT's price is $0.0001661 with a 24-hour trading volume of $11,812.99, while SAND's price is $0.1569 with a 24-hour trading volume of $124,713.57. SAND currently has higher liquidity and trading activity.
Q4: What are the key factors affecting the investment value of TURT and SAND?
A: Key factors include supply mechanisms, institutional adoption, technical development, ecosystem building, and macroeconomic conditions. SAND has stronger institutional partnerships and a more established ecosystem, while TURT offers potential growth in the Ordinals ecosystem.
Q5: What are the price predictions for TURT and SAND?
A: By 2030, base scenario predictions are $0.00030961965901 for TURT and $0.3418595656812 for SAND. However, these predictions are subject to market volatility and should not be considered financial advice.
Q6: How should investors approach allocating between TURT and SAND?
A: Conservative investors might consider 20% TURT and 80% SAND, while aggressive investors might opt for 40% TURT and 60% SAND. The allocation should be based on individual risk tolerance and investment goals.
Q7: What are the main risks associated with investing in TURT and SAND?
A: Risks include market volatility, technical challenges such as scalability and security, and potential regulatory changes. TURT may face higher volatility due to its newer market entry, while SAND may be more susceptible to broader metaverse and gaming industry trends.
* The information is not intended to be and does not constitute financial advice or any other recommendation of any sort offered or endorsed by Gate.


