# Article Overview: VEMP vs ATOM Comparison
This comprehensive guide compares VEMP and ATOM—two distinct decentralized finance assets—across price performance, tokenomics, ecosystem adoption, and investment value. The analysis examines historical price trends showing VEMP's 99.95% decline versus ATOM's 95.72% depreciation, evaluates risk-adjusted portfolio allocation strategies, and provides price forecasts through 2031. Designed for cryptocurrency investors ranging from beginners to institutions, this article resolves critical questions about which asset better suits different risk profiles and investment horizons. By contrasting VEMP's metaverse sector exposure with ATOM's established blockchain infrastructure on Gate, readers gain actionable investment recommendations aligned with their financial objectives.
Introduction: VEMP vs ATOM Investment Comparison
In the cryptocurrency market, comparisons between VEMP and ATOM have become an unavoidable topic for investors. The two assets differ significantly in market capitalization ranking, use cases, and price performance, representing distinct positioning within the crypto asset landscape.
VEMP (VEMP): Launched in 2021, VEMP has gained market recognition as a metaverse aggregator providing metaverse asset management services, allowing users to stake various metaverse tokens while earning multiple token rewards including VEMP itself.
ATOM (ATOM): Since its inception in 2015, Cosmos has been recognized as an infrastructure solution for blockchain interoperability, serving as one of the most widely used networks in the cross-chain ecosystem with significant transaction volume and market presence.
This article will comprehensively analyze the investment value comparison between VEMP and ATOM across historical price trends, supply mechanisms, ecosystem adoption, and technical infrastructure, while attempting to answer the question investors care most about:
"Which is the better buy right now?"
I. Price History Comparison and Current Market Status
VEMP and ATOM Historical Price Trends
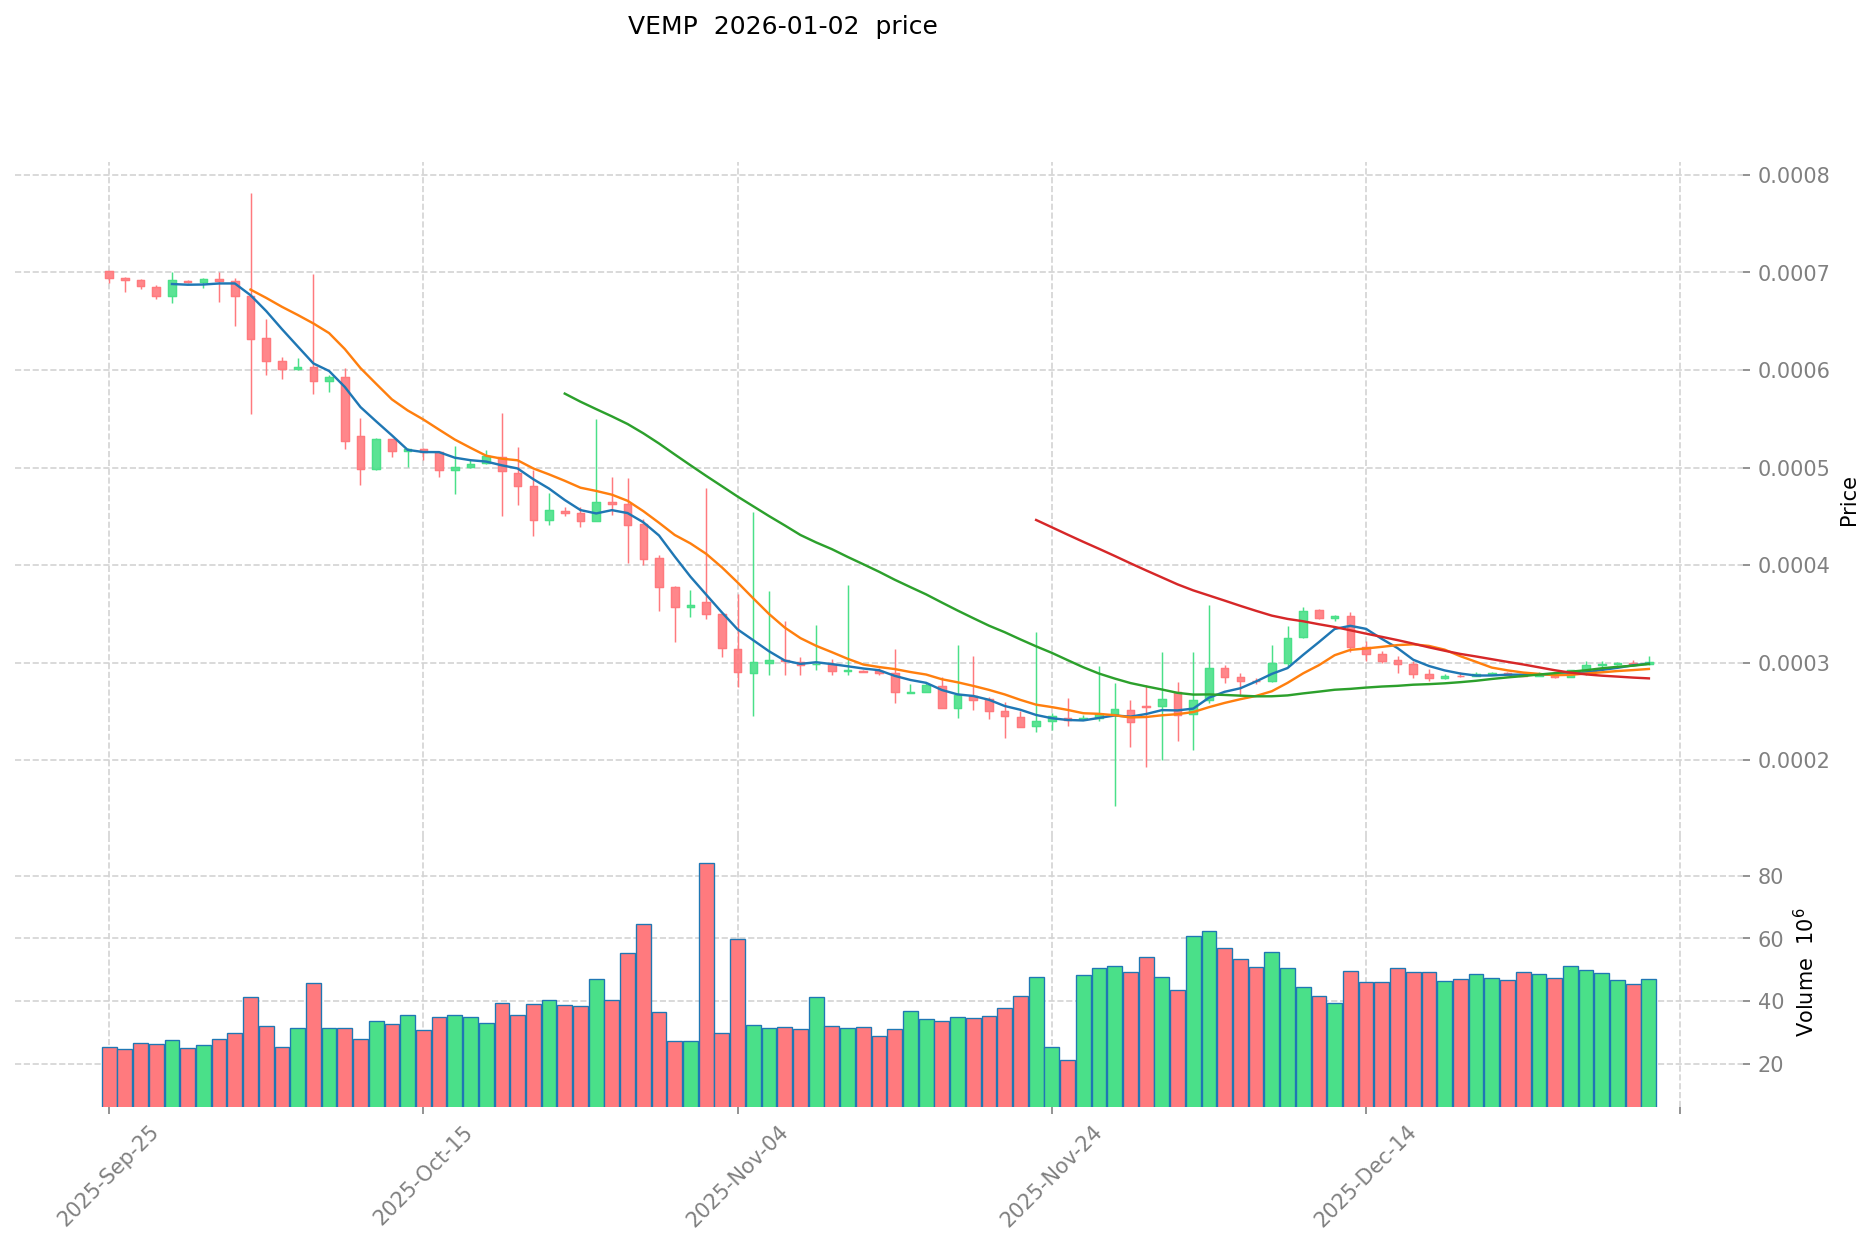
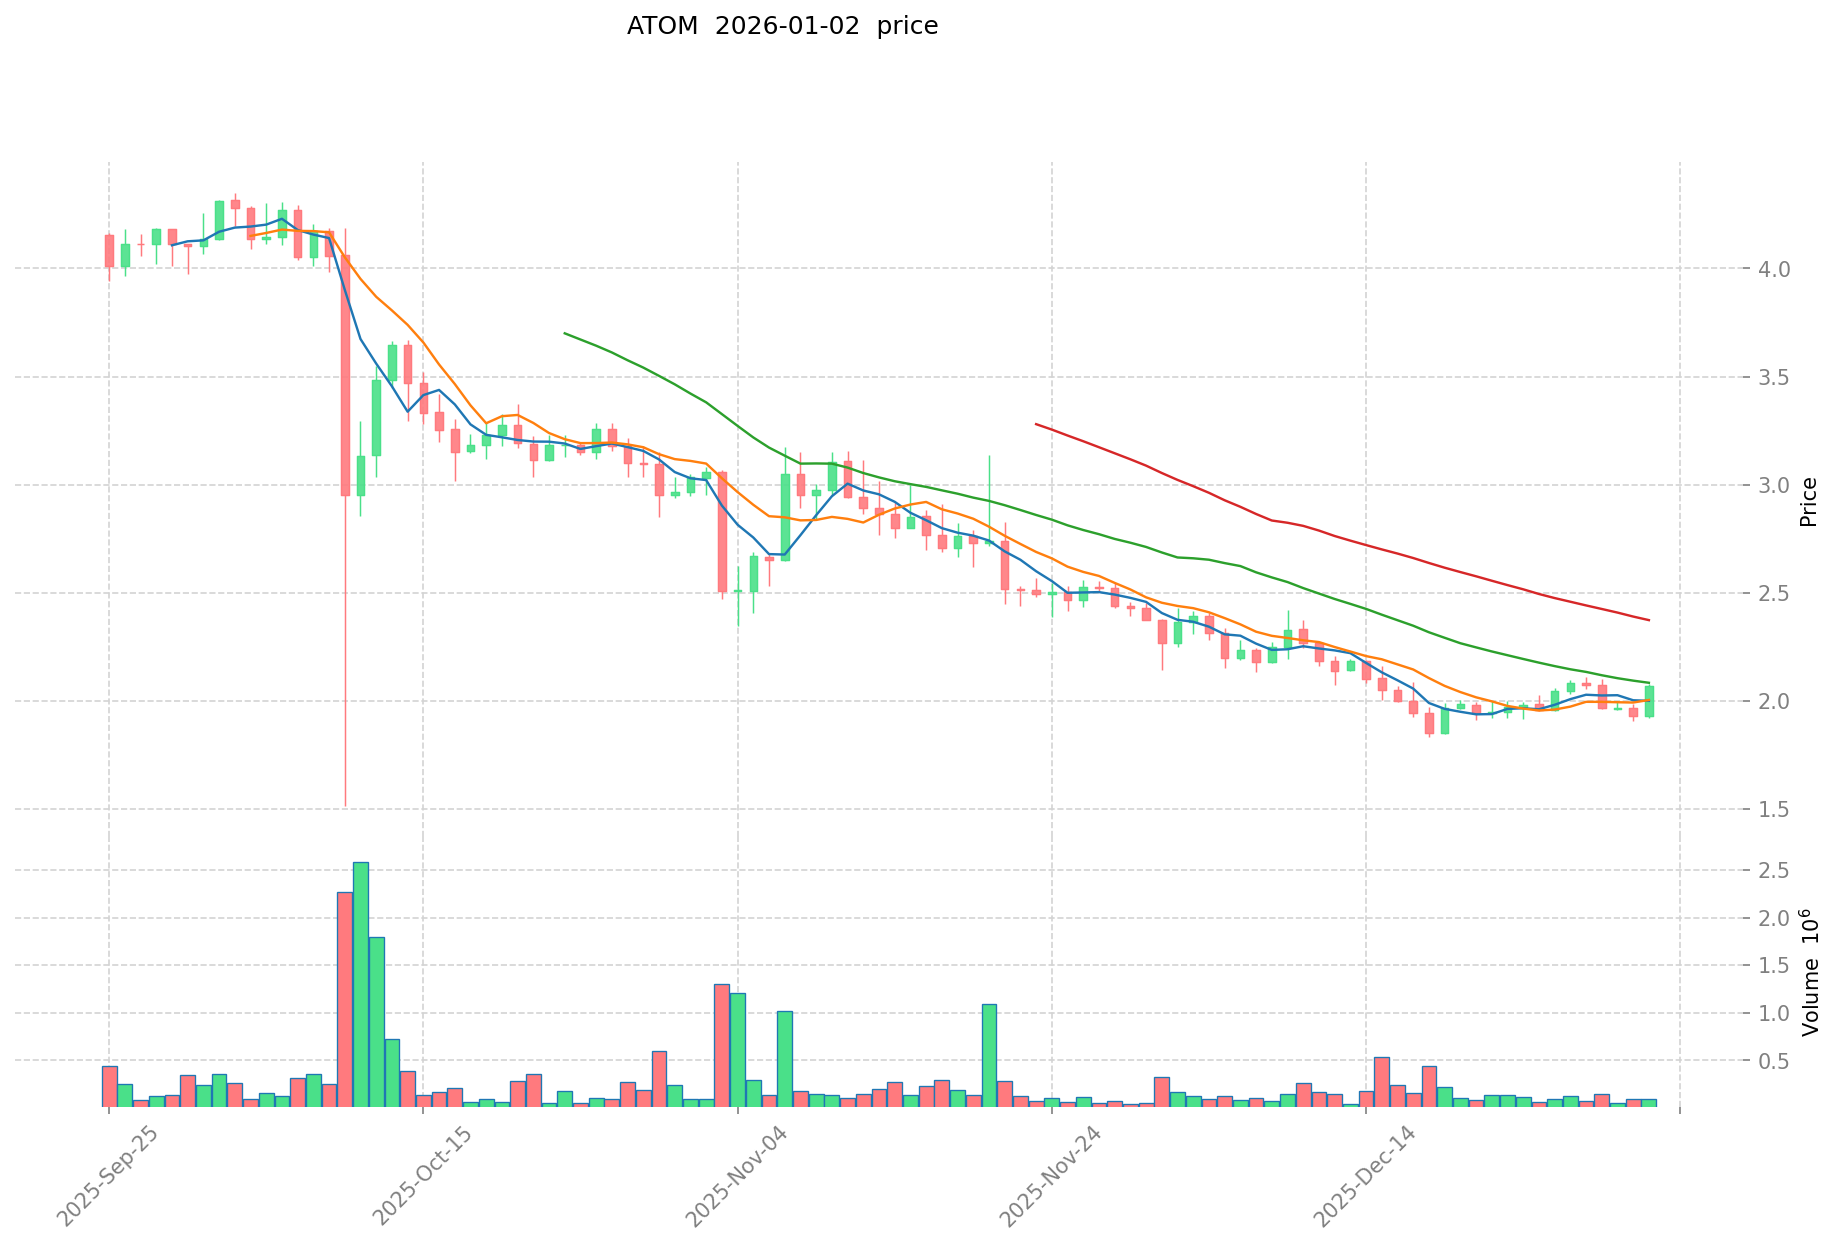
- 2021: VEMP reached its all-time high of $0.655693 on November 21, driven by metaverse sector enthusiasm. ATOM achieved its peak of $44.45 on January 17, 2022, during the broader cryptocurrency bull market.
- 2025: VEMP hit its all-time low of $0.000204 on November 28, reflecting significant market correction. ATOM reached its all-time low of $1.16, demonstrating substantial depreciation from previous peaks.
- Comparative Analysis: Over the market cycles from their respective peaks to current levels, VEMP has experienced an approximately 99.95% decline from its high of $0.655693 to current levels, while ATOM has declined approximately 95.72% from its $44.45 peak, indicating both assets have faced severe downward pressure though VEMP has experienced more pronounced losses.
Current Market Status (2026-01-02)
- VEMP current price: $0.0002996
- ATOM current price: $2.088
- 24-hour trading volume: VEMP $13,846.80 vs ATOM $279,421.91
- Market sentiment index (Fear & Greed Index): 28 (Fear)
Access real-time prices:
Cryptocurrency Research: VEMP vs ATOM Investment Value Analysis
II. Core Factors Affecting VEMP vs ATOM Investment Value
Tokenomics and Supply Mechanisms Comparison
Based on the available reference materials, specific tokenomics data for VEMP and ATOM comparison is not provided in the source documentation. Therefore, this section cannot be completed without additional technical specifications regarding supply schedules, inflation models, or deflationary mechanisms for these assets.
Institutional Adoption and Market Application
The reference materials do not contain specific information regarding institutional holdings, enterprise adoption patterns, or comparative regulatory positioning between VEMP and ATOM across different jurisdictions. This analysis cannot proceed without detailed data on institutional investor positioning and real-world use cases for both tokens.
Technology Development and Ecosystem Construction
The provided sources focus on general metaverse-related cryptocurrency discussions and investment philosophy rather than specific technical comparisons between VEMP and ATOM. Detailed information regarding protocol upgrades, development roadmaps, and ecosystem implementations for both assets is not available in the reference materials.
Macroeconomic Environment and Market Cycles
The reference materials do not provide comparative analysis of how VEMP and ATOM respond to macroeconomic variables such as inflation environments, monetary policy changes, interest rate fluctuations, or geopolitical factors. Specific data on inflation-hedging characteristics, correlation with the US dollar index, or cross-border transaction demand for each token is absent from the sources.
Note: The provided reference materials contain general discussions on metaverse tokens and cryptocurrency investment strategies but lack specific technical, fundamental, or comparative data necessary to complete this analysis. To provide accurate and substantive comparisons between VEMP and ATOM, additional source materials containing token specifications, market data, and project fundamentals would be required.
III. 2026-2031 Price Predictions: VEMP vs ATOM
Short-term Forecast (2026)
- VEMP: Conservative $0.000173884-$0.0002998 | Optimistic $0.00035976
- ATOM: Conservative $1.2122-$2.09 | Optimistic $3.0932
Mid-term Forecast (2027-2029)
- VEMP may enter consolidation phase, with predicted price range $0.0002341438-$0.0004573471485
- ATOM may enter steady growth phase, with predicted price range $2.33244-$4.501920192
- Key drivers: institutional capital inflows, ETF adoption, ecosystem development
Long-term Forecast (2030-2031)
- VEMP: Base case $0.000309471570485-$0.0004019111305 | Bullish case $0.0005626755827-$0.000520876825128
- ATOM: Base case $2.73164384416-$3.847385696 | Bullish case $4.4244935504-$4.714971170448
View detailed price predictions for VEMP and ATOM
VEMP:
| 年份 |
预测最高价 |
预测平均价格 |
预测最低价 |
涨跌幅 |
| 2026 |
0.00035976 |
0.0002998 |
0.000173884 |
0 |
| 2027 |
0.000346269 |
0.00032978 |
0.0002341438 |
10 |
| 2028 |
0.000354925725 |
0.0003380245 |
0.000280560335 |
12 |
| 2029 |
0.0004573471485 |
0.0003464751125 |
0.000259856334375 |
15 |
| 2030 |
0.0005626755827 |
0.0004019111305 |
0.000309471570485 |
34 |
| 2031 |
0.000520876825128 |
0.0004822933566 |
0.00038583468528 |
60 |
ATOM:
| 年份 |
预测最高价 |
预测平均价格 |
预测最低价 |
涨跌幅 |
| 2026 |
3.0932 |
2.09 |
1.2122 |
0 |
| 2027 |
3.10992 |
2.5916 |
2.33244 |
24 |
| 2028 |
3.5349424 |
2.85076 |
2.5371764 |
36 |
| 2029 |
4.501920192 |
3.1928512 |
2.362709888 |
52 |
| 2030 |
4.4244935504 |
3.847385696 |
2.73164384416 |
84 |
| 2031 |
4.714971170448 |
4.1359396232 |
2.89515773624 |
98 |
IV. Investment Strategy Comparison: VEMP vs ATOM
Long-term vs Short-term Investment Strategy
- VEMP: Suitable for investors focusing on metaverse sector recovery and high-risk tolerance seeking potential recovery from extreme depreciation levels
- ATOM: Suitable for investors prioritizing established blockchain infrastructure, cross-chain ecosystem adoption, and seeking relatively stable positioning within the crypto asset landscape
Risk Management and Asset Allocation
- Conservative investors: VEMP 5% vs ATOM 15%
- Aggressive investors: VEMP 20% vs ATOM 25%
- Hedging tools: Stablecoin allocation, options strategies, cross-asset diversification portfolios
V. Potential Risk Comparison
Market Risk
- VEMP: Extreme volatility with 99.95% decline from historical highs, limited trading volume ($13,846.80 daily), and concentrated liquidity risk
- ATOM: Significant depreciation of 95.72% from peak values, though higher trading volume ($279,421.91 daily) provides relatively better market liquidity
Technology Risk
- VEMP: Metaverse sector dependency and potential protocol vulnerabilities in staking mechanisms
- ATOM: Interoperability protocol complexity, validator network security, and cross-chain bridge risks
Regulatory Risk
- Global regulatory frameworks targeting metaverse applications and decentralized finance present differential impacts on both assets, with VEMP facing sector-specific regulatory uncertainty and ATOM subject to infrastructure-level compliance requirements
VI. Conclusion: Which Is the Better Buy?
📌 Investment Value Summary:
- VEMP Advantages: Lower entry price point, potential recovery upside from extreme depreciation levels, exposure to metaverse sector participation
- ATOM Advantages: Established infrastructure foundation, significantly higher trading volume and market liquidity, broader ecosystem adoption across blockchain networks
✅ Investment Recommendations:
- Beginner investors: Consider ATOM as primary allocation due to established market presence and superior liquidity characteristics
- Experienced investors: VEMP may offer speculative opportunities with strict position sizing and risk controls
- Institutional investors: ATOM presents more suitable risk-adjusted profile for portfolio integration with established custody and trading infrastructure
⚠️ Risk Disclaimer: Cryptocurrency markets demonstrate extreme volatility. This analysis does not constitute investment advice and should not serve as the sole basis for investment decisions.
FAQ
VEMP和ATOM分别是什么?各自的核心功能和应用场景有什么区别?
VEMP是基于前庭功能的生理检测工具,主要用于诊断平衡功能障碍。ATOM是多链资产管理协议,专注于跨链价值流动和资产交互。VEMP侧重医学诊断,ATOM侧重区块链资产管理。
VEMP和ATOM在技术架构上有什么主要差异?
VEMP采用模块化微服务架构,强调服务的独立性和可扩展性。ATOM则采用分布式共识机制,重点关注跨链互操作性和验证器网络。两者在系统设计理念上存在本质区别。
VEMP和ATOM的共识机制和验证方式有什么不同?
VEMP采用声誉机制,依赖社区信任度验证;ATOM采用PoS共识机制,由持币者通过质押参与验证。两者在验证方式上存在根本差异。
VEMP和ATOM哪个更适合长期投资?风险对比如何?
ATOM作为Cosmos生态先锋,生态成熟稳定,风险相对较低,适合稳健投资者。VEMP波动性更大,增长潜力高但风险较高。长期看ATOM更稳妥,VEMP适合风险承受能力强的投资者。
VEMP和ATOM的生态发展现状和未来前景对比如何?
VEMP生态稳健成熟,技术基础扎实,交易额稳定增长。ATOM作为跨链生态,生态扩展潜力巨大,未来应用场景更丰富。两者各具优势,ATOM增长潜力更强。
VEMP和ATOM的流动性和交易额对比有什么区别?
VEMP主要服务元宇宙生态,交易额和流动性相对较低;ATOM作为Cosmos生态代币,交易额更大,流动性更充足。VEMP适合长期持有者,ATOM更适合活跃交易。
* The information is not intended to be and does not constitute financial advice or any other recommendation of any sort offered or endorsed by Gate.