This comprehensive guide explores cryptocurrency price volatility drivers and support-resistance level strategies for 2026 traders. The article examines how historical price patterns, compressed volatility cycles, and macroeconomic factors shape digital asset movements, using FOGO trading data as case studies. Key sections analyze support-resistance as critical decision points for entry-exit optimization and risk management through stop-loss frameworks. The guide reveals BTC-ETH correlation dynamics (0.7-0.85 range) that cascade through altcoin markets, demonstrating market interconnectedness. Recent 2026 price metrics show 11.01% daily swings and 32.23% monthly declines, creating tactical opportunities between identified levels. Traders gain actionable frameworks for technical analysis, sentiment indicators, and on-chain metrics to navigate extreme volatility. Perfect for gate exchange users seeking data-driven decision-making approaches in Q1 2026 market conditions.
Historical Price Trends and Volatility Patterns: How 2026 Market Cycles Compare to Previous Years
The cryptocurrency market in 2026 continues to exhibit cyclical patterns remarkably similar to previous years, yet with amplified volatility influenced by macroeconomic shifts and regulatory developments. Recent data reveals that price volatility remains a defining characteristic of digital assets, with tokens like FOGO experiencing a 32.23% decline over 30 days, demonstrating how volatile these markets can be during bearish phases.
Analyzing historical price trends shows that market cycles in 2026 follow recognizable patterns: rapid accumulation phases, sharp correction periods, and consolidation zones. The distinction lies in the magnitude and speed of these movements. Where previous market cycles unfolded over months, 2026 volatility patterns compress these timelines, with significant price swings occurring within 24-hour periods—exemplified by 11.01% daily movements observed in current trading data.
Support and resistance levels, derived from historical price highs and lows, become increasingly critical for traders navigating this environment. When FOGO established a 30-day high of $0.06409 and subsequently tested lows near $0.02624, these extremes created concrete barriers that influenced subsequent trading decisions. Professional traders use these historically established price points to anticipate potential reversals and set strategic entry and exit positions.
The 2026 market cycles demonstrate that while volatility patterns retain fundamental characteristics from previous years, the acceleration of price discovery and market participation through platforms like gate has intensified both the amplitude and frequency of fluctuations. Understanding these historical price trends and volatility patterns enables traders to recognize support resistance levels more effectively, ultimately informing more calculated trading decisions in an increasingly dynamic market landscape.
Support and Resistance Levels as Key Decision Points: Impact on Trading Strategy and Risk Management
Support and resistance levels function as critical psychological zones that traders use to make informed decisions about market entry and exit points. When a cryptocurrency like FOGO experiences significant price movements—such as testing the $0.06409 resistance level before declining to $0.02624 support—these levels become pivotal reference points that shape overall trading strategy.
These price zones influence trading decisions by providing clear parameters for position management. Resistance levels represent price points where selling pressure typically increases, prompting traders to consider taking profits or reducing exposure. Conversely, support levels indicate where buying interest historically emerges, making them attractive entry points for strategic accumulation. The relationship between these levels and trading strategy becomes evident when analyzing market structure—traders often build positions near support and scale out near resistance.
Risk management directly ties to how effectively traders utilize support and resistance frameworks. By setting stop-loss orders just beyond these key levels, traders can quantify and control downside exposure. For instance, a trader entering near support establishes a stop below that level, defining maximum acceptable loss before exiting. This predetermined risk framework enables position sizing calculations and portfolio-level risk assessment.
The practical impact extends to decision-making discipline. Rather than reactive trading based on emotion, support and resistance levels provide objective criteria for action. During volatile market conditions, having predetermined levels prevents impulsive decisions that often lead to losses. This structured approach transforms support and resistance from simple technical markers into comprehensive components of a systematic trading strategy that prioritizes consistent risk management and informed decision-making.
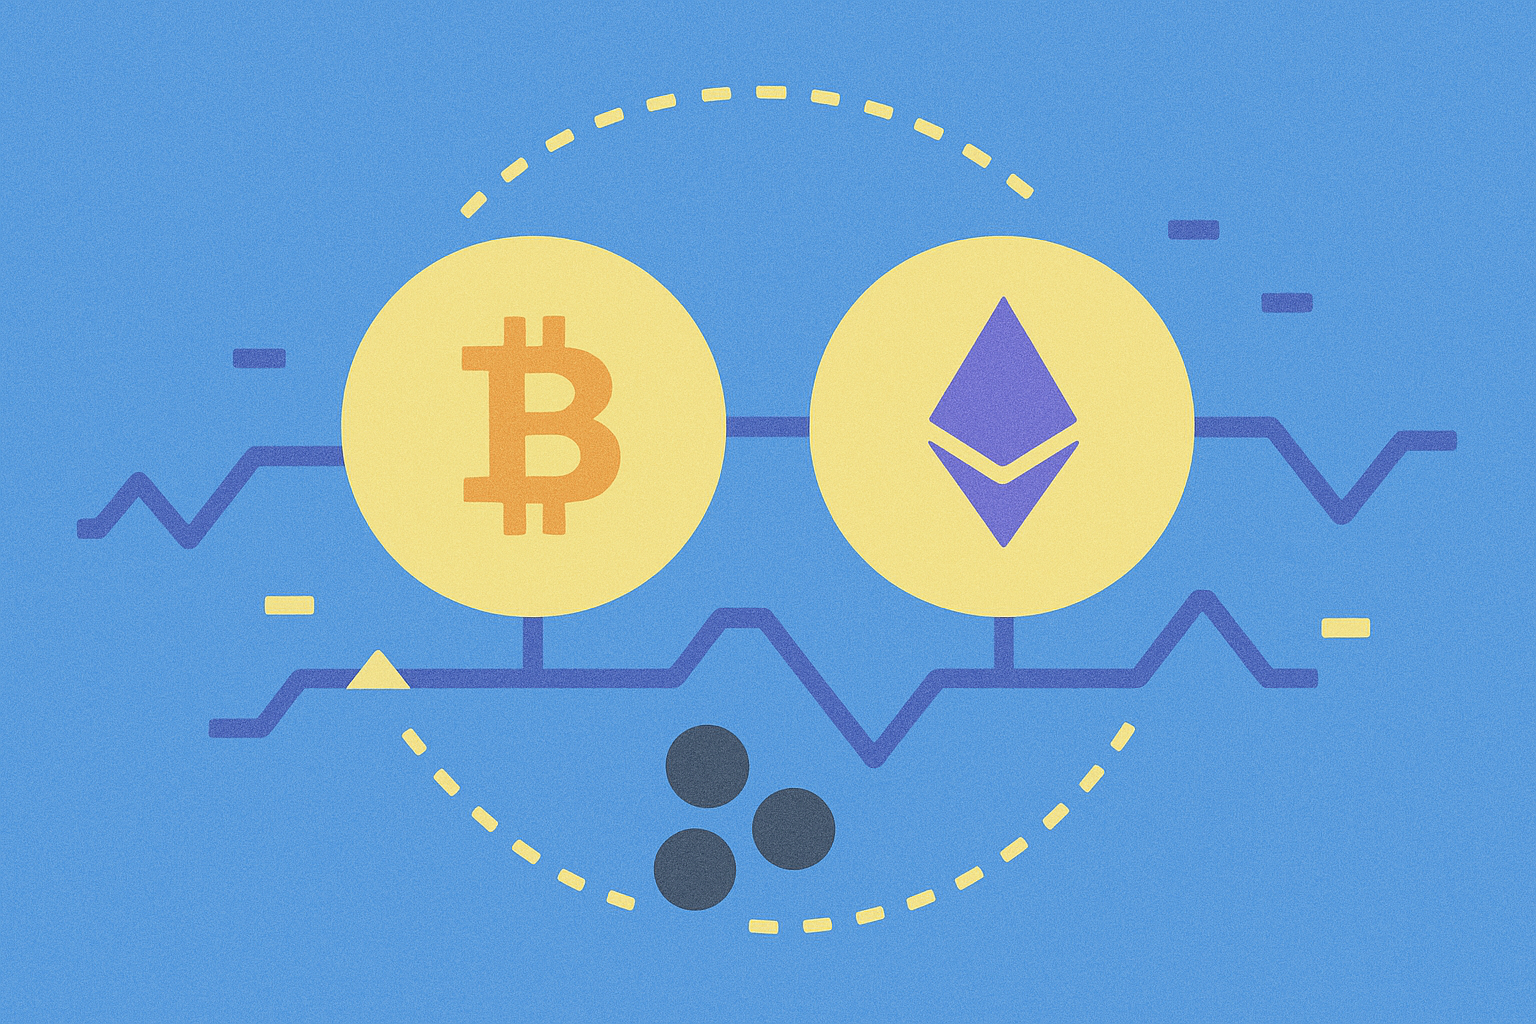
Correlation Analysis with BTC and ETH: Understanding Crypto Market Interconnectedness and Price Drivers
Bitcoin and Ethereum operate as the primary price drivers within the crypto ecosystem, with their movements directly influencing altcoin valuations and broader market sentiment. The correlation between BTC and ETH typically ranges from 0.7 to 0.85, indicating strong synchronized movement patterns that shape overall cryptocurrency volatility. When Bitcoin experiences significant price swings, this immediately impacts Ethereum and cascades through thousands of other tokens, creating systemic shifts across exchange markets.
This interconnectedness occurs because institutional investors and traders often manage Bitcoin and Ethereum as complementary positions. When major market events trigger volatility in either asset, portfolio rebalancing occurs simultaneously, pushing altcoins like smaller Layer 1 projects into similar directional movements. For example, during periods of extreme market fear—reflected in elevated VIX readings above 25—correlation coefficients between BTC and ETH strengthen further, sometimes exceeding 0.90. This heightened interdependence amplifies volatility for secondary cryptocurrencies, as capital flows rapidly between assets seeking relative stability.
Understanding these correlation dynamics proves essential for traders making decisions around support and resistance levels. When BTC approaches established resistance, traders anticipate ETH will follow similar patterns, creating predictable price consolidation zones. Conversely, breakdown scenarios in major assets trigger cascading liquidations across altcoin positions, establishing fresh support levels. The 2026 trading landscape demands recognizing that individual token price movements rarely occur in isolation—instead, they reflect broader price driver mechanics rooted in BTC-ETH market interconnectedness that continuously reshape volatility conditions and technical boundaries traders rely upon for strategic execution.
Recent Price Movements and Volatility Metrics: Trading Implications for Q1 2026
Cryptocurrency markets in early 2026 continue exhibiting significant price volatility that directly shapes trading strategy and decision-making frameworks. Fogo, a Layer 1 blockchain protocol, exemplifies current market dynamics with a 24-hour decline of 11.01% and a dramatic 32.23% monthly pullback, illustrating the volatile environment traders navigate.
Recent price movements reveal critical volatility metrics worthy of attention. The coin reached an all-time high of $0.06409 on January 15 before declining to $0.02624 just four days later—a 59% swing demonstrating extreme price discovery. Daily trading volumes have fluctuated substantially, ranging from 173 million to 638 million USDT, with higher volume periods correlating to increased price volatility.
| Period |
Price Level |
Movement |
Trading Volume |
| ATH (Jan 15) |
$0.06409 |
Peak |
432M |
| ATL (Jan 19) |
$0.02624 |
Floor |
414M |
| Current (Jan 25) |
$0.036 |
Recovery Phase |
12.3M |
These support and resistance levels create tactical trading opportunities. The $0.02624 floor established recent support, while $0.04223 represents emerging resistance. Market sentiment indicators show 50/50 split between positive and negative positioning, with the VIX reading "Extreme Fear" at 25, signaling heightened market anxiety. Understanding these volatility metrics—price ranges, volume patterns, and sentiment indicators—enables traders to anticipate potential breakouts and position accordingly for Q1 2026 market conditions.
FAQ
What are the main macroeconomic and market factors that drive cryptocurrency price volatility in 2026?
In 2026, crypto volatility is driven by Federal Reserve policy shifts, geopolitical tensions, institutional adoption waves, regulatory changes, macroeconomic inflation data, and Bitcoin halving cycles. Market sentiment, trading volume fluctuations, and correlation with traditional assets significantly impact price movements. Technology breakthroughs and enterprise integration also influence market dynamics substantially.
How do support and resistance levels help traders make better entry and exit decisions?
Support and resistance levels act as psychological price zones where buying and selling pressure concentrates. Traders use support levels to identify optimal entry points and set stop-losses below them, while resistance levels signal profitable exit opportunities. These levels help traders time entries near support for favorable risk-reward ratios and exits near resistance to lock in gains efficiently.
What role do regulatory changes and institutional adoption play in crypto price movements?
Regulatory clarity attracts institutional capital, stabilizing prices upward. Restrictive policies trigger sell-offs and volatility. Institutional adoption increases market liquidity and legitimacy, supporting sustained price appreciation. Combined effects significantly amplify crypto price cycles in 2026.
How can traders use technical analysis combined with support/resistance levels to manage risk in volatile markets?
Traders identify key support/resistance levels using technical analysis to set stop-loss orders below support and take-profit targets above resistance. This approach limits downside risk while capitalizing on price bounces, enabling better risk-reward ratios during market volatility.
What is the difference between psychological support/resistance and institutional support/resistance levels?
Psychological levels are round numbers where traders perceive value(如1000、5000). Institutional resistance reflects large-volume trading zones where major players accumulate or distribute positions. Psychological levels influence retail behavior, while institutional levels drive sustained price movements and larger trading volume.
How do market sentiment indicators and on-chain metrics predict price volatility in crypto markets?
Market sentiment indicators like fear-greed index and social volume gauge investor psychology, while on-chain metrics such as whale transactions, exchange flows, and transaction volume reveal actual trading activity. Together, they anticipate volatility spikes and price movements.
What are common mistakes traders make when relying solely on support/resistance levels for trading decisions?
Common mistakes include ignoring market context and broader trends, overestimating level reliability during strong directional moves, failing to confirm with volume analysis, and not accounting for multiple timeframe dynamics. Traders often miss that levels break during high volatility or low liquidity periods, and neglect price action signals beyond static support/resistance markers.
* The information is not intended to be and does not constitute financial advice or any other recommendation of any sort offered or endorsed by Gate.