This comprehensive comparison examines XL1 versus XTZ to help investors make informed decisions between these two distinct blockchain platforms. XL1, launched in 2025 as the utility token for XYO Layer One, offers exposure to emerging verifiable information infrastructure, while XTZ, operating since 2017, represents an established proof-of-stake network with on-chain governance. The article analyzes historical price trends, tokenomics differences, institutional adoption patterns, and technical ecosystems to evaluate investment potential. It addresses supply mechanisms, market liquidity disparities ($872K XTZ versus $5K XL1 daily volume), and macroeconomic influences shaping both assets. Through 2026-2031 price forecasting, risk assessment, and allocation strategies, this guide clarifies which asset aligns with different investor profiles. Conservative investors should favor XTZ (85-90% allocation), while experienced investors can evaluate higher XL1 exposure based on risk tolerance and infrastructure thesis c
Introduction: Investment Comparison Between XL1 and XTZ
In the cryptocurrency market, the comparison between XL1 vs XTZ has been a topic that investors cannot avoid. The two not only show significant differences in market cap ranking, application scenarios, and price performance, but also represent different crypto asset positioning.
XL1 (XL1): Launched in 2025, it has gained market recognition through its role as the utility token of XYO Layer One, bringing verifiable information on-chain and supporting decentralized applications, smart contracts, and validator rewards.
Tezos (XTZ): Since its inception in 2017, it has been recognized as a self-evolving blockchain platform, becoming one of the cryptocurrencies with substantial trading volume and market presence globally.
This article will comprehensively analyze the investment value comparison of XL1 vs XTZ around historical price trends, supply mechanisms, institutional adoption, technical ecosystem, and future forecasts, and attempt to answer the question that investors care about most:
"Which is the better buy right now?"
I. Historical Price Comparison and Current Market Status
XL1 (Coin A) and XTZ (Coin B) Historical Price Trends
- 2021: XTZ experienced notable price movements, with its all-time high of $9.12 recorded on October 4, 2021.
- 2018: XTZ saw its historical low of $0.350476 on December 7, 2018, during a broader market downturn.
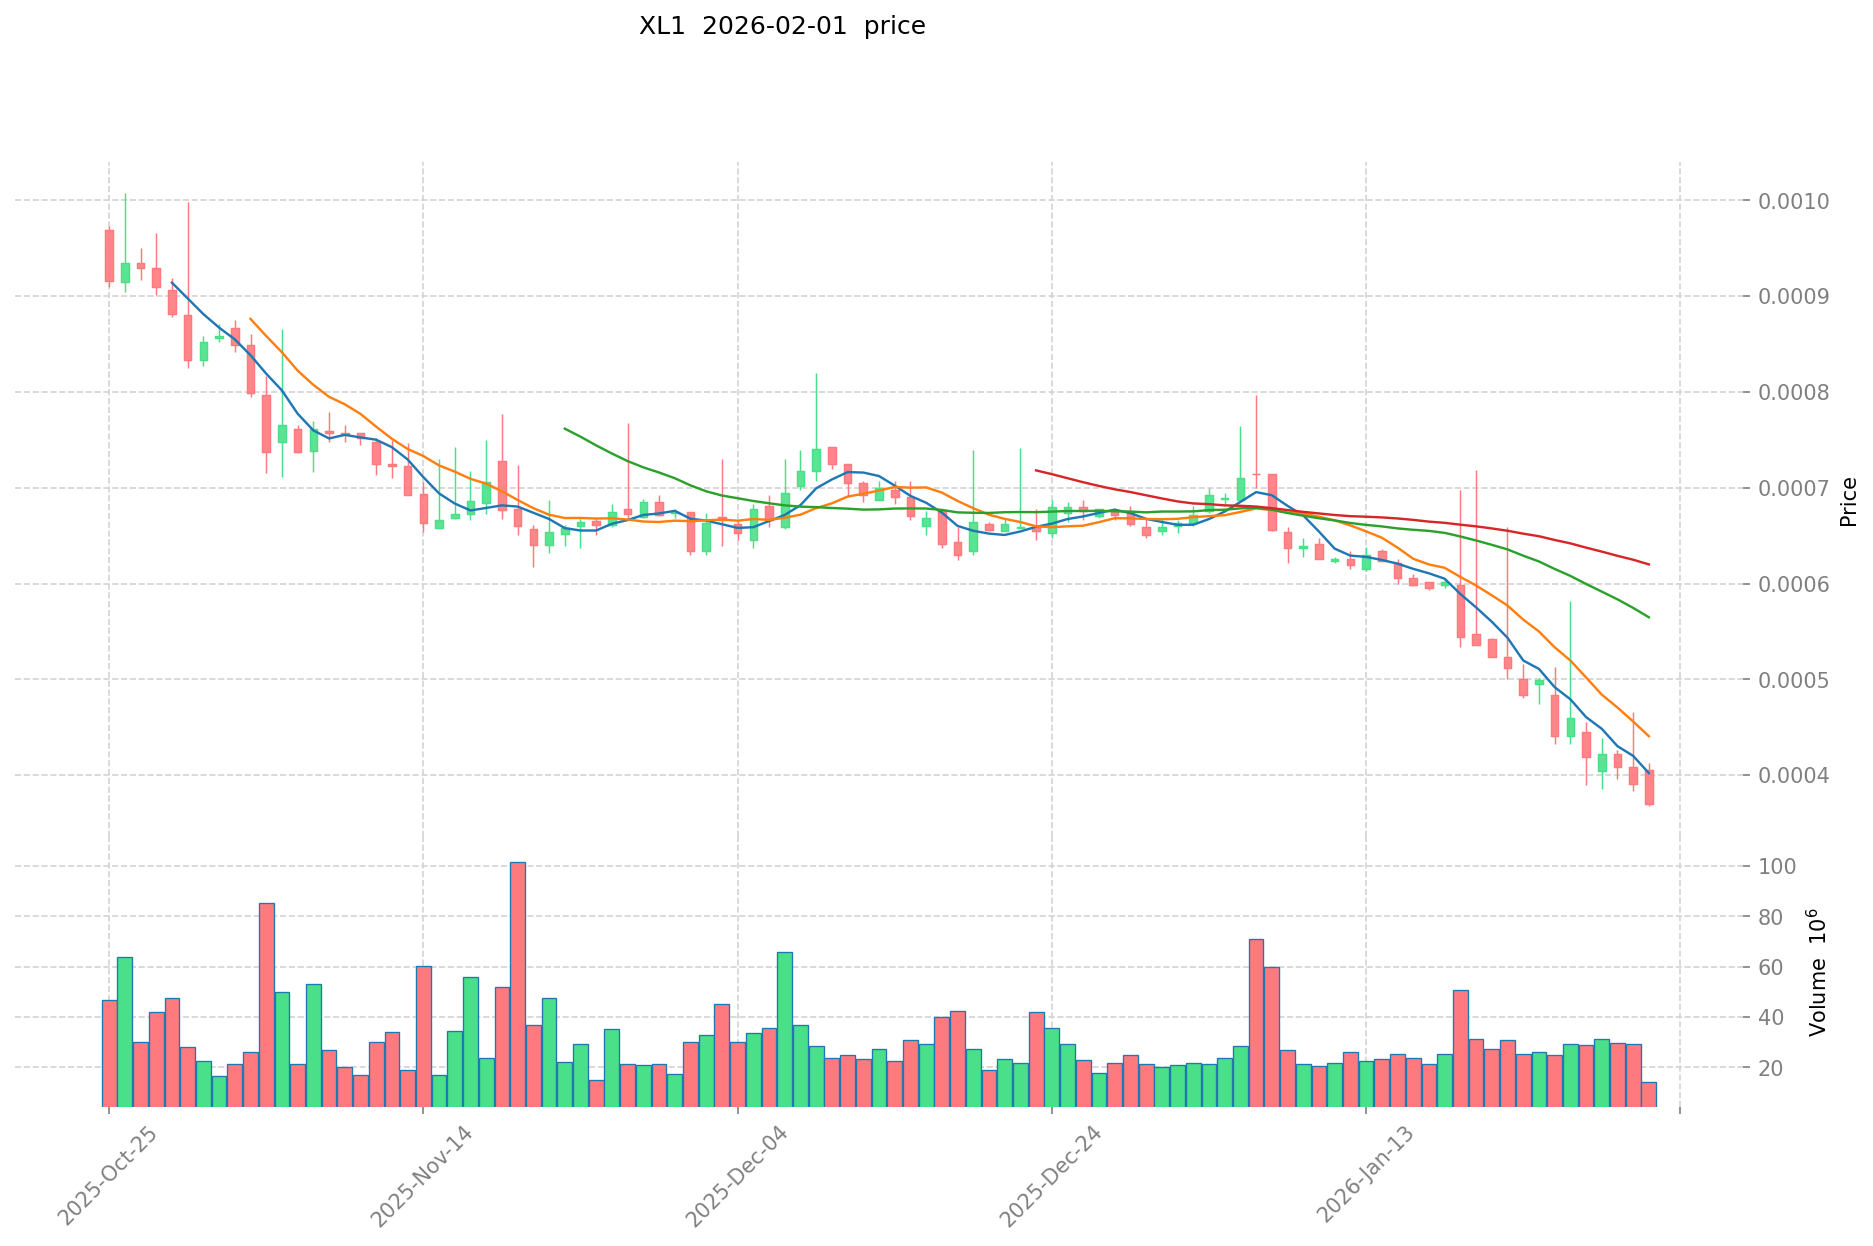
- 2025: XL1 recorded its all-time high of $0.0027985 on September 16, 2025.
- 2026: XL1 reached its all-time low of $0.0003568 on February 1, 2026.
- Comparative Analysis: During different market cycles, XTZ has demonstrated a wider price range, moving from its peak of $9.12 to a low of $0.350476, while XL1 has shown comparatively narrower fluctuations between $0.0027985 and $0.0003568.
Current Market Status (February 1, 2026)
- XL1 current price: $0.0003606
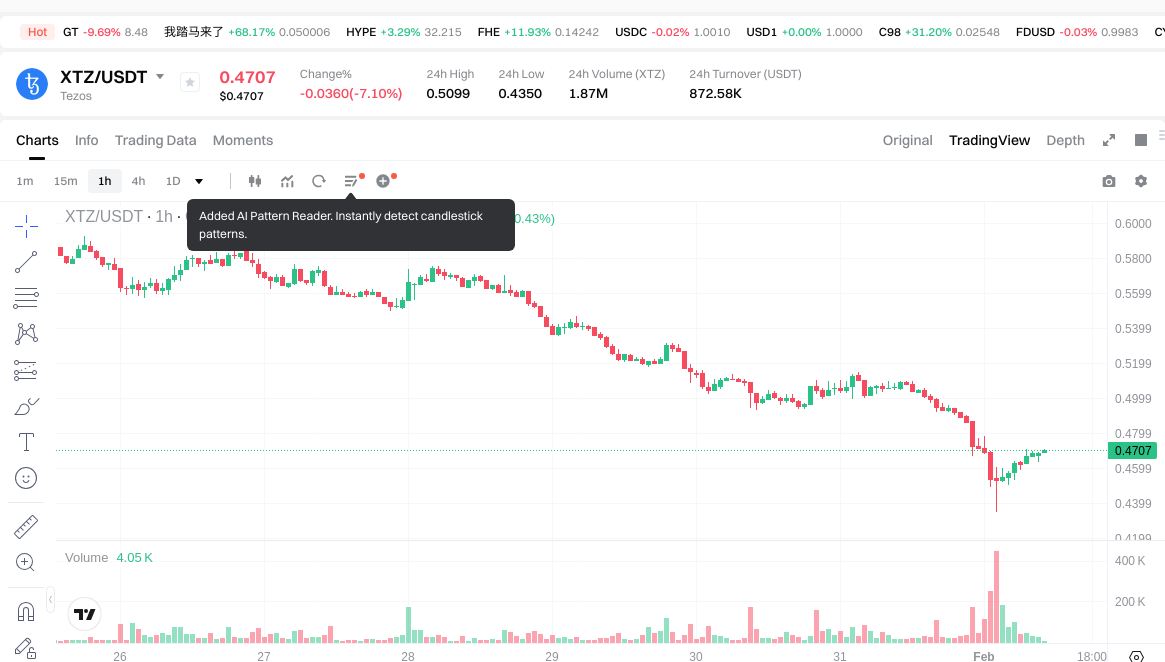
- XTZ current price: $0.469
- 24-hour trading volume: XL1 $5,119.80 vs XTZ $872,003.86
- Market Sentiment Index (Fear & Greed Index): 14 (Extreme Fear)
View real-time prices:
II. Core Factors Influencing XL1 vs XTZ Investment Value
Supply Mechanism Comparison (Tokenomics)
- XL1: The supply mechanism and distribution model may influence its scarcity characteristics, though specific tokenomics details require further verification from official sources.
- XTZ: Tezos operates with an inflationary model where new tokens are generated through the baking and staking process, with no fixed maximum supply cap.
- 📌 Historical Pattern: Supply mechanisms can create cyclical price dynamics through changes in token availability and staking incentives, though specific historical correlations vary across different market conditions.
Institutional Adoption and Market Application
- Institutional Holdings: Institutional preference patterns between XL1 and XTZ may vary based on regulatory clarity, liquidity profiles, and custody infrastructure availability.
- Enterprise Adoption: Both assets have potential applications in decentralized finance and blockchain-based solutions, though specific enterprise integration cases would require additional verification.
- National Policies: Regulatory approaches toward both assets differ across jurisdictions, with some regions providing clearer frameworks for proof-of-stake networks like Tezos.
Technology Development and Ecosystem Building
- XL1 Technology Upgrades: Specific technical roadmap details and upgrade schedules would need to be confirmed through official project communications.
- XTZ Technology Development: Tezos features on-chain governance allowing protocol upgrades without hard forks, with ongoing developments in scalability and smart contract capabilities.
- Ecosystem Comparison: Both projects participate in the broader blockchain ecosystem, with varying degrees of DeFi integration, NFT marketplace presence, and smart contract deployment activity.
Macroeconomic Conditions and Market Cycles
- Performance in Inflationary Environments: The relationship between inflation and crypto asset performance remains complex, with various factors including risk appetite, liquidity conditions, and alternative investment options playing significant roles.
- Macroeconomic Monetary Policy: Interest rate changes and dollar index movements can influence crypto market liquidity and investor positioning across different digital assets.
- Geopolitical Factors: Cross-border transaction demand and international regulatory developments may create different adoption patterns for various blockchain networks and their native tokens.
III. 2026-2031 Price Forecast: XL1 vs XTZ
Short-term Forecast (2026)
- XL1: Conservative $0.000212-$0.0003595 | Optimistic $0.0003595-$0.00037388
- XTZ: Conservative $0.39831-$0.4686 | Optimistic $0.4686-$0.637296
Mid-term Forecast (2028-2029)
- XL1 may enter a gradual expansion phase with estimated price range of $0.0002264-$0.0005698
- XTZ may enter a consolidation phase with estimated price range of $0.4004-$0.6909
- Key drivers: institutional capital flows, ETF developments, ecosystem expansion
Long-term Forecast (2030-2031)
- XL1: Baseline scenario $0.0004298-$0.0006208 | Optimistic scenario $0.0005306-$0.0007110
- XTZ: Baseline scenario $0.3676-$0.7887 | Optimistic scenario $0.6684-$0.9464
View detailed price predictions for XL1 and XTZ
Disclaimer
XL1:
| Year |
Predicted High Price |
Predicted Average Price |
Predicted Low Price |
Price Change |
| 2026 |
0.00037388 |
0.0003595 |
0.000212105 |
0 |
| 2027 |
0.0004876977 |
0.00036669 |
0.0002750175 |
1 |
| 2028 |
0.000555352005 |
0.00042719385 |
0.0002264127405 |
18 |
| 2029 |
0.0005698765959 |
0.0004912729275 |
0.000299676485775 |
36 |
| 2030 |
0.000710970180678 |
0.0005305747617 |
0.000429765556977 |
47 |
| 2031 |
0.000676641993596 |
0.000620772471189 |
0.000577318398205 |
72 |
XTZ:
| Year |
Predicted High Price |
Predicted Average Price |
Predicted Low Price |
Price Change |
| 2026 |
0.637296 |
0.4686 |
0.39831 |
0 |
| 2027 |
0.71330292 |
0.552948 |
0.53635956 |
17 |
| 2028 |
0.6584504784 |
0.63312546 |
0.5001691134 |
35 |
| 2029 |
0.690993127044 |
0.6457879692 |
0.400388540904 |
37 |
| 2030 |
0.90901114544592 |
0.668390548122 |
0.3676148014671 |
42 |
| 2031 |
0.946441016140752 |
0.78870084678396 |
0.481107516538215 |
68 |
IV. Investment Strategy Comparison: XL1 vs XTZ
Long-term vs Short-term Investment Strategies
- XL1: May appeal to investors focused on emerging blockchain infrastructure projects and utility token ecosystems, particularly those interested in data verification and oracle-related applications
- XTZ: May appeal to investors seeking exposure to established proof-of-stake networks with on-chain governance mechanisms and institutional-grade infrastructure
Risk Management and Asset Allocation
- Conservative Investors: XL1: 10-15% vs XTZ: 85-90%
- Aggressive Investors: XL1: 30-40% vs XTZ: 60-70%
- Hedging Tools: stablecoin allocation, options strategies, cross-asset portfolio diversification
V. Potential Risk Comparison
Market Risks
- XL1: Higher volatility characteristics associated with lower market capitalization assets, limited liquidity in secondary markets, and potential price sensitivity to broader crypto market conditions
- XTZ: Market risks include competition from alternative layer-1 protocols, fluctuations in staking participation rates, and correlation with broader cryptocurrency market movements
Technical Risks
- XL1: Scalability considerations for emerging infrastructure, network stability during growth phases, and smart contract security in developing ecosystems
- XTZ: Network upgrade coordination through on-chain governance, potential consensus-related vulnerabilities, and technical complexity in protocol evolution
Regulatory Risks
- Global regulatory frameworks may impact both assets differently based on their classification, with proof-of-stake mechanisms and utility token designations facing varying scrutiny across jurisdictions
VI. Conclusion: Which Is the Better Buy?
📌 Investment Value Summary:
- XL1 Advantages: Potential exposure to oracle and data verification infrastructure development, utility token model supporting decentralized applications, and positioning in emerging blockchain use cases
- XTZ Advantages: Established network with proven on-chain governance, institutional infrastructure availability, historical track record since 2017, and integration with various DeFi and NFT platforms
✅ Investment Recommendations:
- Novice Investors: Consider focusing on more established assets with greater liquidity and institutional support, maintaining diversified portfolios with appropriate risk management
- Experienced Investors: Evaluate allocation based on risk tolerance, market cycle positioning, and specific thesis around infrastructure development versus established network effects
- Institutional Investors: Assess custody solutions, regulatory clarity, liquidity profiles, and alignment with portfolio mandates when considering exposure to either asset
⚠️ Risk Disclosure: Cryptocurrency markets exhibit extreme volatility. This content does not constitute investment advice. Investors should conduct independent research and consult with qualified financial advisors before making investment decisions.
VII. FAQ
Q1: What is the main difference between XL1 and XTZ in terms of market maturity?
XTZ is a significantly more established asset with a longer track record, while XL1 is an emerging token launched in 2025. XTZ has been operational since 2017, reaching an all-time high of $9.12 in October 2021 and building substantial institutional infrastructure over its multi-year history. In contrast, XL1 recorded its all-time high of $0.0027985 in September 2025, representing a much newer market entrant with limited historical data. The current 24-hour trading volume comparison ($872,003.86 for XTZ vs $5,119.80 for XL1) further illustrates the liquidity and market depth disparity between these two assets.
Q2: How do the supply mechanisms of XL1 and XTZ differ?
XTZ operates with a clearly defined inflationary model, while XL1's tokenomics require further verification from official sources. Tezos generates new tokens through its baking and staking process without a fixed maximum supply cap, creating ongoing inflationary pressure balanced by staking incentives. This proof-of-stake mechanism allows token holders to earn rewards by participating in network validation. XL1's supply mechanism and distribution model may influence its scarcity characteristics differently, though specific details about token generation, distribution schedules, and maximum supply parameters would need confirmation from the project's official documentation.
Q3: Which asset shows better price stability based on historical data?
Neither asset demonstrates strong price stability, though they exhibit different volatility profiles. XTZ has shown wider absolute price swings, moving from a peak of $9.12 to a low of $0.350476—a range representing significant percentage fluctuations across market cycles. XL1 has traded within a narrower absolute range between $0.0027985 and $0.0003568, but this represents extreme percentage volatility given the smaller price denominations. As of February 1, 2026, the market sentiment index stands at 14 (Extreme Fear), indicating heightened uncertainty across the broader cryptocurrency market that affects both assets.
Q4: What are the key technological differences between XL1 and XTZ?
XTZ features on-chain governance allowing protocol upgrades without hard forks, while XL1 serves as the utility token for XYO Layer One focusing on verifiable information. Tezos' self-amending blockchain architecture enables the network to evolve through stakeholder voting, facilitating ongoing developments in scalability and smart contract capabilities without contentious chain splits. XL1's technology centers on bringing verifiable information on-chain and supporting decentralized applications, smart contracts, and validator rewards within the XYO ecosystem. The specific technical roadmap and upgrade schedules for XL1 would require verification through official project communications for detailed comparison.
Q5: How should conservative investors approach allocation between XL1 and XTZ?
Conservative investors should favor XTZ with an 85-90% allocation if choosing between these assets, limiting XL1 exposure to 10-15%. This recommendation reflects XTZ's established network infrastructure, greater liquidity, longer operational history, and institutional-grade custody solutions. The significantly higher trading volume and market presence of XTZ provides better exit liquidity and reduced slippage for larger positions. Conservative portfolios should also incorporate hedging tools such as stablecoin allocation, maintain diversification across multiple asset classes, and consider the extreme volatility inherent in cryptocurrency markets when determining overall crypto exposure relative to traditional investments.
Q6: What regulatory considerations affect XL1 and XTZ differently?
Both assets face varying regulatory scrutiny based on their classification and operational mechanisms across different jurisdictions. Proof-of-stake networks like Tezos have received clearer regulatory frameworks in some regions, with specific guidance regarding staking rewards and validator operations. XTZ's longer operational history has allowed it to navigate evolving regulatory landscapes and establish compliance infrastructure. XL1, as a utility token launched in 2025, faces the challenge of demonstrating clear utility distinction while navigating regulatory frameworks that continue to develop around newer token models. Global regulatory approaches differ significantly by jurisdiction, impacting custody solutions, institutional adoption pathways, and trading venue availability for both assets.
Q7: What does the 2026-2031 price forecast suggest about growth potential?
The forecasts suggest different growth trajectories, with XTZ showing higher absolute price projections but XL1 potentially offering greater percentage gains from current levels. For 2026, XL1's optimistic scenario projects $0.00037388 while XTZ projects $0.637296. By 2031, XL1's optimistic forecast reaches $0.000676641993596 with a 72% price change from 2026, while XTZ's optimistic projection reaches $0.946441016140752 with a 68% price change. However, these forecasts carry significant uncertainty and should not be interpreted as investment recommendations. Multiple factors including institutional capital flows, ecosystem expansion, technological developments, and macroeconomic conditions will influence actual price performance, which may deviate substantially from projections.
Q8: What are the primary risks specific to investing in XL1 versus XTZ?
XL1 presents higher volatility risks associated with lower market capitalization and limited liquidity, while XTZ faces competition risks from alternative layer-1 protocols. XL1's emerging status means investors face uncertainties around network stability during growth phases, smart contract security in developing ecosystems, and potential price sensitivity to broader market movements with limited historical precedent. XTZ's risks include maintaining competitive advantages against newer blockchain platforms, fluctuations in staking participation rates affecting network security, and technical complexity in coordinating protocol evolution through on-chain governance. Both assets face regulatory uncertainty, though the nature and severity of regulatory risks differ based on their respective classifications, operational histories, and jurisdictional presence.
* The information is not intended to be and does not constitute financial advice or any other recommendation of any sort offered or endorsed by Gate.