Many people think of position management as simply “how much to buy,” but a more precise definition is “how much risk you allow yourself to take under different market conditions.” When the market transitions from a steady uptrend to a range-bound phase, price volatility, liquidity depth, and capital preferences all change. If you stick to the same position management habits, you’ll often see the following outcomes:
- Reducing positions too early in a bull run—capturing the trend but missing the main profit wave.
- Chasing highs and selling lows in a sideways market—where trading fees, slippage, and stop-losses eat away at returns.
- Misusing leverage during high-volatility periods—turning short-term drawdowns into structural losses.
According to several public market reports from April 2026, there are three key variables worth your attention:
- Mainstream crypto asset ETFs have seen sustained net inflows after a phase of drawdown, signaling that medium- and long-term capital allocations remain active.
- Some volatility indicators have dropped to relatively low levels, but derivatives open interest remains high—pointing to risks of “surface calm with underlying crowding.”
- Regulatory framework discussions are moving forward—clearer policy direction is a medium-term positive, but the pace of implementation may still trigger volatility due to shifting expectations.
These signals offer clear guidance for position management: there's no need for extreme pessimism on market direction, but you must guard against the “low-volatility illusion” in execution. Here’s a practical dual-scenario framework.
Bull Run Position Management: Offense First, but Set a Drawdown Limit
The core challenge in a bull run isn’t “can’t buy”—it’s “can’t hold when prices rise, and panic when they drop.” Use a “core position + flexible position” structure:
Execution steps:
-
Define your core position range.
Core positions are for high-liquidity, high-consensus assets—recommended at 40%–70% of total capital, adjusted to your risk tolerance. Don’t frequently adjust your core position based on short-term noise.
-
Define your flexible position.
Flexible positions are for increasing exposure after trend confirmation and rotating into hot sectors—recommended at 10%–30%. The goal isn’t long-term holding, but maximizing capital efficiency.
-
Set a drawdown red line for bull runs.
Even in a bull market, if your portfolio’s NAV drops 8%–12% from its local high, trigger deleveraging or reduce your position. The biggest risk in a bull run isn’t a decline—it’s assuming every dip will V-shape rebound.
-
Add to positions in batches, not all at once.
A common approach: add 40% after trend confirmation, 30% on a key breakout, and 30% if a pullback holds. This reduces single-entry errors.
-
Use a “laddered” approach for take-profit—don’t exit all at once.
Design take-profit in three tiers, such as reducing by 20%, 30%, and 50% as floating profit hits target zones, so you don’t miss the main profit wave.
Bull run disorder risk checklist:
- Treating floating profit as an “infinite drawdown buffer.”
- Using short-term volatility to dismiss long-term trends.
- Increasing leverage after consecutive gains, only to see a sudden drop wipe out weeks of profits.
Range-Bound Market Position Management: Defense First, Returns Come from Timing
The most common mistake in a sideways market is trying to catch every trend—resulting in constant chasing and reversals. In sideways markets, shift from “directional bets” to “probability within the range.”
-
Lower your overall position cap.
If there’s no clear trend breakout, keep your total position at 30%–50%. Preserve cash and stable assets for flexibility, and wait for high-probability setups.
-
Reduce risk per trade.
Keep maximum loss per trade to 0.5%–1.0% of your total capital. Sideways markets mean more trades—each loss must stay small.
-
Use “sell high, buy low + rapid validation.”
Test near the lower range and stop out if it breaks; take profit in batches near the upper range. Don’t aim to capture the whole move—focus on steady, positive expectancy.
-
Reduce simultaneous holdings of highly correlated assets.
What looks like diversification may just be concentrated risk. In sideways markets, lower correlation is more important than adding more assets.
-
Strictly control trading frequency.
No new signals, no trades. In sideways markets, the biggest threat is overtrading.
Range-bound disorder checklist:
- Review performance weekly—track win rate, P/L ratio, and max consecutive losses.
- After three consecutive losses, automatically reduce positions by 30%.
- If weekly drawdown exceeds 3%, pause active trading for 48 hours.
Universal Risk Budget Model for All Market Conditions
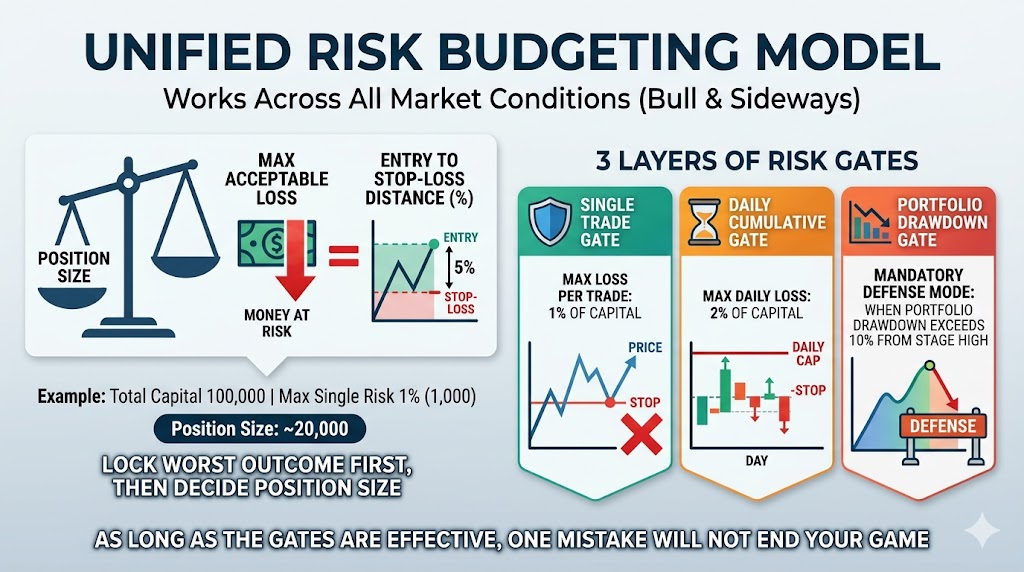
No matter the market, unified risk language is essential. Use this simple model: Position size = Acceptable loss ÷ Price distance from entry to stop-loss.
Example: With $100,000 in capital and a 1% risk budget per trade ($1,000), if the entry-to-stop-loss distance is 5%, the notional position is $20,000. This approach locks in your worst-case outcome before you size your position.
Set three layers of risk gates:
- Single-trade gate: No more than 1% capital loss per trade.
- Daily gate: No more than 2% capital loss per day.
- Portfolio gate: If drawdown from the local high exceeds 10%, switch to defense mode.
With these gates, a single mistake can’t wipe you out.
How to Dynamically Adjust Positions with the Latest Market Signals
The current market is a mix of “capital inflow, compressed volatility, and policy uncertainty.” In practice, use a “neutral-to-offensive” switching strategy:
Action template:
- Keep core positions steady—avoid drastic cuts.
- Use flexible positions only for confirmed signals—don’t bet big ahead of news.
- Increase take-profit frequency, tighten stop-losses, and prioritize a smooth equity curve.
- Before major data or policy events, proactively reduce leverage and exposure to high-volatility assets.
The goal isn’t to catch every move—it’s to stay consistently profitable as uncertainty increases.
Common Mistakes and How to Fix Them
Mistake 1: Always go all-in during a bull run.
Correction: Higher positions are justified in a bull run, but only with clear drawdown limits and staged reductions. All-in is not a strategy—it’s just exposure.
Mistake 2: In sideways markets, just trade more to recover losses.
Correction: The real risk is high-frequency, low-quality trades. Improve signal quality before increasing trade count.
Mistake 3: Doubling down after losses will help you recover faster.
Correction: Only add to positions when structure improves—not out of frustration. Averaging down against the trend turns small losses into big ones.
Mistake 4: Stop-loss means you were wrong—better to hold on.
Correction: Stop-loss is a trading cost, not a personal failing. Without stop-losses, your system will eventually spiral out of control.
Mistake 5: Position management reduces returns.
Correction: It does reduce “one-off windfalls,” but dramatically improves “long-term compounding sustainability.”
Day 1: Review all positions and reclassify as core, flexible, or watchlist.
Day 2: Set stop-loss, take-profit, and invalidation criteria for each position.
Day 3: Standardize risk per trade to 1% or less—reduce any that exceed this.
Day 4: Eliminate trades with unclear logic—keep only high-certainty setups.
Day 5: Review your last 20 trades—calculate actual P/L ratio and win rate.
Day 6: Decide on bull run or range-bound mode based on market conditions.
Day 7: Finalize your execution checklist—trade by the list next week without changing rules on the fly.
Conclusion
Position management isn’t about “winning every time.” It’s about “losing small, surviving, and being ready for the big opportunities.” In a bull market, focus on amplifying profits while avoiding one-off drawdowns; in sideways markets, cut ineffective trades and protect your principal. With the latest April 2026 market signals, a flexible position approach is more effective than a fixed stance: increase risk budget when trends are clear, reduce exposure and raise cash when the outlook is uncertain. Write your risk rules first, then turn them into disciplined execution—only then will your performance curve truly stabilize.
Risk Reminder
This content is for market information sharing and strategy discussion only and does not constitute investment, legal, or tax advice. Crypto asset prices are highly volatile, and liquidity and policy environments can change rapidly, creating a risk of partial or total principal loss. The position management frameworks, case parameters, and scenario assumptions discussed here do not guarantee future returns or drawdown control, nor do they constitute recommendations to buy or sell any asset. Make independent decisions based on your risk tolerance, investment horizon, and cash flow. Before using leverage, futures, or high-volatility assets, conduct small-scale tests first, and set stop-losses, position limits, and maximum drawdown thresholds.