Net Bitcoin Inflow to Exchanges: A Clear Explanation
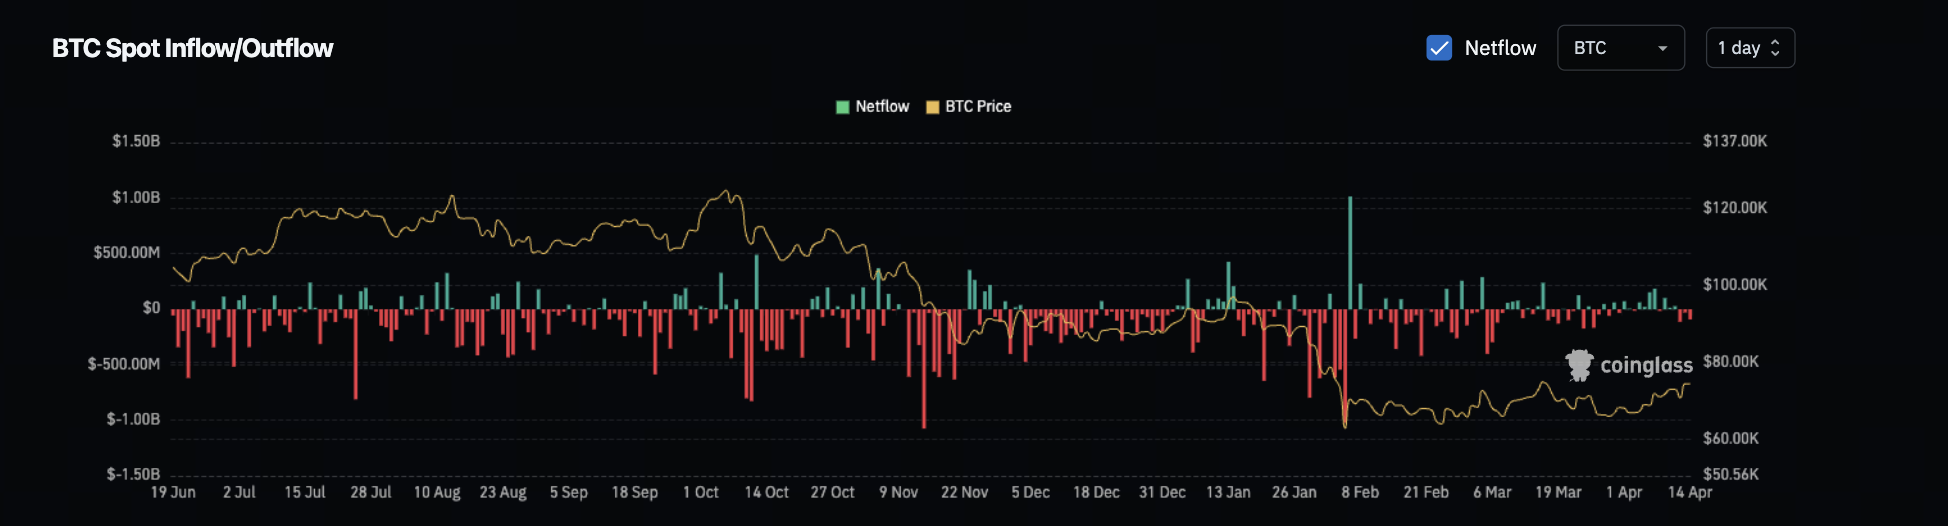
Image source: Coinglass
The term “net Bitcoin inflow to exchanges” refers to a simple calculation: Net inflow = BTC entering exchanges - BTC leaving exchanges.
A positive net inflow means more BTC is moving into exchange wallets than out; a negative net inflow means more BTC is leaving exchanges.
There are three common misconceptions:
-
Net inflow equals immediate selling: Incorrect. Moving BTC to exchanges means holders have the ability to sell, but it does not mean selling occurs instantly.
-
Larger net inflow always means faster price drops: Not always. If strong bids are present, net inflow may only cause price consolidation at higher levels, not a downward trend.
-
Net inflow only reflects retail investor activity: False. Institutional rebalancing, market maker inventory management, and arbitrage across exchanges all contribute to net inflow signals.
In summary, net inflow is a “conditional signal,” not a “conclusive signal.”
Why Net Inflow Affects Price: Three Transmission Mechanisms

Understanding net inflow is about recognizing its mechanisms, not just the numbers. Net inflow impacts the market through three main channels:
1. Supply Mechanism: Increase in Sellable BTC
When BTC moves from cold wallets or long-term addresses to exchanges, the market’s “immediately sellable supply” rises.
If there aren’t enough new bids at the same time, prices are more likely to experience a drawdown. That’s why net inflow is considered a “potential sell pressure signal.”
2. Sentiment Mechanism: Market Expectations Drive Action
Many traders treat large net inflow as a risk signal, reducing leverage or positions proactively.
Sometimes, price declines happen not because of “actual selling,” but because “market participants expect selling.”
3. Leverage Mechanism: Derivatives Amplify Volatility
When net inflow occurs in a high leverage environment, spot selling pressure can trigger cascading liquidations, increasing volatility.
In these cases, price action is not a smooth pullback but a “plunge - rebound - retest” pattern marked by high volatility.
The Same Net Inflow Means Different Things in Different Market Cycles
Many analysis errors stem from ignoring the market cycle—not from the indicator itself.
1. Early to Mid Bull Run: Net Inflow Often Signals “Healthy Rotation”
In uptrends, net inflow may reflect:
-
Profit-taking at certain stages
-
Capital rotating from BTC to ETH or Altcoins
-
Large investors rebalancing, not exiting the market
This kind of net inflow often leads to “drawdowns within an uptrend” and does not necessarily disrupt the main trend.
2. Late Bull Run: Net Inflow Aligns with Distribution
When the market is in a high valuation, high leverage, and high consensus phase, continuous net inflow is more likely to signal systematic distribution.
If high trading volume is accompanied by weak rebounds, it’s often a sign of rising risk.
3. Bear Market or Weak Rebound: Net Inflow Has Greater Impact
In weak markets with thin bids, net inflow is more likely to translate directly into price pressure.
Especially during periods of tight macro liquidity, net inflow often shifts from a “warning” to a “realized risk.”
Why Focusing Only on Net Inflow Can Lead to Misjudgments
Focusing on a single chart almost always leads to being misled by noise. The four most common “false signals” in net inflow are:
-
Internal transfer noise: Internal transfers between exchange hot and cold wallets distort short-term data.
-
Tagging errors: Delayed updates in address attribution skew inflow statistics.
-
Cross-platform rebalancing: Transfers from Exchange A to Exchange B do not increase overall sell pressure.
-
Time granularity trap: Unusual hourly moves may be operational, not trend signals.
Therefore, net inflow is best analyzed over a 24 h - 7 d continuous period, not as isolated spikes.
Practical Framework: Net Inflow Must Be Combined with These Indicators
To make net inflow actionable, use at least a “1 + 4 linkage” approach:
-
Core indicator: BTC net inflow / net outflow
-
Supporting indicators:
-
Total exchange reserves trend (is inventory rising or falling)
-
Stablecoin net inflow (is buying power entering)
-
Funding rate and open interest (is leverage overheating)
-
Long-term holder behavior (is there sustained distribution)
Use the following decision matrix for quick assessment:
-
Net inflow rising + exchange reserves rising + no stablecoin increase
Conclusion: Elevated sell pressure risk; adopt a defensive stance.
-
Net inflow rising + stablecoin inflow + healthy spot trading
Conclusion: Indicates rotation, not necessarily a bearish turn.
-
Net inflow falling + exchange reserves falling + LTH holding
Conclusion: Supply contraction; medium-term positive.
High-Value Scenarios and Strategic Responses
Scenario A: Large Single-Day Net Inflow, but Price Holds
This usually signals strong absorption or that not all sell pressure has been released. Do not short immediately; instead, observe whether net inflow continues over the next 48 - 72 hours.
Scenario B: Multiple Days of Net Inflow, with Weaker Rebounds
This is a classic sign of structural weakening. If this coincides with elevated OI and funding rates that later decline, it’s time to reduce aggressive positions.
Scenario C: Price Drops but Net Inflow Remains Low
This suggests the drop is likely driven by leverage reduction rather than spot selling.
If net inflow does not increase afterward, the market is more likely to see a technical rebound.
Conclusion: Net Inflow Is a Thermometer, Not a Steering Wheel
The primary value of net Bitcoin inflow to exchanges is not to predict whether prices will rise or fall tomorrow, but to signal shifts in market risk appetite.
It’s a highly sensitive indicator, but it must be used alongside other metrics.
In summary:
Analyzing net inflow together with reserves, stablecoin flows, leverage, and long-term holder behavior upgrades your view from “sentiment-based” to “evidence-based.” This is how on-chain analysis truly enhances your win rate.