According to on-chain data from Glassnode, XRP is showing two major historical rebound indicators simultaneously: the MVRV Z-Score indicates XRP trading prices are below fair value, and the realized profit/loss ratio is approaching the critical level of 1.0. Since early February, XRP has been trapped in a converging symmetrical triangle pattern, with the apex gradually approaching. The market direction may become clearer soon.
Analysis of Two Major On-Chain Bottom Signals
MVRV Z-Score: Below Fair Value Threshold
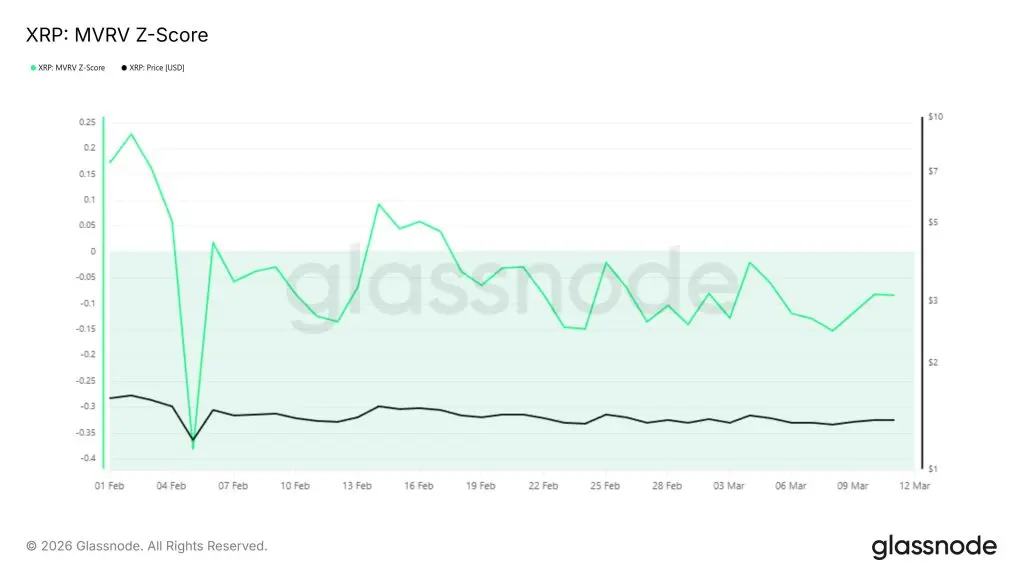 (Source: Glassnode)
The MVRV Z-Score is a widely recognized on-chain valuation tool in the cryptocurrency space. Current data shows XRP’s trading price is below its fair value threshold. According to Glassnode’s historical data, this phenomenon has occurred before several major rebounds and is considered by some on-chain analysts as a potential sign that the asset is undervalued.
Realized Profit/Loss Ratio Approaching 1.0
The realized profit/loss ratio is nearing the critical level of 1.0, meaning the number of loss-making trades is nearly equal to profitable trades. Analysts point out that historically, when this ratio falls below 1.0 on the 90-day moving average and confirms a crossover, it often marks one of the most reliable starting points for XRP’s sustained recovery, rather than just a short-term rebound.
Technical Structure: Key Support and Resistance in Symmetrical Triangle
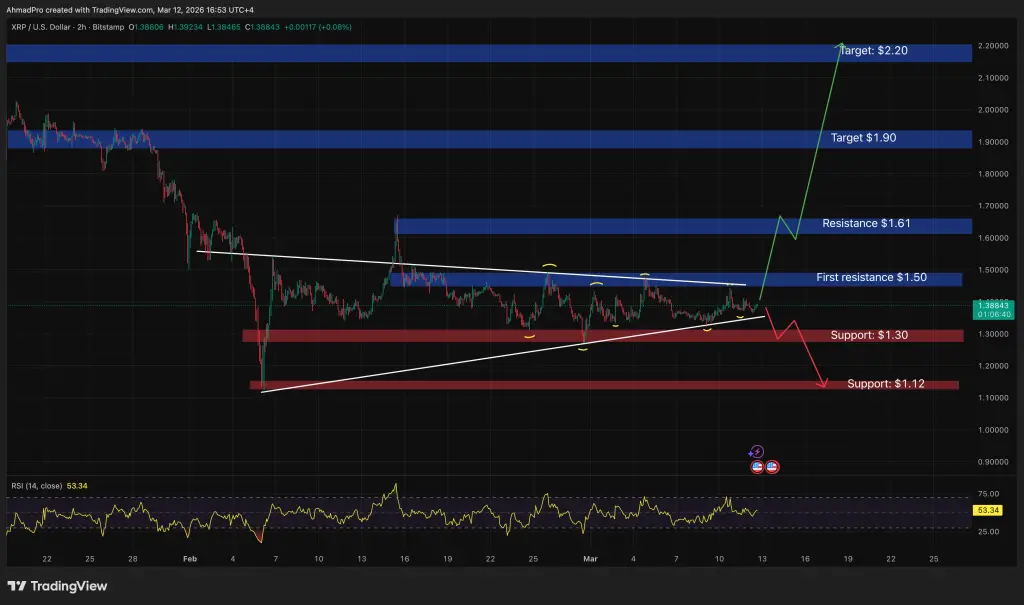 (Source: TradingView)
On the 2-hour chart, XRP has been consolidating within a converging symmetrical triangle pattern since early February. The apex is approaching, and a breakout may occur soon. Here are the current key technical levels:
- First Resistance: $1.50 — the core resistance zone during the consolidation, multiple attempts to break higher have been blocked
- Second Resistance: $1.61 — next target if $1.50 resistance is broken
- Technical Target (if both resistances are broken): $1.90, with further attention to $2.20
- Immediate Support: $1.30 — tested multiple times within the triangle and held
- Lower Support: $1.12 — if $1.30 support fails, this is the next reference level
A symmetrical triangle reflects a temporary balance between bulls and bears. The breakout direction is uncertain and will depend on market confirmation. The daily convergence indicates the market is approaching a decision point, but the final direction depends on the ultimate battle of market forces.
Frequently Asked Questions
What does the bottom signal of XRP’s MVRV Z-Score mean?
The MVRV Z-Score measures the deviation of the market value of an asset relative to its realized value on-chain. Currently, XRP’s trading price is below its fair value threshold. Historically, according to Glassnode data, this condition has appeared before several major rebounds and is viewed by some analysts as a potential undervaluation signal. However, past performance does not guarantee future results.
What does the symmetrical triangle pattern mean for XRP?
The symmetrical triangle indicates a temporary equilibrium between bullish and bearish forces within a converging range. Since early February, XRP has been forming this pattern, which is approaching its apex. Usually, this suggests a breakout in a clear direction may occur soon. The key resistance is at $1.50, and support is at $1.30. The breakout direction will determine the subsequent trend.
What does the current XRP realized profit/loss ratio signal indicate?
The ratio approaching 1.0 means that the number of loss-making trades is close to the number of profitable trades. Historically, when this ratio falls below 1.0 on the 90-day moving average and confirms a crossover, it has often marked the start of a sustained recovery for XRP. This is based on historical statistical observation and does not guarantee future performance.
Disclaimer: The information on this page may come from third parties and does not represent the views or opinions of Gate. The content displayed on this page is for reference only and does not constitute any financial, investment, or legal advice. Gate does not guarantee the accuracy or completeness of the information and shall not be liable for any losses arising from the use of this information. Virtual asset investments carry high risks and are subject to significant price volatility. You may lose all of your invested principal. Please fully understand the relevant risks and make prudent decisions based on your own financial situation and risk tolerance. For details, please refer to
Disclaimer.