Author: Changan I Biteye Content Team
Weather is not like an election; it has no stance. Unlike the NBA, it has no home team. But it’s this market that keeps domestic users coming in. The reason is simple: everyone has feelings, everyone thinks they understand Shanghai’s weather.
But “feeling like you understand” and “being able to make money” are two different things.
Biteye today shares three things:
- Understanding the settlement rules
- Building a weather prediction method
- Using systems to find trading opportunities others can’t see
1. First, clarify: How exactly is this weather market settled?
1. The temperature used for settlement isn’t what you think
Many newcomers have a misconception: they compare the highest temperature forecast with their phone weather app. But the app shows the temperature of downtown Shanghai, while Polymarket’s settlement uses the actual measured data from Shanghai Pudong Airport (ZSPD weather station). This data is publicly available through Wunderground, an American weather platform, and PM directly reads the records from WU as the basis for settlement.
Two places, two numbers. Pudong Airport is located on the east side of the city, near the Yangtze River estuary, affected by sea breezes, so its temperature is usually lower than the city center. This difference isn’t noticeable normally, but at boundary points, it can be the difference between a correct and incorrect bet.
So in the weather market comment sections, you might see confusion like: “It feels warmer today than yesterday, why is the displayed high temperature actually lower?”
2. The numbers are correct, but the units aren’t what you expect
WU’s data comes directly from hourly METAR reports (the international aviation weather reports).
A detail here: METAR reports temperatures in Fahrenheit as integers, and WU displays this number directly, without conversion or correction.
Most weather forecast systems and meteorological models output temperatures with decimals. The more refined your model, the more likely you are to overlook this rough detail.
3. Shanghai temperature patterns
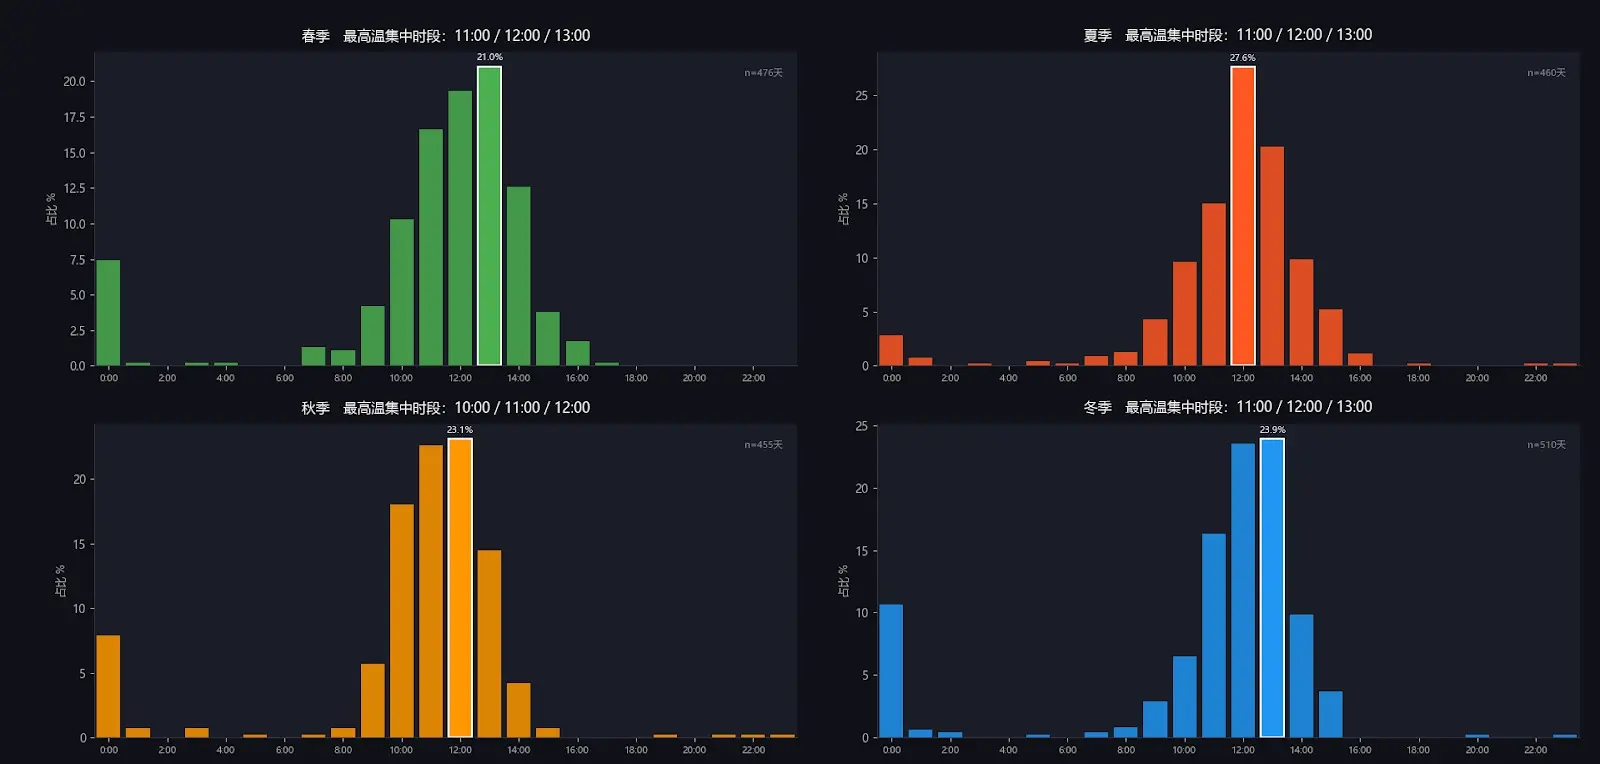
After analyzing nearly 1900 days of data from ZSPD, the timing of the highest temperatures in Shanghai is more concentrated than expected:
- Highly concentrated between 11:00-13:00 across all four seasons
- Summer peaks at 12:00, accounting for 27.6% of the season’s highest temperatures
- Autumn peaks slightly earlier, with 10:00 also being a high-frequency period
Knowing the pattern is the first step, but patterns don’t watch the market themselves. You need to know when the highest temperature occurs, whether it’s been broken, and how far it is from the boundary.
So I built this system: before daily settlement, predict as accurately as possible which temperature range the highest temperature of the day will fall into.
2. Five methods, three of which are operational
After understanding the market rules, the next question is: how to predict the day’s highest temperature?
As a weather novice, the first step was to ask ChatGPT: how does the meteorological industry calculate the highest temperature of the day? What are the mature methods? ChatGPT provided a theoretical framework, which Claude turned into code. Two AIs working together, built the system over a weekend.
We tried five methods in total, and only three worked.
The successful ones:
1️⃣ WC + ECMWF ensemble forecast
Predicting the highest temperature requires data. We used two sources:
- Weather Company (WC): a commercial weather API providing hourly forecast data with high accuracy
- ECMWF: the European Centre for Medium-Range Weather Forecasts, sensitive to large-scale weather systems
Each has advantages and disadvantages, so we weighted their predictions. The weights are dynamically adjusted based on the day’s weather type: on sunny days, more trust in WC; on cloudy or windy days, more trust in ECMWF.
2️⃣ Real-time correction: estimating peak temperature from warming data
Forecasts are made last night, but today’s weather keeps changing. This module uses the measured data from this morning to estimate the maximum temperature for today.
The logic is simple: Shanghai’s temperature rises fastest between 8-9 am. Once the system gets the measured temperature at this time, it looks at historical data: in the same season and at the same time, how much more can the temperature rise on average?
Then apply two corrections:
- If cloud cover is heavy, multiply by a discount factor; thicker clouds hinder warming.
- If wind is strong, multiply by another discount; strong winds accelerate heat loss. This gives an “extrapolated estimate.”
Pressure, dew point, humidity are also considered, but after backtesting, they showed minimal impact and low correlation, so they were removed.
But relying solely on extrapolation isn’t stable enough. Here, a Kalman gain concept is used—essentially, taking a weighted average between the “extrapolated result” and the “original forecast,” with the weight automatically adjusting over time:
- 6 am: extrapolation accounts for only 20%, mostly trusting the forecast
- 12 pm: extrapolation accounts for 72%
- After 1 pm: almost fully trust the measured data, at 85%
The later in the day, the more important current observations; the earlier, the more the historical forecast matters.
After 2 pm, the system judges that the peak has likely passed and directly locks in today’s maximum temperature from historical records, no longer extrapolating.
3️⃣ Is today a warming day?
This is the most satisfying module: every morning at 2-4 am, the system makes a judgment: will today’s maximum temperature be higher than yesterday’s?
It collects weather data during this window:
- Changes in pressure over the past 3 and 12 hours
- Wind direction and speed at dawn, cloud cover
- Yesterday’s temperature change, temperature trend over the past three days, whether yesterday was relatively high or low
- Month, season, day of the year, whether it rained yesterday
The model outputs five categories: warming day, slightly warming, stable, slightly cooling, cooling day, with confidence levels.
However, accuracy varies by season:
- Most accurate in winter: cold air arrives, pressure rises sharply, north winds strengthen—signals are very clear
- Worst in autumn: repeated warm and cold air masses, temperature rises today then falls tomorrow—regular patterns break down fastest
Methods eliminated:
- Fourier analysis for numerical prediction
Initially tried fitting historical temperature cycles with Fourier analysis to predict the day’s maximum temperature.
Result: it only tells you “the average temperature for this season historically,” which is too smooth. Shanghai’s weather is highly stochastic; Fourier fit produces a smooth average curve, not daily fluctuations. Error was about 3.6°C, with systematic underestimation, so it was discarded.
- ERA5 peak time prediction
ERA5 is a global reanalysis dataset from the European Climate Center, used to predict when the maximum temperature occurs.
Backtesting showed:
- Within 1 hour accuracy: 59.6%
- Within 2 hours: 81.3%
It sounds decent, but Polymarket’s precision is higher, with a very short decision window. If you can’t predict the peak within half an hour, it’s less useful than just looking at PM data, so this method was eliminated.
3. Practical system: two case studies and reflections
Polymarket’s weather market opens trading 4 days in advance, and popular temperature ranges are usually well priced early on. Betting on high-probability ranges yields poor risk-reward.
So my strategy is: wait for signals, wait for the warming period, then enter.
Based on the self-built weather system, I took these two actions:
Case 1:
Early morning on the 16th, a Telegram channel pushed a night-mode report: “Tomorrow is a cooling day.” The reason was that the evening cloud cover was heavy, and both seasonal and intra-year features pointed to cooling.
At that moment, I didn’t bet immediately. The early morning signal was just a first-layer reference. 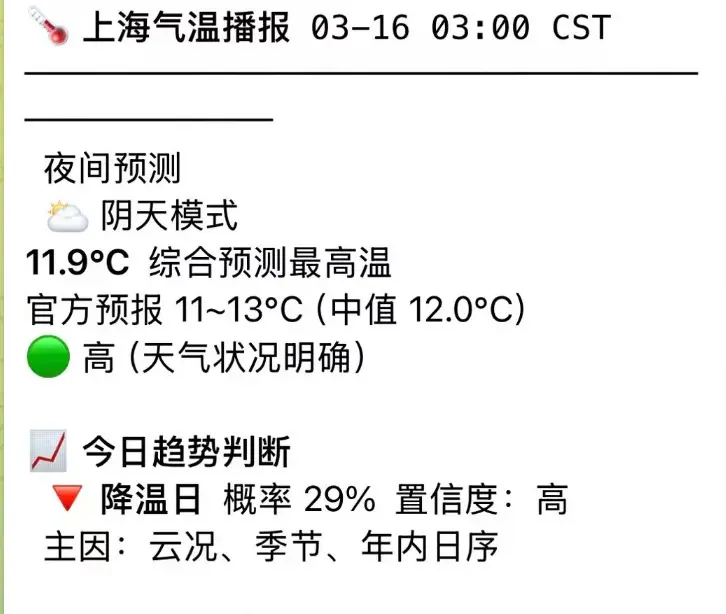
By 11 am, the system issued a real-time report during the warming period. The measured maximum temperature had already reached 12°C, and the probability score for another 1°C increase was 42%, leaning towards no further warming.
Combining this with the early logistic regression’s cooling signal, both modules agreed. The signal was much clearer now. So I bet that the maximum temperature on the 16th would not exceed 13°C.
Settlement that day: 12°C. The previous day, the 15th, was 15°C—a full 3-degree drop. 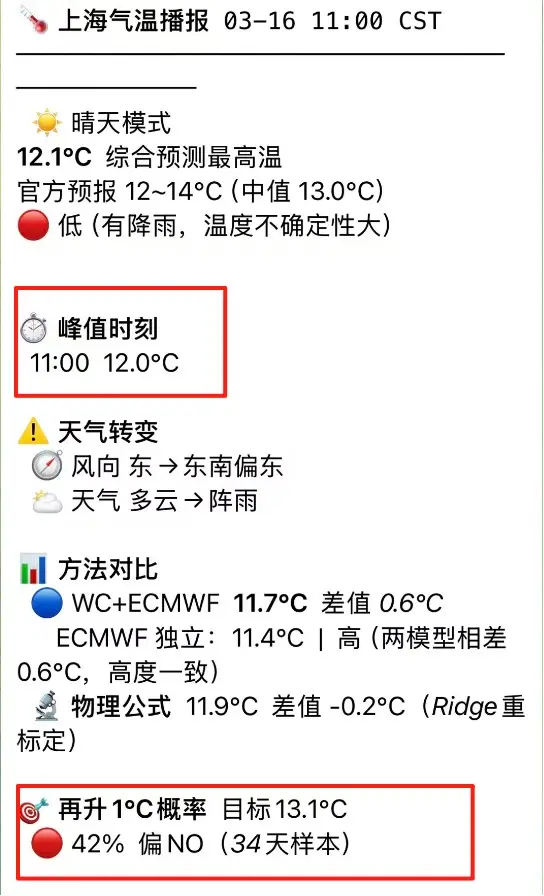
Case 2:
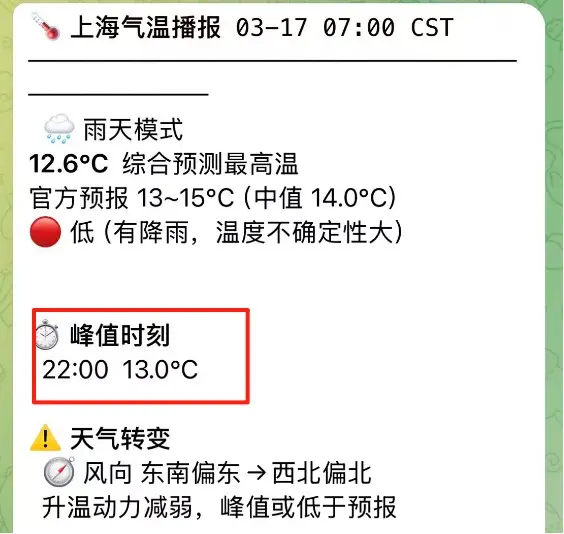
Another example: today, the 17th, Shanghai’s weather system also provided early warning: the peak time was unusual—at 22:00.
Normally, on a sunny day, the highest temperature occurs between 1-3 pm, but today’s peak was at 10 pm, indicating it’s not due to sunlight warming but warm, moist airflow transporting heat at night. It rained all day, cloud cover was 97-100%, almost no sunlight.
At this point, I checked Polymarket, where the 12°C price was still at 53%. Some community members were confused: it’s already afternoon, the temperature is only 11°C, the usual peak time has passed, why are people still betting on 12°C?
This confusion stems from using clear-sky logic to judge a rainy market.
The system isn’t confused. It identified the day’s weather type early in the morning, and with the peak time being abnormal, there’s a significant discrepancy between current temperature and market expectation. This is an information gap—and an opportunity.
That’s the purpose of this system: to make opportunities easier to spot and risks to be warned of faster.
System shortcomings
A weekend’s worth of development means inevitable flaws:
- Autumn accuracy is only 63.7%, close to a coin flip. The repeated tug-of-war between warm and cold air masses in this season makes historical patterns unreliable.
- Air pressure features are unavailable in live trading. During training, pressure change was a useful feature with good backtest results—signals of cold air passage are clear. But in live operation, current interfaces don’t provide real-time pressure data.
- Coastal corrections are pending data activation. The effect of sea breezes at Pudong Airport is real, and the system has a correction module, but the sample size is still small.
Running this system over a weekend revealed these issues, which is valuable. I’ll keep refining as I go.
Conclusion
Meteorology has developed over centuries, using satellites, supercomputers, and global models, yet weather forecasts still can’t guarantee 100% accuracy for tomorrow. It’s not because scientists aren’t working hard enough; the atmosphere itself is chaotic. A one-degree difference in initial conditions can lead to completely different outcomes.
This weekend’s system will inevitably make mistakes. Its autumn accuracy is close to a coin flip; early cold air arrivals might go unnoticed; sea breeze effects are not fully captured yet.
But that’s not the point. In prediction markets, you don’t need to be right every time—just need to see more information than the market when odds are favorable.
Shanghai’s weather market is still in its early stages. I will continue to track and improve this system. If you’re also trading on Polymarket’s weather markets, feel free to discuss in the comments: what methods do you use to judge entry timing? Have you encountered any surprising settlement results?
