Trade
Trading Type
Spot
Trade crypto freely
Pre-Market
Trade new tokens before they are officially listed
Margin
Magnify your profit with leverage
Convert & Block Trading
0 Fees
Trade any size with no fees and no slippage
Alpha
Points
Get promising tokens in streamlined on-chain trading
Leveraged Tokens
Get exposure to leveraged positions simply
Futures
Futures
Hundreds of contracts settled in USDT or BTC
Options
HOT
Trade European-style vanilla options
Unified Account
Maximize your capital efficiency
Demo Trading
Futures Kickoff
Get prepared for your futures trading
Futures Events
Participate in events to win generous rewards
Demo Trading
Use virtual funds to experience risk-free trading
Earn
Launch
CandyDrop
Collect candies to earn airdrops
Launchpool
Quick staking, earn potential new tokens
HODLer Airdrop
Hold GT and get massive airdrops for free
Launchpad
Be early to the next big token project
Alpha Points
NEW
Trade on-chain assets and enjoy airdrop rewards!
Futures Points
NEW
Earn futures points and claim airdrop rewards
Investment
Simple Earn
Earn interests with idle tokens
Auto-Invest
Auto-invest on a regular basis
Dual Investment
Buy low and sell high to take profits from price fluctuations
Soft Staking
Earn rewards with flexible staking
Crypto Loan
0 Fees
Pledge one crypto to borrow another
Lending Center
One-stop lending hub
VIP Wealth Hub
Customized wealth management empowers your assets growth
Private Wealth Management
Customized asset management to grow your digital assets
Quant Fund
Top asset management team helps you profit without hassle
Staking
Stake cryptos to earn in PoS products
BTC Staking
HOT
Stake BTC and earn 10% APR
GUSD Minting
Use USDT/USDC to mint GUSD for treasury-level yields
More
Promotions
Activity Center
Join activities and win big cash prizes and exclusive merch
Referral
20 USDT
Earn 40% commission or up to 500 USDT rewards
Announcements
Announcements of new listings, activities, upgrades, etc
Gate Blog
Crypto industry articles
VIP Services
Huge fee discounts
Proof of Reserves
Gate promises 100% proof of reserves
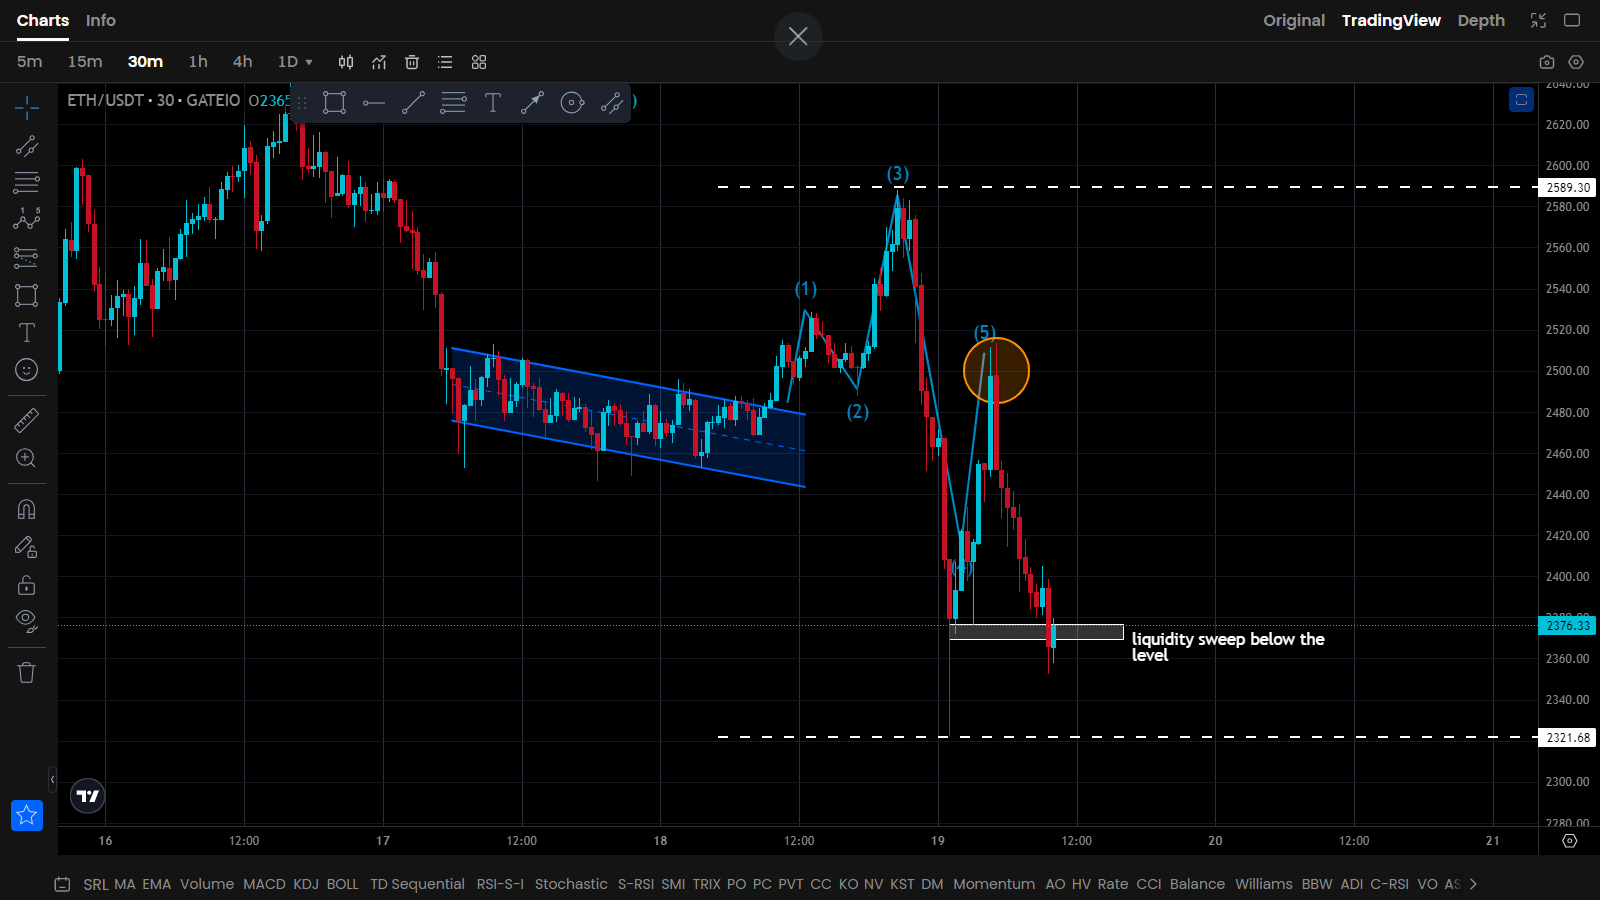
ETH/USDT Trading Analysis: Key Levels & Strategy
Market Overview (30-Minute Timeframe)
The ETH/USDT pair on Gate.io is showing interesting price action with a liquidity sweep below a key level, suggesting potential volatility ahead. Traders should watch for confirmation of a breakout or reversal.
Key Observations:
✅ Liquidity Sweep Detected – Price briefly dipped below a critical support level, possibly trapping late sellers before a reversal. ✅ Multiple Indicators in Play – RSI, MACD, Bollinger Bands, and volume analysis suggest a decision point. ✅ Gate.io’s TradingView Tools – Depth chart and order flow should be monitored for confirmation.
Technical Indicators Breakdown
The chart includes several key indicators:
Trading Strategy for ETH/USDT
1. Bullish Scenario (If Support Holds)
2. Bearish Scenario (If Breakdown Continues)
Risk Management Tips
Final Trade Setup
🔹 If Bullish: Wait for a confirmed bounce with volume. 🔹 If Bearish: Wait for a breakdown with follow-through selling. 🔹 If Undecided: Stay patient—better entries come with confirmation.
#Crypto #ETH #GateioTrading #TechnicalAnalysis #AltcoinSeason #Blockchain #SmartMoney