Trade
Trading Type
Spot
Trade crypto freely
Pre-Market
Trade new tokens before they are officially listed
Margin
Magnify your profit with leverage
Convert & Block Trading
0 Fees
Trade any size with no fees and no slippage
Alpha
Points
Get promising tokens in streamlined on-chain trading
Leveraged Tokens
Get exposure to leveraged positions simply
Futures
Futures
Hundreds of contracts settled in USDT or BTC
Options
HOT
Trade European-style vanilla options
Unified Account
Maximize your capital efficiency
Demo Trading
Futures Kickoff
Get prepared for your futures trading
Futures Events
Participate in events to win generous rewards
Demo Trading
Use virtual funds to experience risk-free trading
Earn
Launch
CandyDrop
Collect candies to earn airdrops
Launchpool
Quick staking, earn potential new tokens
HODLer Airdrop
Hold GT and get massive airdrops for free
Launchpad
Be early to the next big token project
Alpha Points
NEW
Trade on-chain assets and enjoy airdrop rewards!
Futures Points
NEW
Earn futures points and claim airdrop rewards
Investment
Simple Earn
Earn interests with idle tokens
Auto-Invest
Auto-invest on a regular basis
Dual Investment
Buy low and sell high to take profits from price fluctuations
Soft Staking
Earn rewards with flexible staking
Crypto Loan
0 Fees
Pledge one crypto to borrow another
Lending Center
One-stop lending hub
VIP Wealth Hub
Customized wealth management empowers your assets growth
Private Wealth Management
Customized asset management to grow your digital assets
Quant Fund
Top asset management team helps you profit without hassle
Staking
Stake cryptos to earn in PoS products
Smart Leverage
NEW
No forced liquidation before maturity, worry-free leveraged gains
GUSD Minting
Use USDT/USDC to mint GUSD for treasury-level yields
More
Promotions
Activity Center
Join activities and win big cash prizes and exclusive merch
Referral
20 USDT
Earn 40% commission or up to 500 USDT rewards
Announcements
Announcements of new listings, activities, upgrades, etc
Gate Blog
Crypto industry articles
VIP Services
Huge fee discounts
Proof of Reserves
Gate promises 100% proof of reserves
Trending Topics
View More12.28K Popularity
8.45K Popularity
37.77K Popularity
91.04K Popularity
2.65K Popularity
Pin
2100NEWS WEEKLY CRYPTO REPORT Dec-26
The crypto index NWST1100 rose 1.54% last week. Ether has posted a 2.61% loss, which is less severe than the losses seen across all other segments over the previous thirty days.
*Below, we present a standardized weekly report and next week’s outlook, prepared based on the Theory Swingtum of intelligent finance. We gauge the crypto market’s breadth and direction by showing the 2100NEWS Digital Assets Total Index (NWST1100), which measures the performance of 1100 (by market capitalization) significant crypto assets. The information-laden chart is complex to read initially, but it effectively displays essential price information, key decision-making levels, momentum, trading volumes, and crypto market breadth. Monitoring Market Sentiment and Breadth is necessary to detect early signs of trend reversals or continued strength.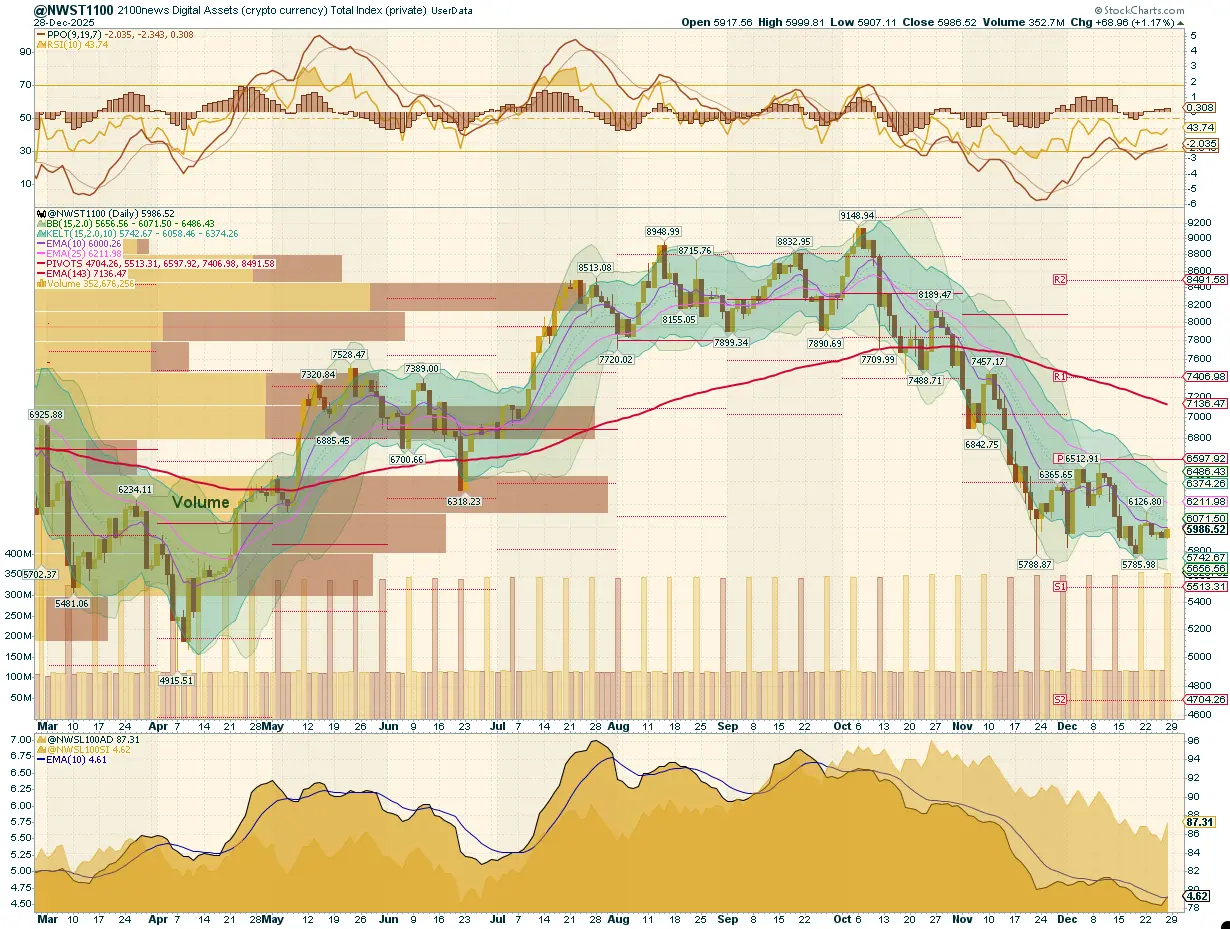
After conducting a detailed examination of the NWST1100 chart, a vital metric for the cryptocurrency market, several essential market dynamics and changes in market sentiment are revealed:
The NWST1100 index declined 1.54% over the past week, a period marked by persistent volatility and predominantly defensive market behavior. Following a brief upside breakout attempt on December 20, the market quickly lost mid-channel support and spent most of the week grinding lower beneath the 10-day EMA. Intraday trading was characterized by repeated sharp V-shaped rebounds, each followed by rapid afternoon sell-offs—an unmistakable signature of thin holiday liquidity and fragile investor conviction. As a result, the index remained confined to the lower half of its regression channel. Only on December 26 did NWST1100 test its midline, offering a tentative indication of a possible Christmas rally, though this move has yet to be confirmed by follow-through.
Market Sentiment (PPO & RSI): Momentum indicators continue to reflect a corrective environment. PPO lines remain below zero, consistent with consolidation rather than an impulsive trend, while the PPO histogram flattened just above the zero line, signaling a slowdown in downside momentum. The RSI stabilized in the low-40s, suggesting short-term relief but insufficient strength to confirm a trend shift.
Crypto Market Breadth indicators: Breadth indicators remain weak despite early signs of stabilization. The Advance-Decline Volume Line (ADVL), adapted by 2100News for the crypto market as ADVPL, tracks the net money volume of advancing versus declining digital assets. It started rising but showed no meaningful improvement in net money flows. The McClellan Summation Index, a long-term version of the McClellan Oscillator that measures market breadth, remains near cyclical lows but turned upward.
According to the chart on the right, all A50R indicators across the major segments (NWST1100, NWSET100, NWSL100, NWSCo100) have remained oversold, though slightly improved from extreme readings. A50R readings — the share of assets trading above their 50-day EMAs — have flattened in the 6% to 14% range. Ethereum Tokens (NWSET100) cohort remains the weakest, with only 6% of its constituents above their 50-day averages.
This breadth indicator measures the percentage of digital assets trading above a 50-day moving average
* The percentage of digital assets trading above a specific moving average is a breadth indicator that measures internal strength or weakness in the underlying index. The chart on the right side compares the percentage of DA trading above the 50-day EMA for:
📉 Summary
In Summary, despite intermittent intraday rebounds and a modest late-week seasonal lift, the cryptocurrency market remains firmly in a corrective phase. The week reinforced a defensive trading environment, characterized by mean-reversion dynamics rather than trend-following. Momentum has stabilized but not strengthened materially, breadth remains deeply oversold, and leadership continues to be narrowly concentrated in select blue-chip assets. Overall, the market has not yet transitioned into a confirmed recovery phase.
Outlook for this week
This report examines the cryptocurrency market’s short-term outlook, identifying patterns and signals that may offer insights into potential market direction. While predicting market behavior is inherently uncertain, discernible trends in momentum and market breadth indicators suggest possible developments.
📌 Target and Scenario Considerations:
Most likely scenario: The NWST1100 oscillates between the 10-day DEMA and the 25-day EMA, reflecting a fragile stabilization phase rather than a confirmed base. This behavior aligns with the gradual improvement in the PPO histogram and may produce localized higher lows, but without broader confirmation. A controlled drift toward Pivot P (~6,100) remains possible while seasonal support persists. However, once holiday-related demand dissipates, the market becomes increasingly vulnerable. Failure to attract new participation could result in a renewed test of lower support zones early in January, keeping the broader corrective structure intact. Overall, the market appears to be transitioning from capitulation to stabilization, but not yet toward recovery. Sentiment remains fragile, and without a clear expansion in breadth or momentum, stabilization alone may prove insufficient to prevent further pressure once seasonal effects fade.📍 Key Levels to Watch:
Performance of different groups of Digital Assets (Coins and Tokens)
Investors and traders rely on historical performance data to contextualize short-term moves and assess the relative strength of different market segments. The latest table shows that all categories drifted lower, with the NWST1100 index declining 1.54% over the past week.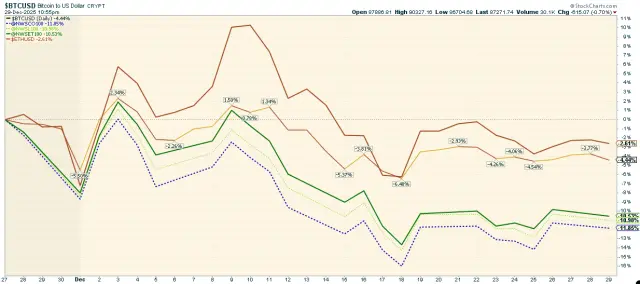 The chart above highlights the performance of various cryptocurrencies, including Bitcoin, Ether, and the 2100NEWS Indices, which represent Ethereum-based tokens (NWSET100), large caps (NWSL100), and Coins (NWSCo100). Among these, Ether was the strongest performer over the past 30 days, posting a comparatively modest decline of –2.61%. Losses across all other segments were notably deeper, confirming Ether’s defensive outperformance during the recent drawdown By contrast, Bitcoin and the broader index groups experienced more pronounced declines, placing Ether at the top of the relative-strength spectrum for the month. This divergence highlights a shift in short-term leadership toward Ether, even as the broader market remains under pressure.
While the broader market has trended sideways, different segments and individual cryptocurrencies exhibit different performance dynamics.
Performance Trends by Market Segment:
✔ NWS30, Bitcoin, and NWSBEled the market,
✔ NWSCo100 (Coins) has been improving.
✔ Ether weakened.
✔ NWSET100 (Ethereum-based tokens), NWSL100 (Large Caps) lagged.
Investors and traders might use this information to adjust their portfolios, possibly shifting focus toward assets with stronger relative momentum while being cautious about those in the Weakening quadrant.
*RRG® charts show the relative strength and momentum of groups of digital assets. Those with strong relative strength and momentum appear in the green Leading quadrant. As relative momentum fades, they typically move into the yellow Weakening quadrant. If relative strength then fades, they move into the red Lagging quadrant. Finally, when momentum picks up again, they shift into the blue Improving quadrant.
Crypto (Digital Assets) compared with global equity
This report offers a comprehensive analysis comparing the performance of digital assets, as measured by the NWST1100 index, to that of shares on global capital markets, as represented by the Dow Jones Global W1Dow index. The comparison spans multiple timeframes, providing insights into historical and recent performances and potential future trends.
Let’s break down the key observations and implications:
The recent pullback highlights a fundamental truth in crypto investing: market swings define opportunity. Historically, digital assets have significantly outperformed global equities, but their returns often come in concentrated bursts that follow periods of pessimism and capitulation. Prices have fallen below the 143-day EMA, positioning the market at a technically and psychologically critical juncture. Looking ahead, sentiment-driven capitulations often create conditions for stronger rebounds, especially when paired with structural oversold signals. While caution remains warranted in the short term, current price levels could present compelling opportunities for disciplined investors preparing for the next leg in crypto’s broader market cycle.
*The box in the middle of the chart shows the original NWST1100 price; at the bottom is W1Dow