Trade
Basic
Futures
Futures
Hundreds of contracts settled in USDT or BTC
TradFi
Gold
Trade global traditional assets with USDT in one place
Options
Hot
Trade European-style vanilla options
Unified Account
Maximize your capital efficiency
Demo Trading
Futures Kickoff
Get prepared for your futures trading
Futures Events
Participate in events to win generous rewards
Demo Trading
Use virtual funds to experience risk-free trading
Earn
Launch
CandyDrop
Collect candies to earn airdrops
Launchpool
Quick staking, earn potential new tokens
HODLer Airdrop
Hold GT and get massive airdrops for free
Launchpad
Be early to the next big token project
Alpha Points
Trade on-chain assets and enjoy airdrop rewards!
Futures Points
Earn futures points and claim airdrop rewards
Investment
Simple Earn
Earn interests with idle tokens
Auto-Invest
Auto-invest on a regular basis
Dual Investment
Buy low and sell high to take profits from price fluctuations
Soft Staking
Earn rewards with flexible staking
Crypto Loan
0 Fees
Pledge one crypto to borrow another
Lending Center
One-stop lending hub
VIP Wealth Hub
Customized wealth management empowers your assets growth
Private Wealth Management
Customized asset management to grow your digital assets
Quant Fund
Top asset management team helps you profit without hassle
Staking
Stake cryptos to earn in PoS products
Smart Leverage
New
No forced liquidation before maturity, worry-free leveraged gains
GUSD Minting
Use USDT/USDC to mint GUSD for treasury-level yields
More
Bitcoinworld90
2026 Market.BTC and SOL LIVE Analysis Smart Trade Setup
298
- Reward
- 1
- Comment
- Repost
- Share
The train is leaving max short everything
- Reward
- like
- Comment
- Repost
- Share
The market is bleeding heavily, and the scene is heartbreaking! In a bear market, actively embracing community building is especially a great opportunity for the two platforms to compete on the stage #4BALL
View Original
- Reward
- like
- Comment
- Repost
- Share
ma
🦄
Created By@SuDaqiang803
Listing Progress
0.05%
MC:
$2.4K
Create My Token
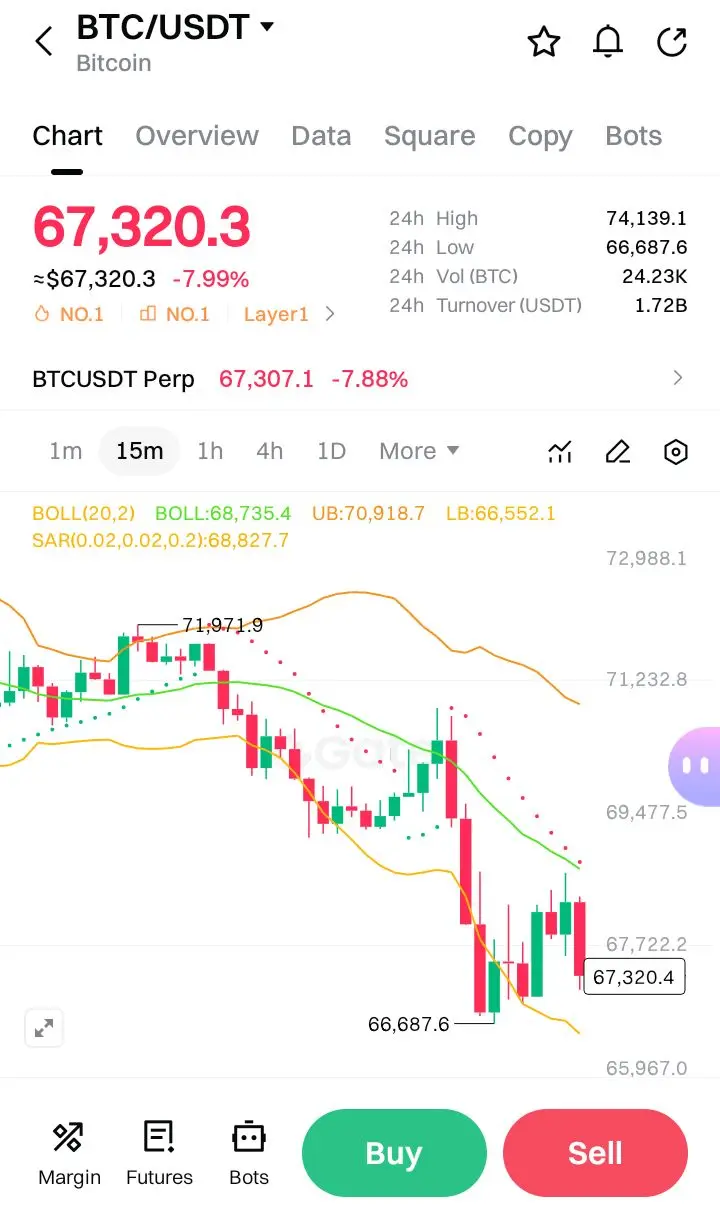
$BTC #BuyTheDipOrWaitNow? here is a technical analysis of the BTC/USDT chart:
1. Overall Trend & Price Action:
· Strong Downtrend (Short-Term): The price is currently at $67,320.3**, representing a significant drop of **-7.99%**. It is trading near the **24-hour low ($66,687.6) and well below the 24-hour high ($74,139.1). This indicates strong selling pressure in the last 24 hours.
· Key Level: The current price is sitting just above the critical 24h Low and the Lower Bollinger Band (LB: $66,552.1). Holding above this zone is crucial to prevent a further breakdown.
2. Technical Indicators:
·
BTC-10,61%

- Reward
- 1
- Comment
- Repost
- Share
- Reward
- like
- Comment
- Repost
- Share
‼️ Guan He Ping Wheel Brothers, give U‼️ The contract/spot order for the night of the 5th has been updated 👇 In the crypto world, only follow the right people. Thank you all for your support. The New Year 4GT half-price promotion has already exceeded 280 people. Tonight, it will resume at 8GT‼️ Apple click 👇 https://www.gate.com/zh/profile/ Little Ghost Daily Contract
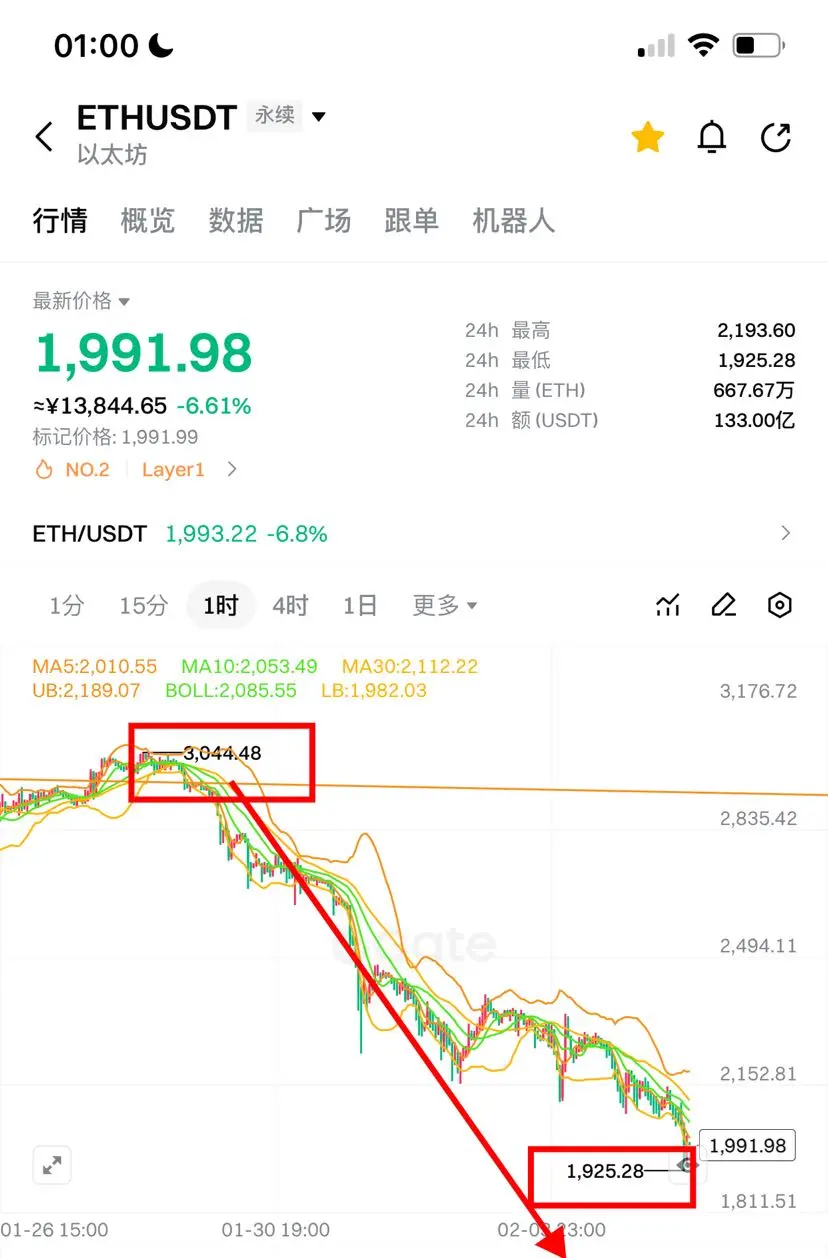
🔥 Recently ate over 2 million U in a row‼️ Last week 3045/90400 short + 84400 short, 1925/66700 big gains over 1 million W 📉 Reverse hand 1925/66700 more, now floating profit at 2015/68650🀄️#Gate1月透明度报告
View Original🔥 Recently ate over 2 million U in a row‼️ Last week 3045/90400 short + 84400 short, 1925/66700 big gains over 1 million W 📉 Reverse hand 1925/66700 more, now floating profit at 2015/68650🀄️#Gate1月透明度报告

- Reward
- 12
- 11
- Repost
- Share
GateUser-998a78fc :
:
‼️ Guan He Ping Wheel Old Iron Brothers, Give U‼️ The contract/spot order for the night of the 5th has been updated 👇 In the crypto world, only follow the right people. Thank you all for your support. The New Year 4GT half-price promotion has already exceeded 280 people. Tonight, it will resume at 8GT‼️ Apple click 👇 https://www.gate.com/zh/profile/ Little Ghost Daily Contract
🔥 Recently ate over 2 million U! Last week 3045/90400 short + 84400 short, 1925/66700 big buy over 1 million W 📉 Counterattack 1925/66700 more, now at 2015/68650 floating profit 🀄️ #Gate1月透明度报告#
View More
- Reward
- like
- Comment
- Repost
- Share

- Reward
- like
- Comment
- Repost
- Share
I expect opinions to always be divided, I don't know what's right and what's wrong, I'm Asian but I'm always neutral especially on things that hurt.
- Reward
- like
- Comment
- Repost
- Share
Analysis of BTC, ETH, and GT
1
- Reward
- like
- Comment
- Repost
- Share
China 🇨🇳 Time: February 6th, 1:12 AM, ETH Strategy
The overall trend remains bearish; go with the flow and avoid going against the trend.
Welcome to join my fan chat room. If you're not sure how to join, see the circled area in the diagram below.
Breakthrough resistance level: continue to rise and test the next resistance level.
Break below support level: continue to fall and test the next support level.
【Pin insertion to sweep liquidity, not considered a breakout or breakdown】
Recommended short positions: 2100—2140 (30% breakout probability)
First resistance level: 2040—2060 (65% breakout p
ETH-10,05%


- Reward
- 2
- 4
- Repost
- Share
Empty,ItIsEmpty,AndEmptiness:
I am a stubborn person.View More
GN 🌆 CT!IN THE MIDST OF THE CRASHES, FIND PEACE. TAKE BREAK!let\'s connect 🥲

- Reward
- like
- Comment
- Repost
- Share
aaab
新年快乐
Created By@GateUser-9c264066
Listing Progress
0.00%
MC:
$2.35K
Create My Token
SEC Names Jim Logothetis Chair of the PCAOB with Three New Members - #kpmg #pcaob #sec
View Original
- Reward
- like
- Comment
- Repost
- Share
#Show my holdings profit #当前行情抄底还是观望? Nice win
View Original
[The user has shared his/her trading data. Go to the App to view more.]
- Reward
- like
- Comment
- Repost
- Share

Caeser abeg na give us small pullback na 🥹

- Reward
- like
- Comment
- Repost
- Share
#CryptoMarketWatch
CryptoMarketWatch
Market Under Pressure As Prices Move Lower
Market Overview
The crypto market is currently facing strong downward pressure and overall sentiment has turned cautious. Over the past sessions, sellers have remained in control, pushing prices lower across Bitcoin, Ethereum, and most major altcoins. This move is not driven by a single event but rather a combination of technical breakdowns, reduced risk appetite, and broader macro uncertainty. When markets enter this type of phase, volatility usually increases and emotional trading becomes more common, which furt


- Reward
- 1
- 2
- Repost
- Share
Vortex_King:
Watching Closely 🔍️View More
$Dodge I almost missed the trend while waiting for the market to fully mitigate the FVG thanks to that pullback before more sellers jumped in to push it down 👇
- Reward
- like
- Comment
- Repost
- Share
Today\'s best daily mission @isekaiblade is complete! ✅Conquer your challenges and strengthen your ninja path today🔥Points in every mission: ✨ Easy: 10 points⚔️ Intermediate: 20 points🔥 Hard: 30 points🌪️ Ultra: 40 points🏆 Best: 200 points!#IsekaiBlade #SeiNetwork
- Reward
- like
- Comment
- Repost
- Share
Load More
Join 40M users in our growing community
⚡️ Join 40M users in the crypto craze discussion
💬 Engage with your favorite top creators
👍 See what interests you
Trending Topics
View More83.89K Popularity
8.65K Popularity
2.55K Popularity
3.94K Popularity
8.55K Popularity
News
View MoreRussell 2000 Index drops to a nearly one-month low, down 1.5% latest
26 m
Data: If BTC breaks through $69,015, the total liquidation strength of long positions on mainstream CEXs will reach $1.209 billion.
39 m
Data: If ETH breaks through $2,032, the total liquidation strength of long positions on mainstream CEXs will reach $559 million.
39 m
In the past 4 hours, the entire network has been liquidated by $759 million, with nearly $400 million in BTC liquidations.
44 m
Data: Bitcoin price drops below $66,000, indicating a significant market movement. Investors are advised to monitor the situation closely and consider risk management strategies amid the recent volatility.
51 m
Pin