
🎶 “The Rise of the Chain” 🎶
Lights flicker, screens are live,
Numbers dance, we all evolve,
Rising from the fall,
Diamond hands to the end.
Voices echo throughout the night,
The future is built on code and light,
Blockchains are connected, strong and free,
This is our reality.
Feel the pulse, the fire of the market,
Every transaction takes us higher,
No more limits, break the frame,
We are leading the game!
We are rising! We are riding! Tonight's crypto wave,
Blockchain beats like a heart of light,
Buy the dream, let the whole world see,
This is our time—our legacy!
We stand tall! We are exhilarated with joy! We light a fire together,
Throughout the charts and endless struggle,
The gateway to the future, bold and free,
Crypto forever—this is our key!
Green and red candles are burning,
Every move is a path,
From the ups and downs of the market,
Only a stronger courage grows.
Wallets open, visions wide,
Innovation is our guide,
We find our way through the noise,
Building wealth that will last.
Hear the call, the chain is strong,
Every block we belong to,
Side by side, we claim our name,
In this ever-changing game!
We are rising! We are riding! Tonight's crypto wave,
The blockchain beats like a heart of light,
Buy the dream, let the whole world see,
This is our time—our legacy!
We stand tall! We are exuberant with joy! We ignite together,
Throughout the charts and endless struggle,
The gateway to the future, bold and free,
Crypto forever—this is our key!
From a vision to a flame,
Now the world will know our name,
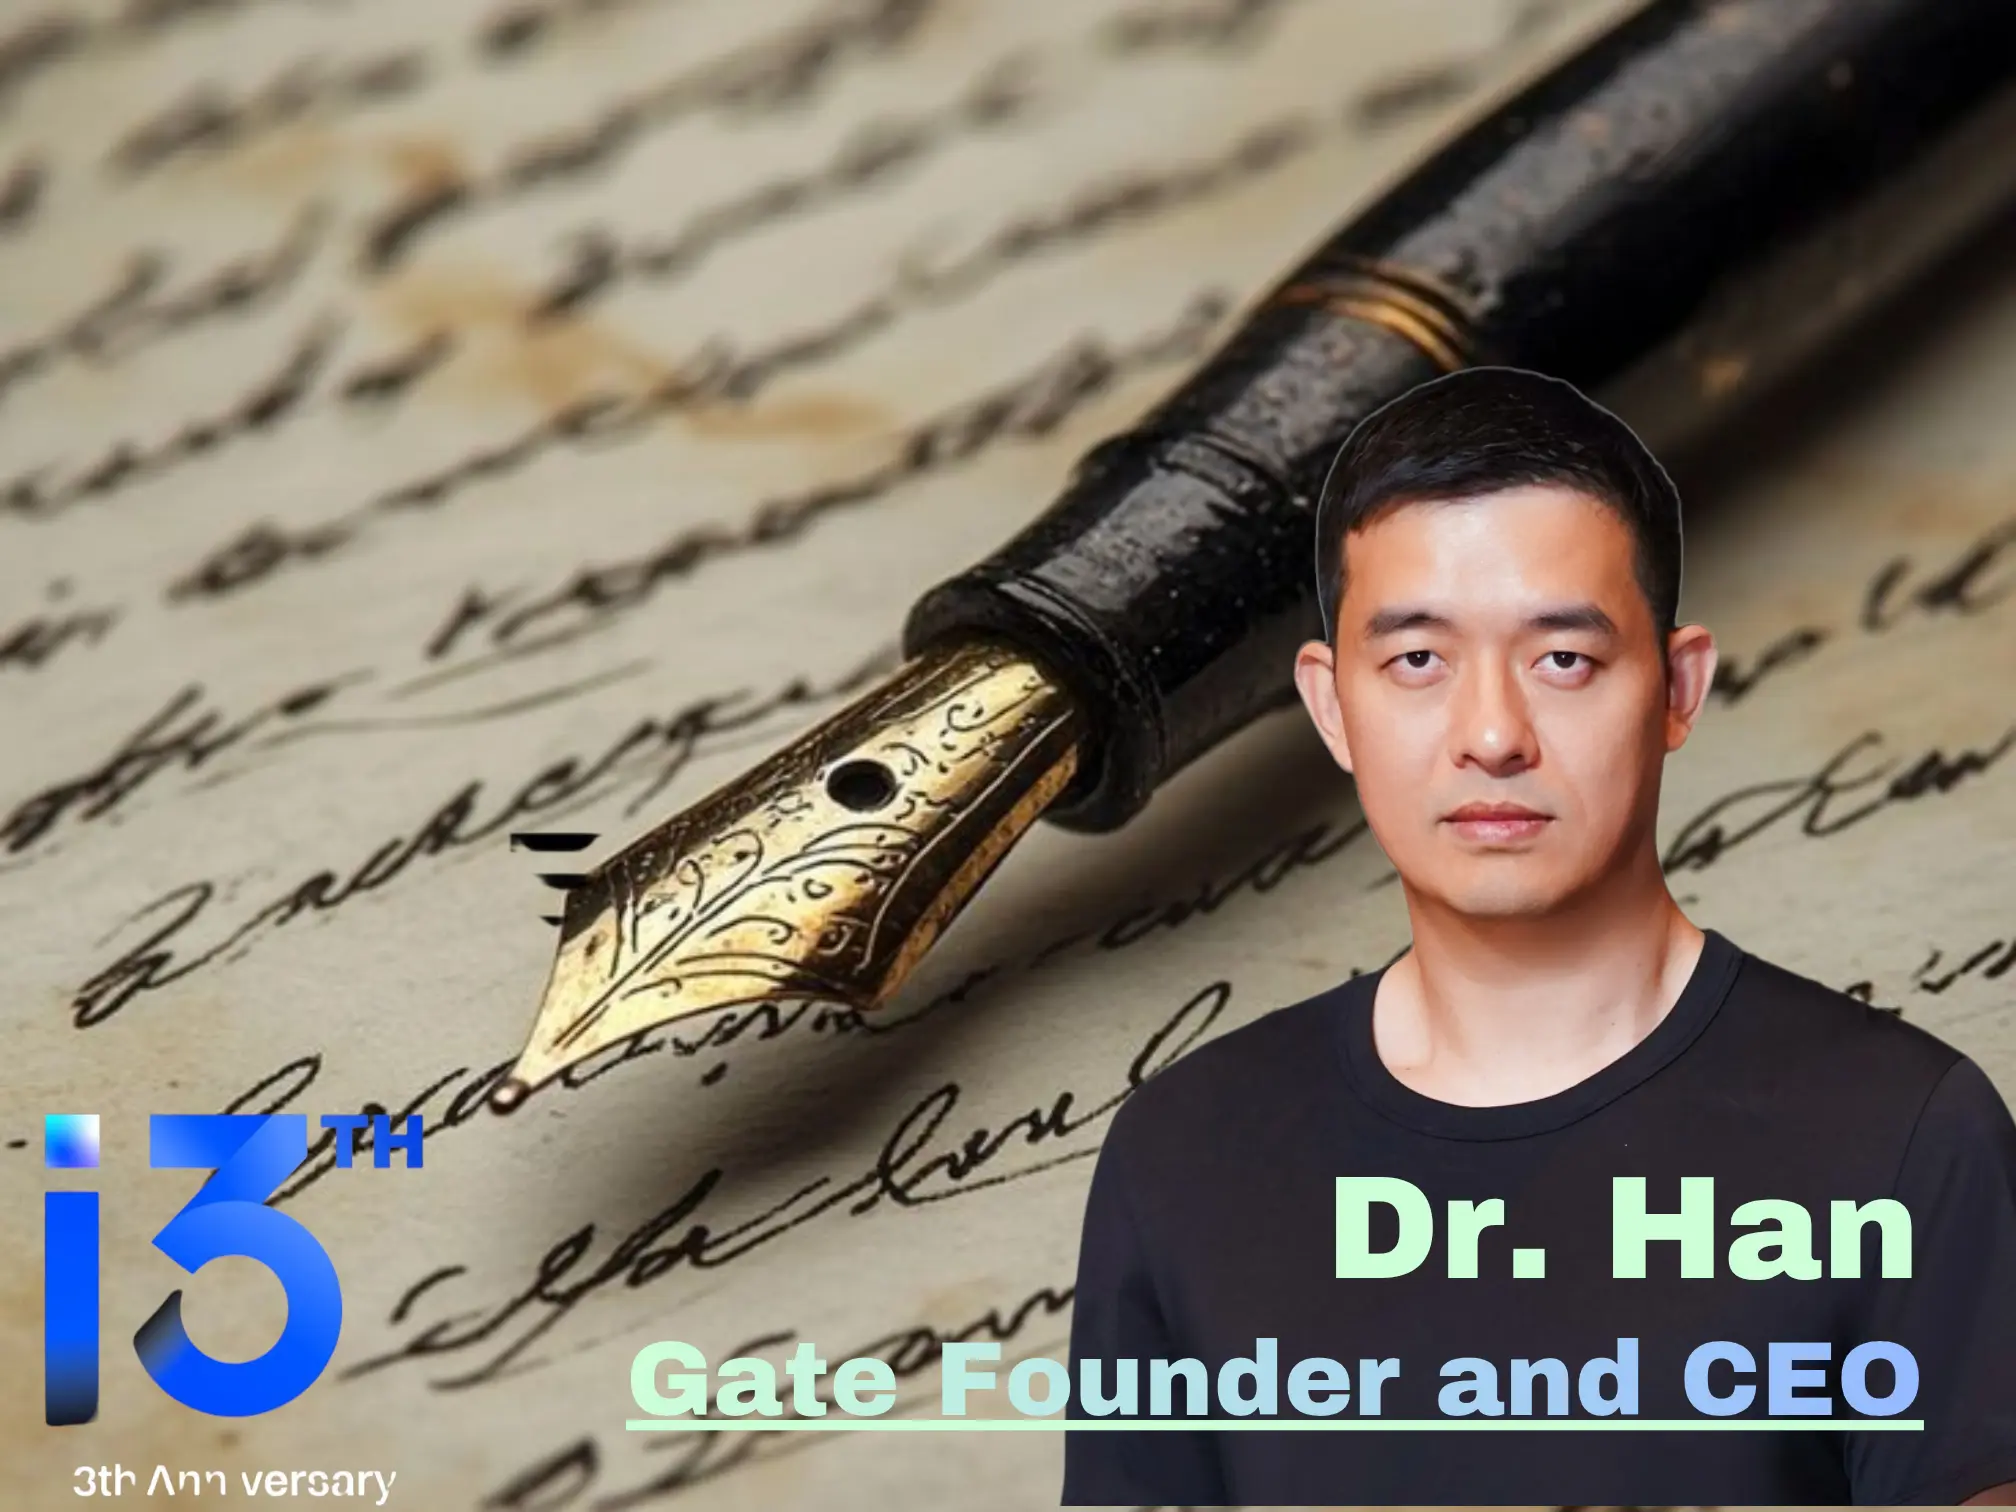
Dr. Han's words show the way,
To a brighter, freer day.
Trust in the truth we share,
Decentralized everywhere,
This is more than just a trend—
This is where our worlds transcend!
We are rising! We are riding! Tonight's crypto wave,
Feel the power, feel the might,
The market is roaring, hearts are aligned,
The future is written, redefined!
We stand! We roar! Let the whole world see,
This is our revolution, free!
The door is open—step inside,
The crypto kingdom—our pride! 🚀
#Gate13thAnniversary
#Gate13周年
Lights flicker, screens are live,
Numbers dance, we all evolve,
Rising from the fall,
Diamond hands to the end.
Voices echo throughout the night,
The future is built on code and light,
Blockchains are connected, strong and free,
This is our reality.
Feel the pulse, the fire of the market,
Every transaction takes us higher,
No more limits, break the frame,
We are leading the game!
We are rising! We are riding! Tonight's crypto wave,
Blockchain beats like a heart of light,
Buy the dream, let the whole world see,
This is our time—our legacy!
We stand tall! We are exhilarated with joy! We light a fire together,
Throughout the charts and endless struggle,
The gateway to the future, bold and free,
Crypto forever—this is our key!
Green and red candles are burning,
Every move is a path,
From the ups and downs of the market,
Only a stronger courage grows.
Wallets open, visions wide,
Innovation is our guide,
We find our way through the noise,
Building wealth that will last.
Hear the call, the chain is strong,
Every block we belong to,
Side by side, we claim our name,
In this ever-changing game!
We are rising! We are riding! Tonight's crypto wave,
The blockchain beats like a heart of light,
Buy the dream, let the whole world see,
This is our time—our legacy!
We stand tall! We are exuberant with joy! We ignite together,
Throughout the charts and endless struggle,
The gateway to the future, bold and free,
Crypto forever—this is our key!
From a vision to a flame,
Now the world will know our name,
Dr. Han's words show the way,
To a brighter, freer day.
Trust in the truth we share,
Decentralized everywhere,
This is more than just a trend—
This is where our worlds transcend!
We are rising! We are riding! Tonight's crypto wave,
Feel the power, feel the might,
The market is roaring, hearts are aligned,
The future is written, redefined!
We stand! We roar! Let the whole world see,
This is our revolution, free!
The door is open—step inside,
The crypto kingdom—our pride! 🚀
#Gate13thAnniversary
#Gate13周年