


#GateSpotDerivativesBothTop3 Personal Market Breakdown & Structural Insight
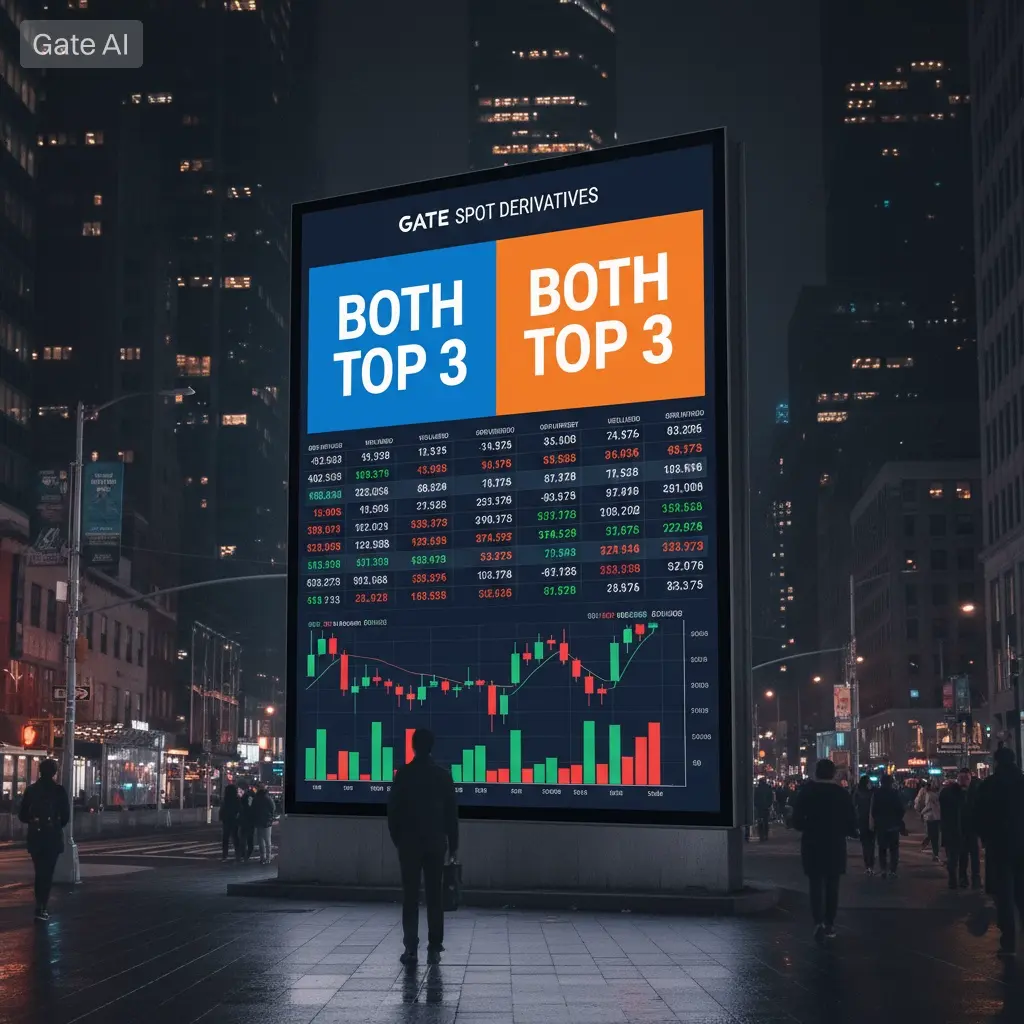
From my personal perspective, #GateSpotDerivativesBothTop3 is not just a ranking update—it is a strong signal about how the global crypto exchange landscape is evolving into a more competitive, institution-grade liquidity environment. When a single platform simultaneously ranks in the top 3 for both spot trading volume and derivatives activity, it reflects something deeper than just user growth—it reflects capital concentration, liquidity depth, and global trader trust at scale.
What stands out to me most is the dual dominance structure. Spot markets represent real asset demand—people buying and holding assets like BTC, ETH, and altcoins. Derivatives markets, on the other hand, represent leveraged sentiment, speculation, hedging, and macro positioning. When both sides grow together, it means the platform is not just attracting traders—it is becoming a complete financial ecosystem where capital flows in multiple directions at the same time.
From my personal analysis, this type of dual top-tier ranking usually happens under very specific conditions:
First, liquidity depth expansion. High spot volume means tighter spreads, better execution, and stronger market efficiency. This attracts both retail and institutional flow.
Second, derivatives participation growth. When futures and perpetual contracts reach top global rankings, it indicates that traders are actively hedging, speculating, and using leverage strategies at scale. This is where real market volatility gets priced.
Third, and most importantly, capital rotation inside the ecosystem. Traders are not just entering and exiting—they are actively moving between spot accumulation and derivatives hedging strategies, which increases total platform velocity.
Another new layer I personally observe is the rise of cross-market trading behavior. Many traders now use spot positions as long-term exposure while simultaneously hedging risk using futures. This creates a more advanced trading structure where platforms that support both efficiently become dominant naturally.
From a macro perspective, this kind of ranking also reflects a shift in global crypto liquidity. We are moving into a phase where liquidity is no longer fragmented across dozens of small exchanges—it is concentrating into a few high-performance ecosystems that offer:
deep order books
low latency execution
strong derivatives infrastructure
multi-asset integration
That is exactly why spot + derivatives dominance together matters.
Another important insight is the role of volatility monetization. Derivatives markets thrive when volatility exists, and crypto continues to deliver that volatility across BTC, ETH, and altcoins. Platforms that can efficiently absorb this volatility and convert it into trading volume naturally climb global rankings.
From my personal trading mindset, I see this kind of ecosystem as important because it directly affects execution quality. When liquidity is high in both spot and derivatives:
slippage decreases
entries become cleaner
price discovery becomes more accurate
manipulation becomes harder at scale
But I also stay realistic. High volume does not eliminate risk. In fact, it often increases competitive pressure, where algorithms, market makers, and leveraged traders dominate short-term price action. So discipline and risk control still matter more than ever.
Another new development I’m paying attention to is the increasing connection between spot accumulation zones and derivatives liquidation zones. In modern markets, price often moves toward areas where leverage is overextended. Platforms with high derivatives activity become central in this process because liquidation clusters directly influence short-term price direction.
So my personal conclusion is simple:
This is not just about being “top 3 in volume.”
It is about becoming a core liquidity hub in the global crypto trading system, where both long-term investors and short-term traders interact in the same ecosystem.
🚀 In the bigger picture, we are seeing the formation of a few dominant global liquidity centers—and platforms with dual dominance in spot and derivatives are at the center of that evolution.#GateSpotDerivativesBothTop3 #GateSquareAprilPostingChallenge