Unlocking the Doji Pattern in Trading: An In-Depth Guide to Candlestick Analysis for Cryptocurrency. Learn about the various Doji types, key trading signals, and proven trend reversal strategies to enhance your trading success on Gate.
Introduction to Technical Analysis and Candlestick Patterns
Technical analysis stands as one of the most valuable resources in a modern trader’s arsenal. Whether you’re trading cryptocurrencies, equities, or commodities, understanding technical indicators is essential for making sound trading decisions. Traders rely heavily on candlestick charts for technical analysis because these charts provide detailed information about price action over specific timeframes.
Candlestick charts not only visualize price fluctuations—they also form distinct patterns that offer insights into market sentiment and serve as reliable signals for predicting future movements. Among these, the Doji pattern is widely recognized by professional traders. This comprehensive guide explores the Doji candle in depth—what it is, how it forms, and how it functions in practice. You’ll learn to identify various Doji patterns and how they influence price charts and trading strategies.
What Is a Doji Candlestick Pattern
The Doji candlestick pattern is a unique structure that forms when a session’s opening and closing prices are equal or almost equal. Typically, a Doji candle signals significant uncertainty and equilibrium in the battle between bullish (buyers) and bearish (sellers) traders.
In simple terms, a Doji candle indicates that buyers and sellers are evenly matched, and neither side can dominate. Buyers attempt to drive prices higher and generate upward momentum, while sellers apply counter-pressure by selling, pushing prices lower. These opposing forces create a state of market equilibrium.
A Doji forms precisely when traders on both sides exert roughly equal influence on price through their activity. This is visually represented by a minimal or nearly invisible candle body—reflecting a negligible difference between the open and close. For example, if Bitcoin opens at $20,000 and closes at the same or nearly the same level (say, $20,005), a classic Doji pattern appears, signaling indecision in the market.
Origin of the Doji Pattern Name
The term “Doji” originates from the Japanese language, which is fitting since candlestick analysis was developed centuries ago by Japanese rice merchants. “Doji” translates as “mistake,” “error,” or “simultaneity.” This name refers to the rarity of sessions where the open and close prices match exactly—an “anomaly” in market behavior.
The Doji candle represents indecision and equilibrium between bulls and bears in the financial markets—a moment where the market “pauses” before choosing its next direction. Understanding this helps traders interpret market signals more accurately and make better decisions.
How the Doji Pattern Works in Trading Practice
The Doji candle is an invaluable tool for traders seeking deep insight into current market conditions and anticipating future price movements. Most successful traders analyze both historical data and live price action to identify trading signals.
For instance, if the market is in a clear uptrend and a Doji appears, it signals neutrality and uncertainty among participants. This may mean the uptrend is losing strength and could soon reverse—making the Doji a key indicator of a potential trend change.
The reverse applies as well. In a prolonged downtrend, the formation of a Doji can signal that selling pressure is fading and a bottom may be near. Buyers begin to step in, shifting the balance of power.
However, it’s essential not to base trading decisions solely on the appearance of a Doji. A single technical indicator is not enough to build a reliable, profitable strategy. Always combine multiple indicators—such as trading volume, support and resistance levels, moving averages, and other technical tools—in your analysis.
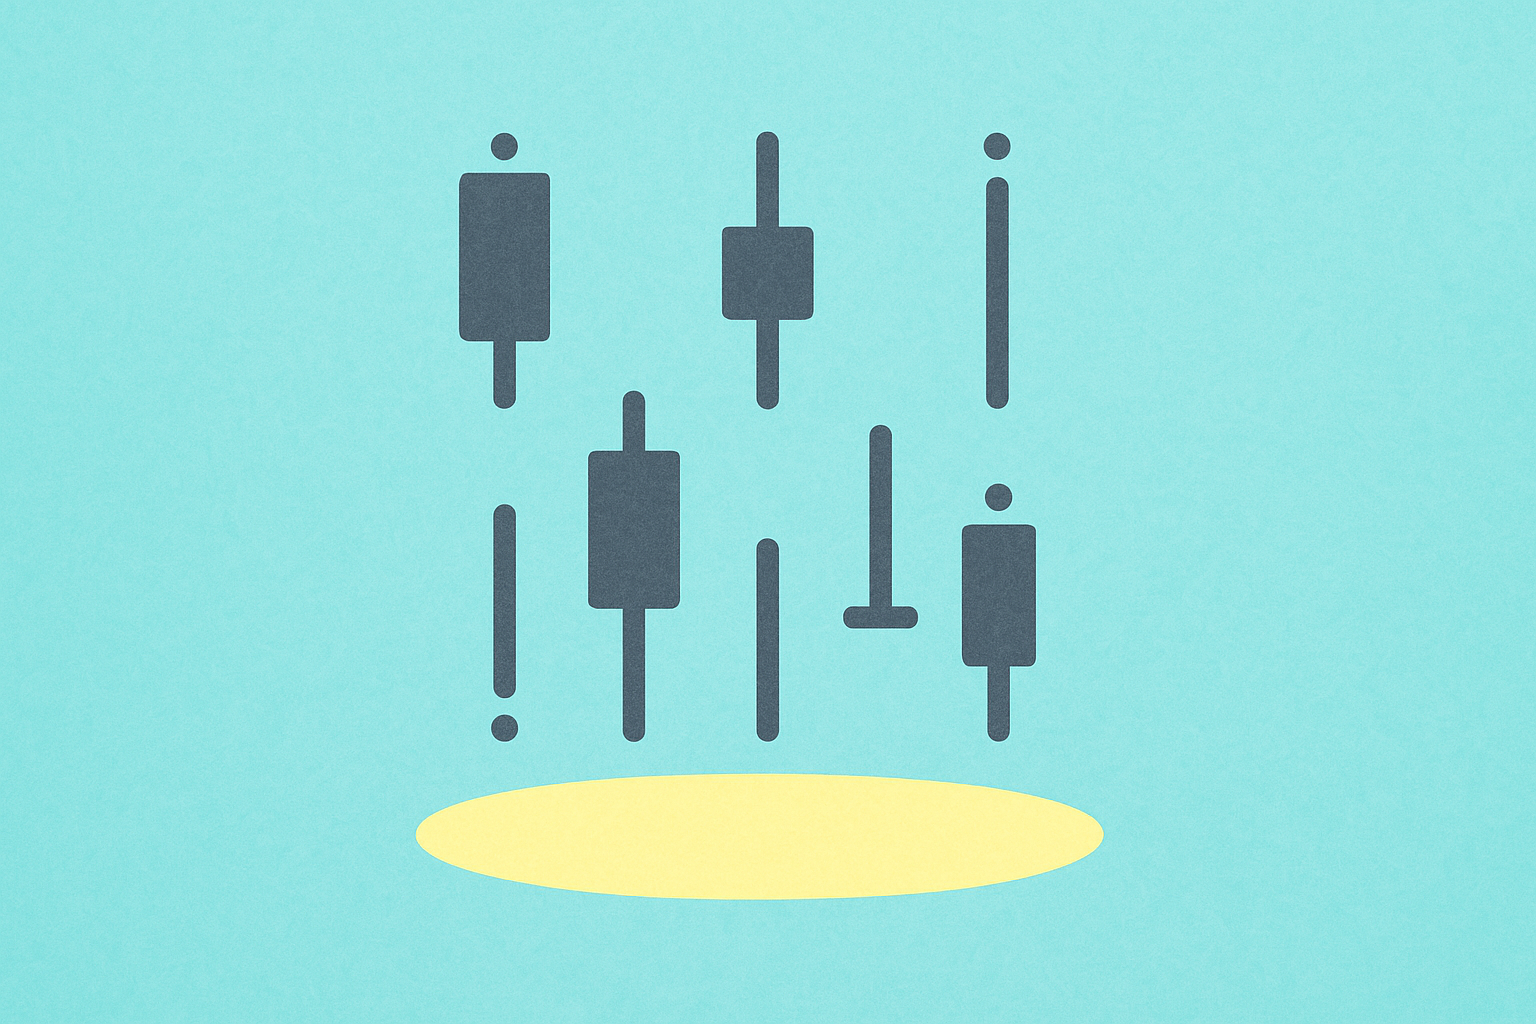
Main Types of Doji Candlestick Patterns
Neutral Doji Candle: This pattern has an almost invisible body positioned at the center of the candle. The upper and lower shadows (wicks) are nearly the same length, forming a symmetrical cross or plus sign. It emerges when bullish and bearish trends are nearly perfectly balanced, and neither side prevails. The neutral Doji’s main challenge is interpretation—it often doesn’t provide a clear signal by itself. Traders may see it as a continuation signal, especially if it appears mid-trend.
Long-Legged Doji: This pattern features very long upper and lower shadows and a tiny candle body. It reflects intense competition between buyers and sellers, resulting in high volatility during the session, but ultimately, neither side wins. The closing price’s position relative to the midpoint is crucial: a close below the midpoint is bearish—especially if the pattern appears near resistance; a close above the midpoint is bullish and suggests potential upward continuation.
Dragonfly Doji: One of the most recognizable Doji variants, it displays a long lower shadow and an almost absent upper shadow. The open, close, and session high are at or near the same level, making the candle look like a “T” or a dragonfly. When this forms at the bottom of a downtrend, it’s a clear buy signal, showing that sellers have been exhausted and buyers are ready to take control.
Gravestone Doji: The opposite of the Dragonfly Doji, this pattern has the open and close at the session low with a long upper shadow—forming an inverted “T.” Bulls try to drive prices higher but can’t sustain momentum, and the price returns to the open. In an uptrend—especially near resistance—this is a strong reversal signal, warning of a possible downturn.
Four-Price Doji: This rare pattern appears mainly during sessions with extremely low volume or on very short timeframes. It looks like a horizontal line or minus sign—all four price points (open, high, low, close) are identical. In other words, the market remains completely flat, indicating very low activity and liquidity.
Double Doji Candle: If one Doji signals indecision, two consecutive Dojis form an even stronger pattern. This indicates persistent uncertainty and may precede a sharp breakout in either direction. When the market consolidates in a double Doji, the following move is often sudden and significant.
Risks and Limitations of Using Doji Patterns
Relying exclusively on Doji candles carries risks similar to using any isolated technical signal. Using only this pattern is not optimal, as Doji candles are usually neutral and may not provide clear directional guidance.
If you base decisions solely on the Doji, you may miss other critical information and broader market context before entering a trade. This includes the overall trend, key support or resistance levels, trading volume, or fundamental factors affecting the asset.
Doji patterns offer limited information and are just one piece of the broader market picture. They can be overlooked on busy charts or misread without additional context. However, when used appropriately with other indicators, Doji candles are a valuable tool in technical analysis.
Reliability of Doji Candlestick Patterns in Trading Practice
Do not rely on Doji patterns as your sole source of trade signals without first reviewing other technical indicators and market conditions. Market indecision and consolidation can be brief, after which the prior trend resumes with force. Professional traders avoid making decisions based on guesswork, intuition, or luck.
This is the core purpose of technical analysis—to provide objective, evidence-based signals using facts, statistics, and proven patterns. You shouldn’t ignore Doji candles when they appear on your chart; on the contrary, they may offer important early warnings.
Before acting and opening a position, always seek confirmation from other indicators and signals. Use tools like volume indicators, RSI (Relative Strength Index), MACD (Moving Average Convergence Divergence), Fibonacci levels, and more. Doji candles are excellent for spotting the initial stage of a potential market reversal, as they are easy to identify on a chart.
Still, before making any trade, gather additional data, analyze the overall market context, and ensure that several independent indicators confirm your scenario. Only a holistic approach to technical analysis can minimize risk and improve your odds of success in financial markets.
FAQ
What is a Doji candlestick formation and what are its characteristics?
A Doji is a Japanese candlestick formation where the open and close are at the same level or very close. Key features: long upper and lower shadows, and a very small or absent body. A Doji signals market indecision and a potential trend reversal, making it an important tool for traders.
How do you identify and confirm a Doji pattern on a price chart?
A Doji is a candle with matching open and close, reflecting indecision. It shows long wicks above and below. Confirmation comes when a Doji appears at the end of a trend, possibly indicating a price reversal or a shift in market direction.
What does a Doji represent in technical analysis, and what does it suggest?
The Doji formation indicates a balance between buyers and sellers with no clear advantage. It often suggests a possible trend reversal or a period of consolidation before the market’s next move.
What are the differences between various types of Doji (Cross Doji, Dragonfly Doji, Gravestone Doji)?
The Cross Doji has equal-length upper and lower shadows, signaling a balance between bulls and bears. The Dragonfly Doji has a long lower shadow and a short upper shadow, indicating a potential bottom reversal. The Gravestone Doji has a long upper shadow and a short lower shadow, signaling a possible top reversal. Each pattern reflects changing supply and demand dynamics in different phases of the market.
How do you develop a trading strategy and entry/exit signals based on the Doji pattern?
The Doji pattern serves as a reversal signal. Enter after price rebounds from support and exit when it breaks out in a new direction. Confirm your signals with trading volume and support/resistance levels to enhance your strategy’s effectiveness.
Does the Doji formation have equal reliability across different timeframes (daily, 4-hour, 1-hour)?
No, Doji reliability varies by timeframe. On daily candles, Doji patterns are more significant and reliable; on 4-hour candles, they are moderately reliable; on 1-hour candles, they often produce false signals. The higher the timeframe, the greater the pattern’s reliability.
* The information is not intended to be and does not constitute financial advice or any other recommendation of any sort offered or endorsed by Gate.