Date: Sat, Dec 20 2025 | 05:55 PM GMT
The broader cryptocurrency market has continued to struggle with uneven and choppy price action over the past several weeks, a phase that began after the sharp sell-off on October 10. That correction pushed Ethereum (ETH) lower by nearly 26% over the last 60 days, keeping sustained pressure across the altcoin market. Worldcoin (WLD) has been no exception, remaining under heavy selling pressure during this period.
WLD is down more than 44% over the past two months. While the short-term trend still leans bearish, the higher-timeframe chart is starting to show a structure that often appears near potential market turning points. If key technical levels are reclaimed, the current setup could evolve into a broader recovery attempt.
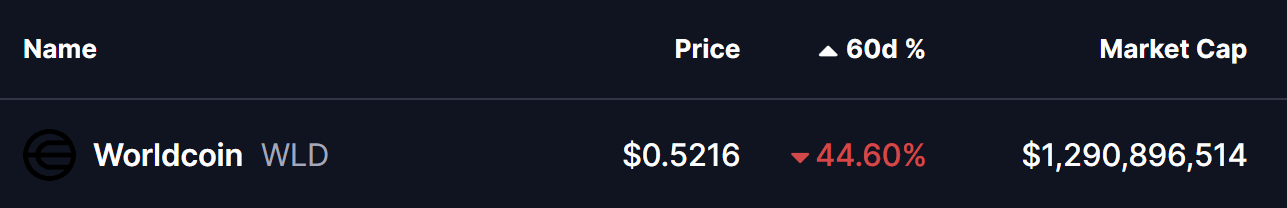
Source: Coinmarketcap
Power of 3 Pattern in Focus
On the higher-timeframe chart, WLD appears to be forming a classic Power of 3 structure, a pattern frequently associated with market cycle lows and trend transitions. This structure typically unfolds in three stages—accumulation, manipulation, and expansion—with the most decisive move usually emerging once the final phase begins.
Earlier, WLD spent an extended period moving sideways within a well-defined range between $0.6528 and $0.5628. This low-volatility environment, highlighted by the grey box on the chart, reflects the accumulation phase. During such phases, price action tightens, volatility fades, and longer-term participants often begin positioning quietly while broader sentiment remains weak or indifferent.
That stability eventually gave way as broader market pressure intensified. WLD broke below the $0.5628 support and slid to a recent low near $0.4721 before attempting a modest rebound. This sharp downside move aligns closely with the manipulation phase of the Power of 3 pattern. Such breakdowns are often designed to trigger stop-losses and force capitulation, shaking out weaker holders before price looks for a base.
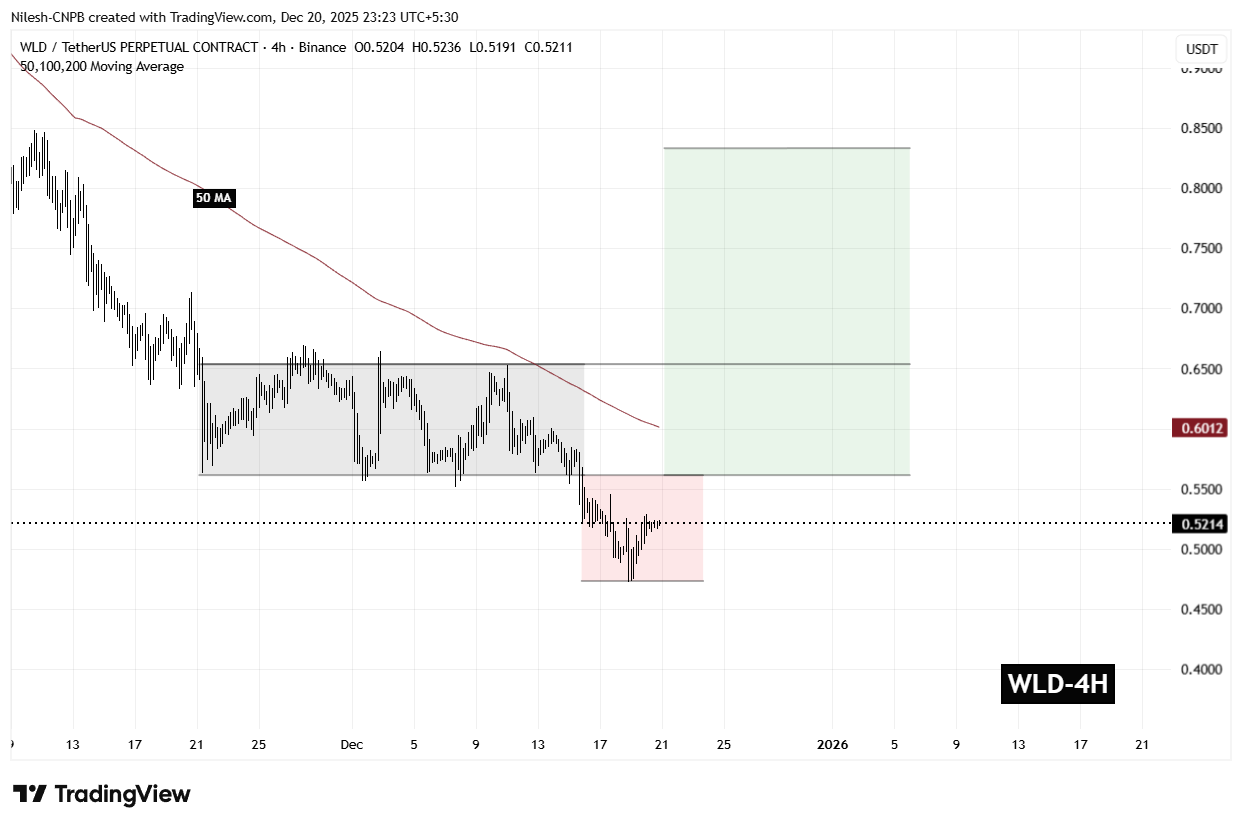
Worldcoin (WLD) 4H Chart/Coinsprobe (Source: Tradingview)
Notably, selling momentum has started to slow near this lower zone. Recent candles show reduced downside follow-through, suggesting that bearish pressure may be losing strength as price consolidates after the breakdown.
What’s Next for WLD?
At the time of writing, WLD continues to trade within the broader manipulation zone, which calls for caution. Price remains below the 50-period moving average near $0.6012, an area that now acts as an important short-term resistance. A sustained move back above this level would be an early signal that sellers are losing control.
For the bullish scenario to gain traction, WLD needs to reclaim both the $0.5628 level and establish acceptance above the $0.60–$0.65 resistance zone. A successful recovery into this former range would suggest that the manipulation phase has likely concluded and that the market may be transitioning toward the expansion phase of the structure.
If buyers manage to break and hold above $0.6528, the chart projection opens the door for a move toward the $0.83 region, which represents the measured expansion target and implies a potential upside of roughly 59% from current levels.
That said, this setup remains conditional. As long as WLD trades below $0.5628, downside risks cannot be ruled out, and the market remains vulnerable to further volatility. Holding recent lows and reclaiming key resistance levels will be critical for bulls looking to validate a bullish reversal narrative.
Disclaimer: The views and analysis presented in this article are for informational purposes only and reflect the author’s perspective, not financial advice. Technical patterns and indicators discussed are subject to market volatility and may or may not yield the anticipated results. Investors are advised to exercise caution, conduct independent research, and make decisions aligned with their individual risk tolerance.
Disclaimer: The information on this page may come from third parties and does not represent the views or opinions of Gate. The content displayed on this page is for reference only and does not constitute any financial, investment, or legal advice. Gate does not guarantee the accuracy or completeness of the information and shall not be liable for any losses arising from the use of this information. Virtual asset investments carry high risks and are subject to significant price volatility. You may lose all of your invested principal. Please fully understand the relevant risks and make prudent decisions based on your own financial situation and risk tolerance. For details, please refer to
Disclaimer.
Related Articles
HBAR at a Crossroads: Will $0.095 Support Trigger a Break Toward $0.106?
HBAR is trading at $0.09739 and above the S/R flip of $0.094-$0.096 in the 12H chart.
The nearest resistance will be at $0.10 with a falling trendline pressure at around $0.104-$0.106.
The support is at $0.095835 and a breakdown at the
CryptoNewsLand5m ago
PEPE Hovers at Critical $0.053414 Support as $432M Volume Surge Tightens Breakout Watch
PEPE is trading at $0.053416, just above support at $0.053414, with significant trading volume up 22.14%. Resistance is at $0.053676. Despite a slight decrease in price, there’s increased market activity, suggesting potential volatility.
CryptoNewsLand10m ago
Builders Are Walking Away From Aave – What Does It Mean for AAVE Price?
Aave (AAVE) is dealing with two very different headlines at the same time. On one side, the protocol faced a $24 million exploit linked to address poisoning, once again reminding users that security risks still exist across DeFi.
Despite that incident, the market reaction has been somewhat
CaptainAltcoin55m ago
AVAX Tests $9.38 Resistance After 8.3% Surge — Breakout or Pullback Ahead?
AVAX is also trading at $9.16 with a daily gain of 8.3 per cent, but still below $9.38 resistance.
Strong buyer activity near $8.46 continues to prevent deeper downside extensions.
A daily close above $9.38 could open room toward $9.50, while rejection risks $8.30.
Avalanche’s
CryptoNewsLand1h ago
Dogecoin Prints Monthly Morning Doji Star — Will $0.097 Break Next?
Dogecoin is forming a "Morning Doji Star" pattern on the monthly chart around $0.09, indicating a potential bullish reversal despite a recent 1.9% daily decline. Key support is at $0.09036 and resistance at $0.09707, with current trading at $0.09010.
CryptoNewsLand1h ago
Here’s the XRP Price If Banks Start Treating Ripple as the Ultimate “Integration Play”
Ripple’s XRP price moved up a bit today, but the overall picture still feels uncertain. The token dropped heavily over the past few months, and many traders are still careful.
Online discussions show mixed feelings. Some think the recent drop may have formed a short-term bottom. However, many
CaptainAltcoin1h ago

