
Glassnode co-founder Rafael(@n3ocortex) posted on X on June 5, saying that Bitcoin has first fallen below the median holder realized P/L break-even line since December 2022. Rafael said his pricing framework suggests a high-probability bottom zone between $46,000 and $54,000.
Confirmed On-Chain Technical Levels
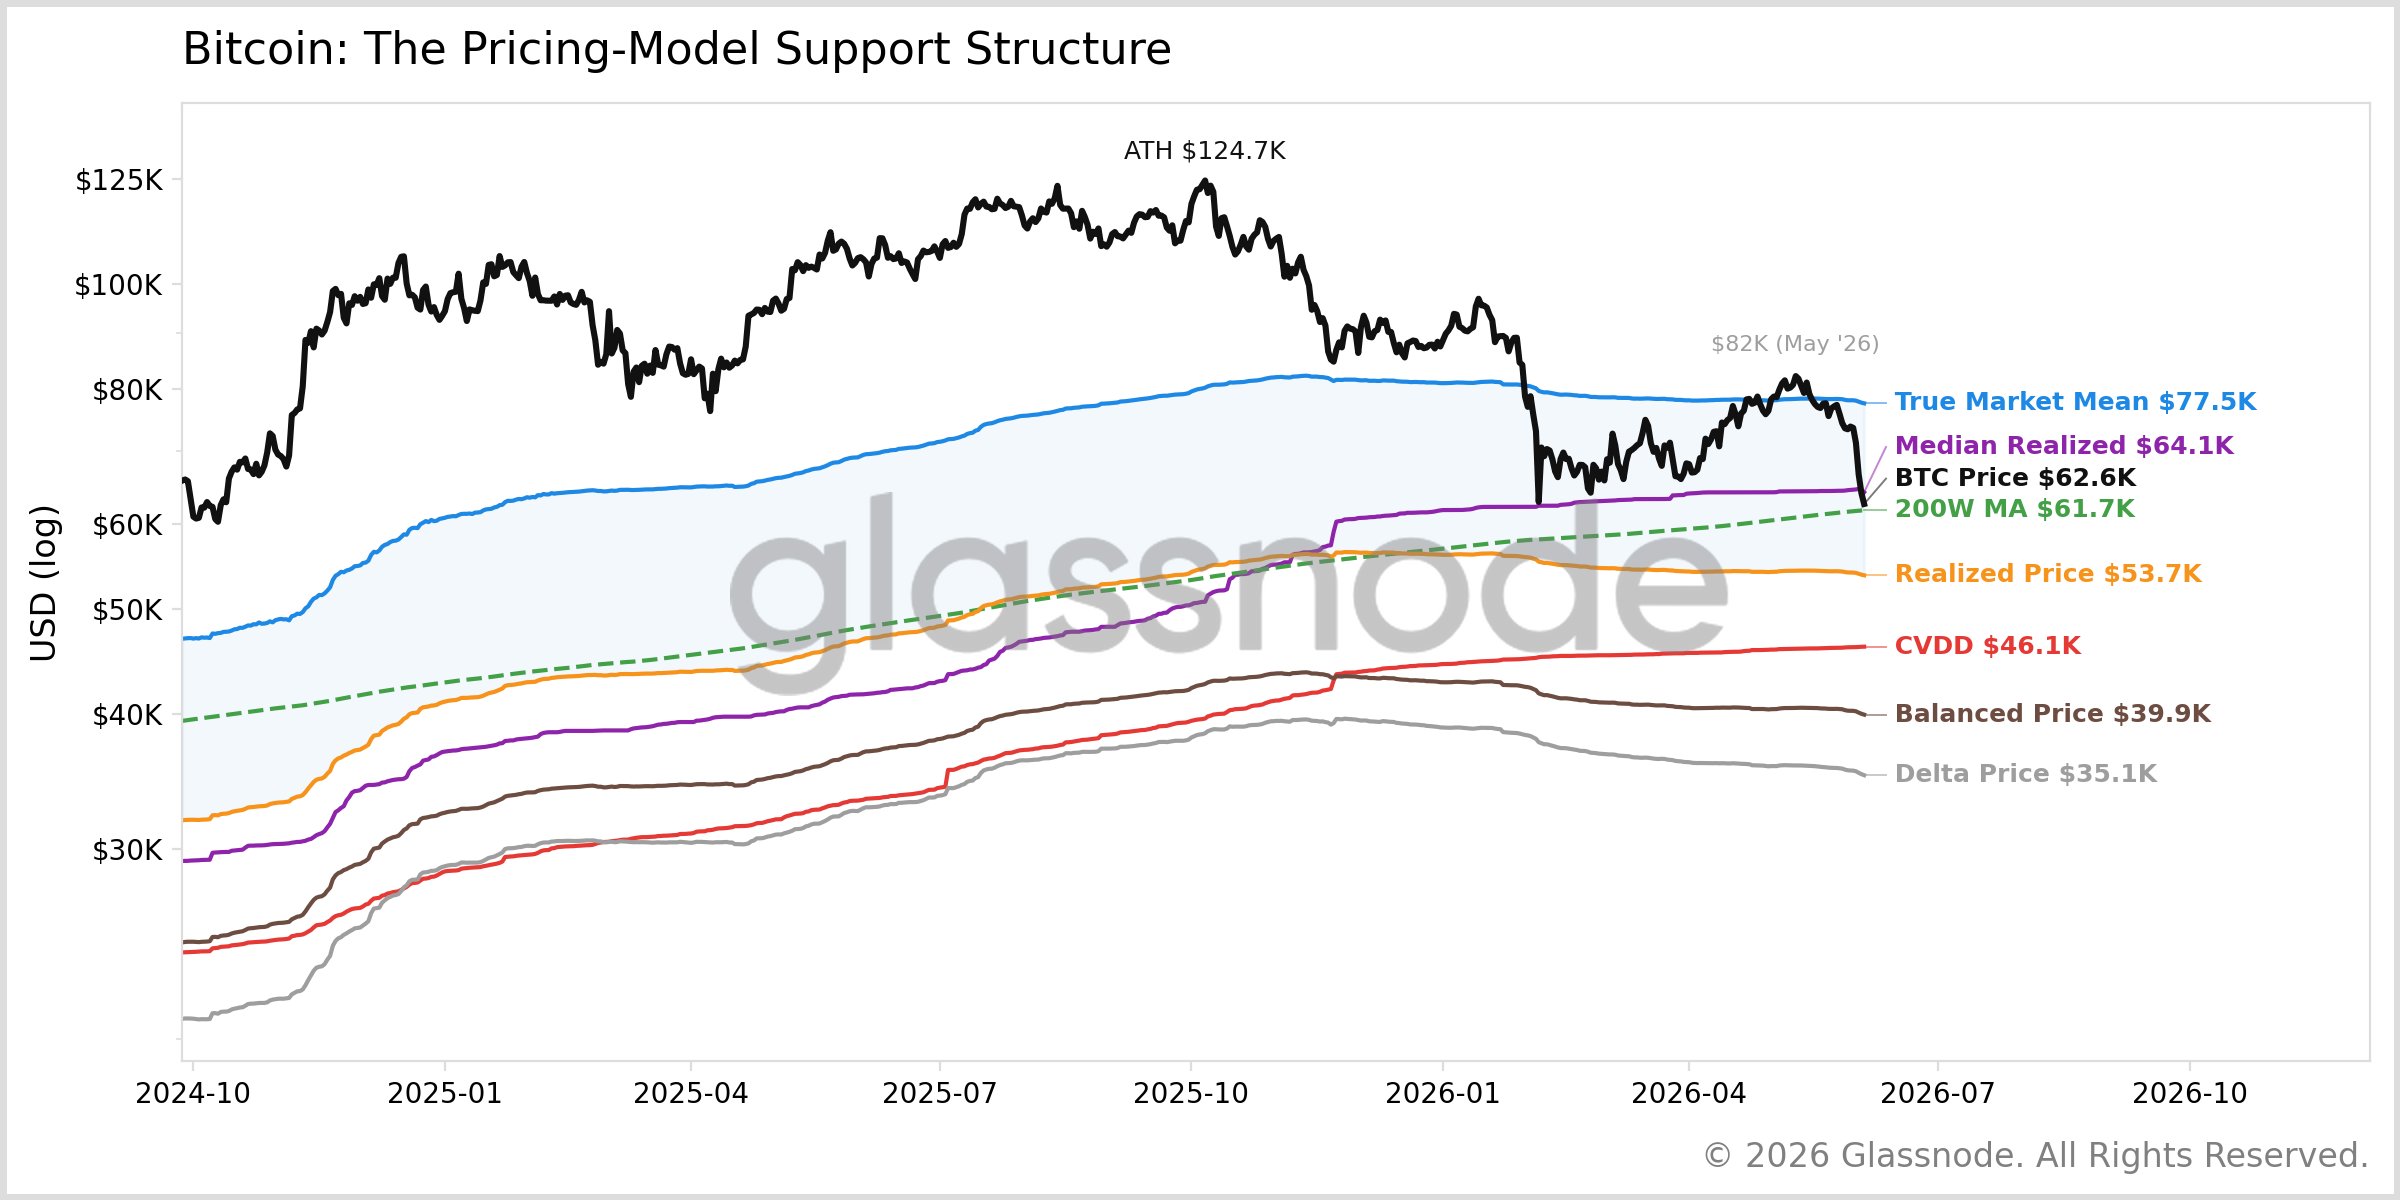 (Source: Glassnode)
Key confirmation data cited in Rafael’s analysis:
Median realized price: about $64,100 (Bitcoin has fallen below this level)
200-week moving average (200wMA): about $61,700 (currently being tested)
Median holder realized P/L break-even line: this time, it is the first break since December 2022
Rafael’s Historical Cycle Drawdown Comparison
The maximum drawdown figures across Bitcoin’s historical cycles listed in Rafael’s analysis are:
Largest drops in prior bear-market rounds: approximately 85%, 84%, 77%, respectively
This round’s current drawdown: about 50% from the all-time high
Rafael said that based on historical data, Bitcoin’s cycle drawdown magnitude is gradually shrinking, which means the high-probability bottom is more likely to fall above the $46,000-$54,000 range. He also explained that market bottoms cannot be confirmed in advance; they can only be defined using probability bands and key support lines to identify potential bottoming signals.
FAQ
How was the $4.6-5.4 bottom zone estimated by Rafael derived?
In his analysis on X, Rafael said that this bottom zone is based on his multi-layer on-chain pricing framework, which has mapped to actual bottom areas multiple times across several past cycles. He also noted that market bottoms cannot be confirmed in advance; this is a probabilistic analysis rather than an exact forecast. This is Rafael’s personal on-chain data analysis, not an official prediction from the Glassnode platform.
What does it mean when Bitcoin breaks below the median realized price?
Rafael explained that the median realized price (about $64,100) represents the median holder realized P/L break-even line, and this break is the first since December 2022. Based on his historical analysis, each time Bitcoin falls below this line, it typically indicates the market is in a deep-loss state, and the odds of a rebound or bottoming increase significantly. This is Rafael’s historical observation, not a confirmation of future price action.
What is the “capitulation tail” event Rafael refers to?
Rafael said that the $35,000 to $40,000 range is the “capitulation tail” zone, which represents an extreme scenario outside the high-probability bottom range that would require an unusual macro event trigger. He said this is a rare occurrence and not his main prediction scenario.
