
Alright, let's cut through the noise and look at what actually happened with Bitcoin. It's been a wild ride, and not the fun kind.
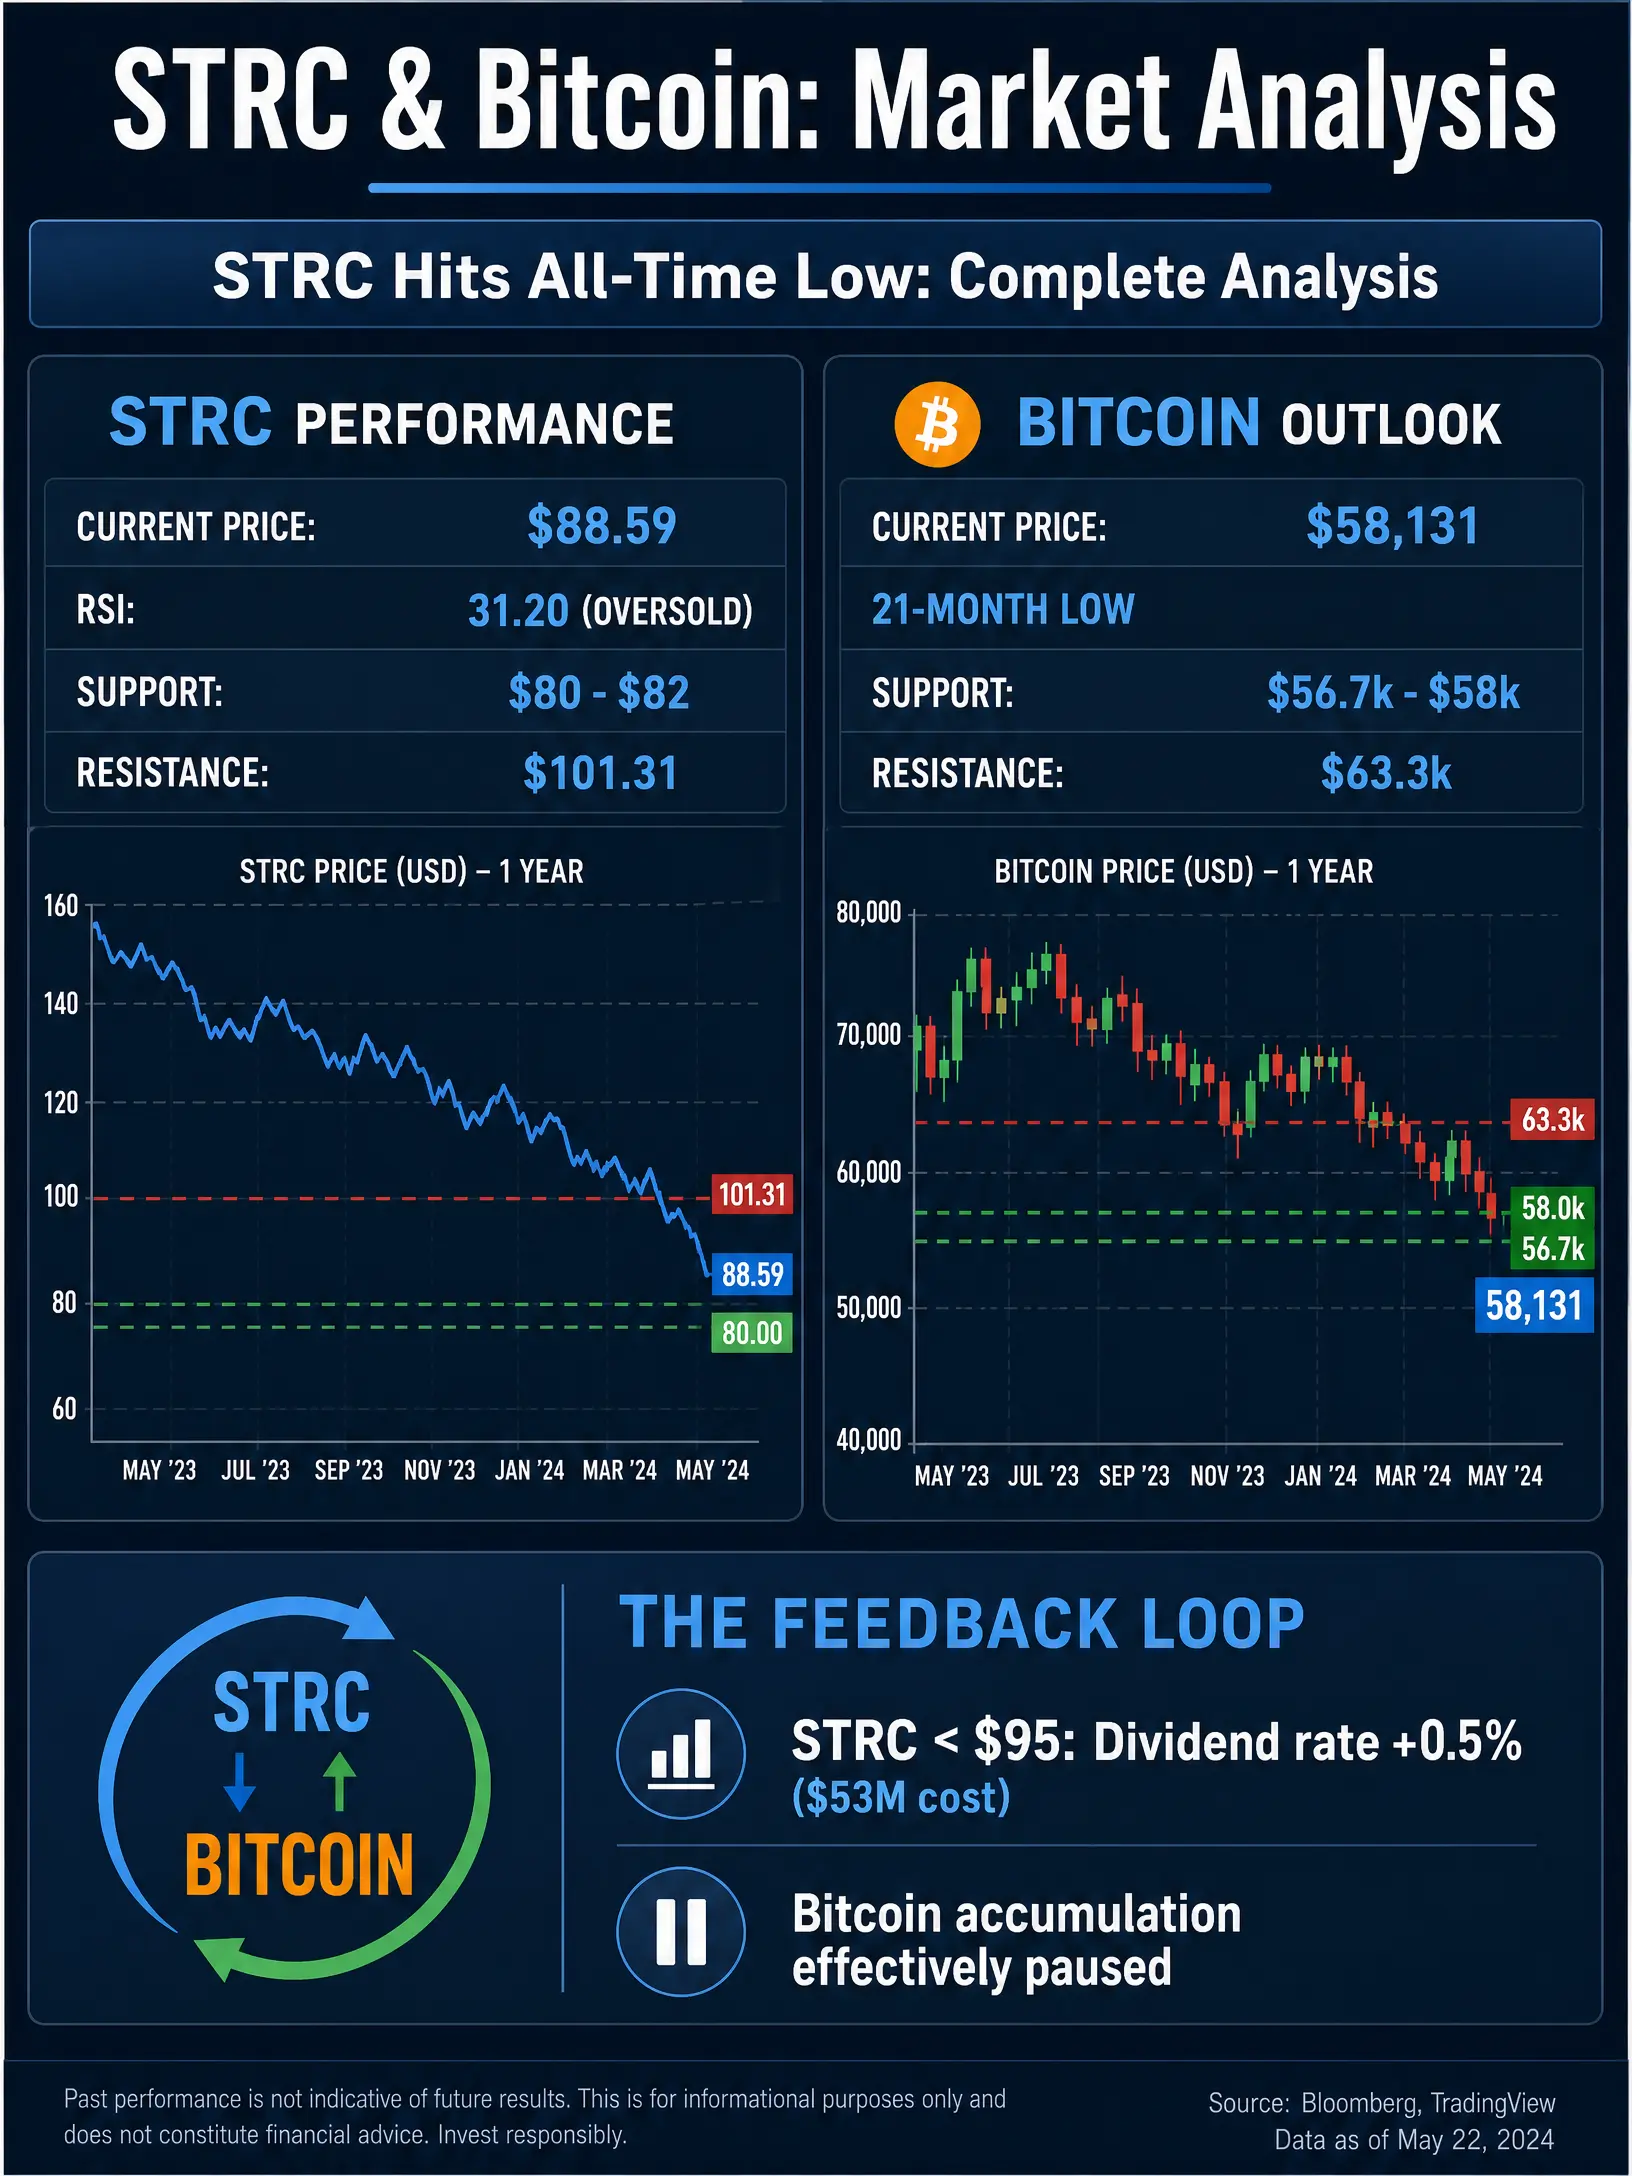
To get straight to it: the headline you saw about $58,000 was spot on for a moment during the chaos, but the dust has settled a bit. As of June 25th, Bitcoin is trading around $61,665, which is a bit of a rebound from that nightmare low. But it's still down about 4.2% for the week and is sitting more than 50% below its all-time high from last year.
So, what the hell happened? It wasn't just one thing; it was a perfect storm.
The Immediate Trigger: A Liquidation Cascade
The spark that lit the fire was a massive wave of forced selling. A ton of traders were heavily leveraged on long positions (betting the price would go up). When the price started to dip, it triggered a cascade of liquidations, forcing those positions to sell, which pushed the price down even further, triggering more liquidations. It was a brutal feedback loop. We're talking about a massive $1.27 billion to $1.5 billion in liquidations across the crypto market in just 24 hours. It was ugly.
The Structural Problem: ETF Outflows
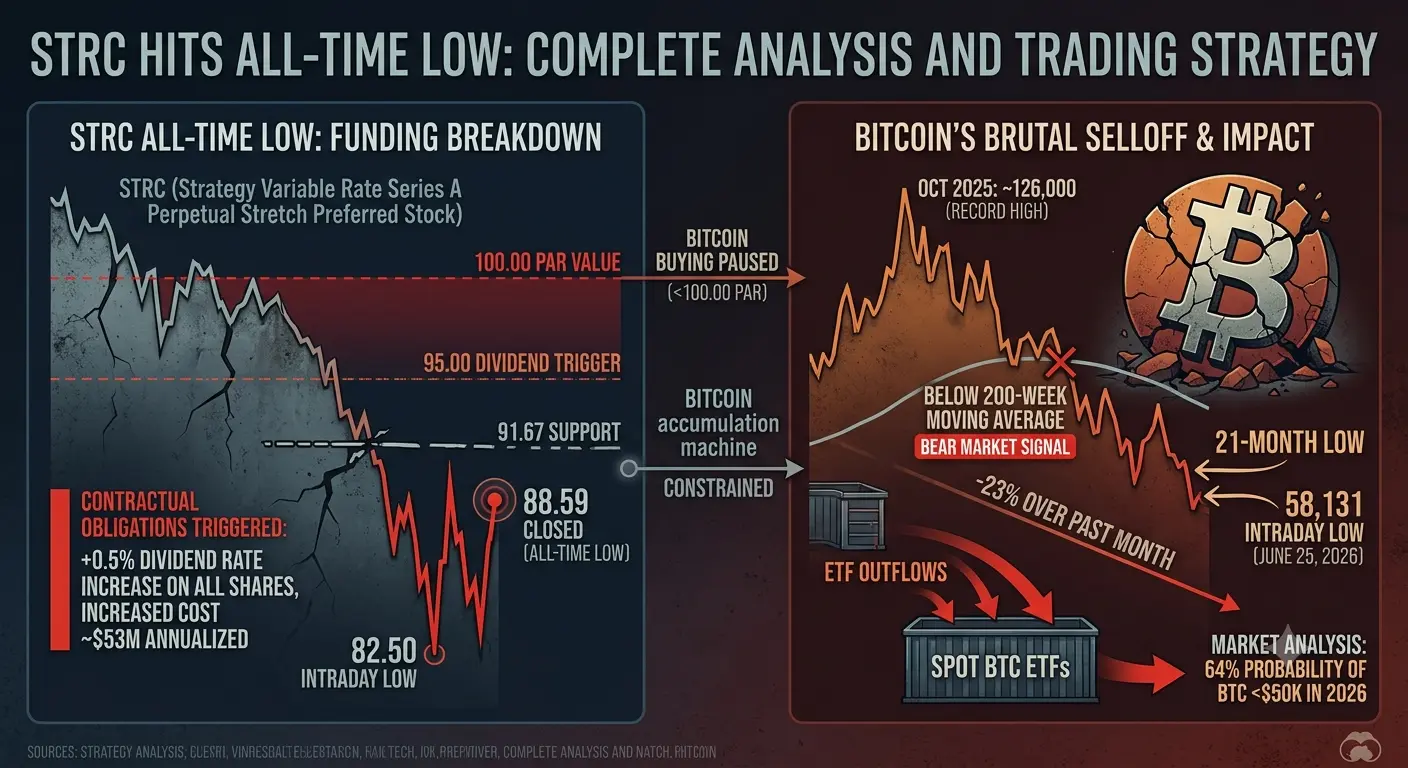
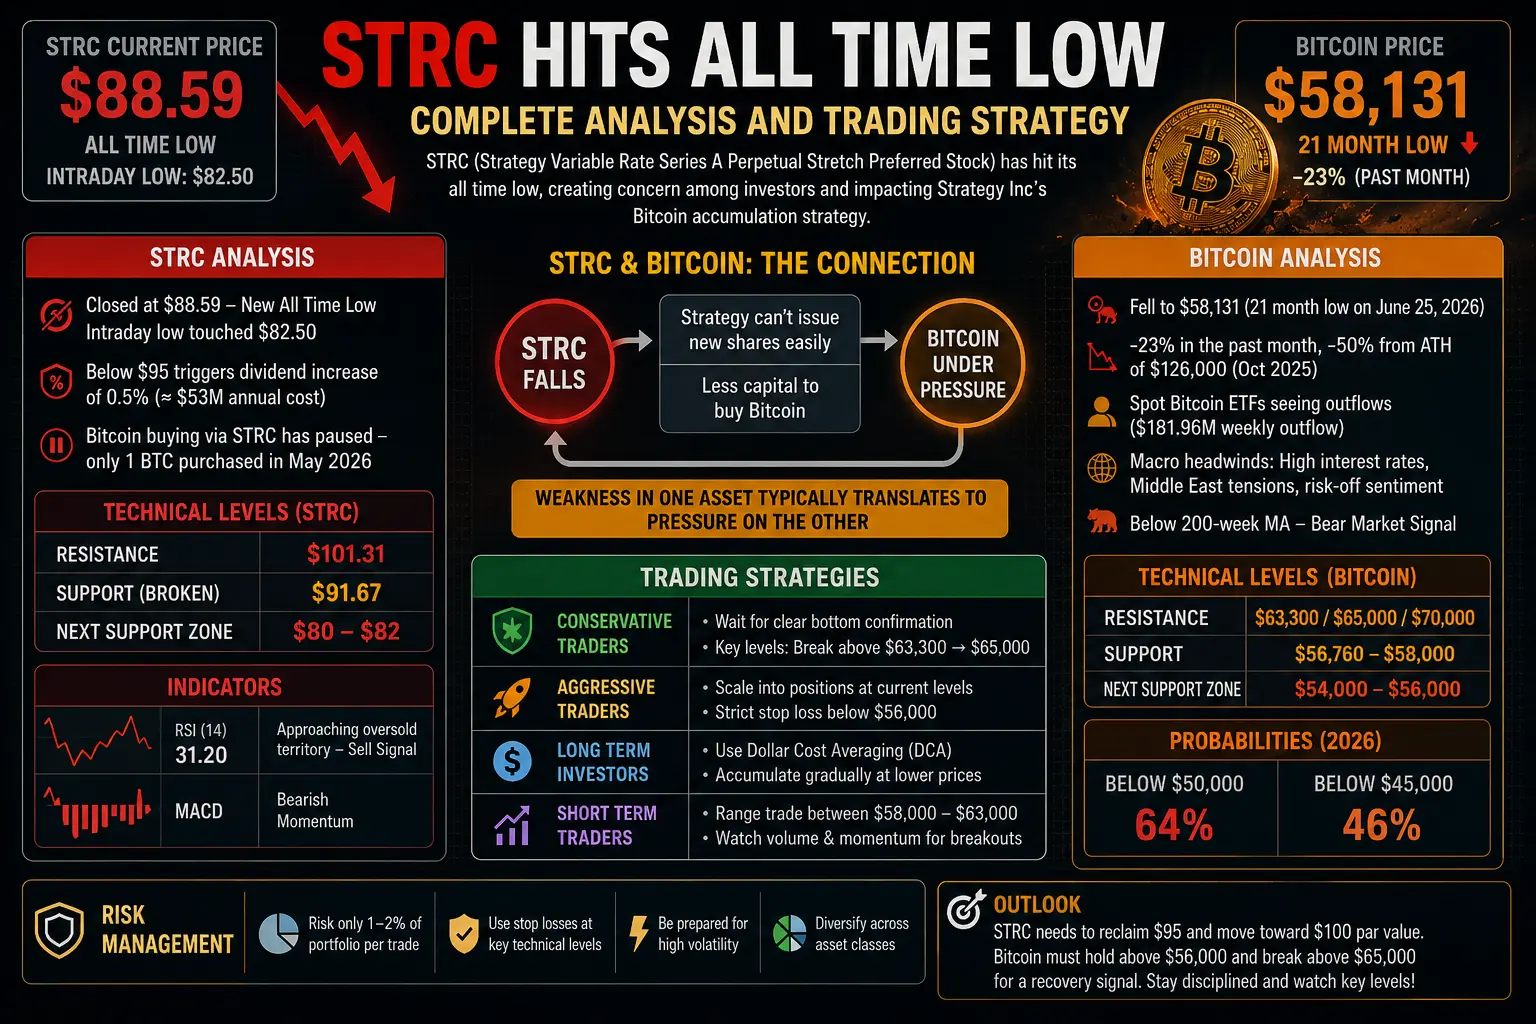
Underneath that flash crash is a slower, more worrying trend. U.S. spot Bitcoin ETFs have seen net outflows for seven straight weeks now, with one of the largest single-day withdrawals recently being around $459 million. This is the real headwind. It's institutional money walking away, draining a key source of demand and preventing any sustainable recovery.
The Macro Mess: Hawkish Fed and a Strong Dollar
You can't look at crypto in a vacuum. The macro environment is toxic for risk assets right now. The Federal Reserve has turned decisively hawkish, with some policymakers projecting rate hikes in 2026. This has sent the U.S. Dollar Index (DXY) surging to a 13-month high, and a stronger dollar is a classic headwind for Bitcoin. At the same time, crypto is selling off alongside AI and tech stocks, as they've become part of the same "risk-on/risk-off" institutional trade.
And Then There's the Supply Glut Looming
On top of all that, the market is staring down the barrel of some major potential supply overhangs. The creditors from the collapsed exchange are expected to start receiving around $9 billion in Bitcoin starting in July. The fear is that a lot of that will be sold into the market. At the same time, the German government has been transferring seized Bitcoin to exchanges, adding to the selling pressure.
Key Levels to Watch
So, where do we stand technically?
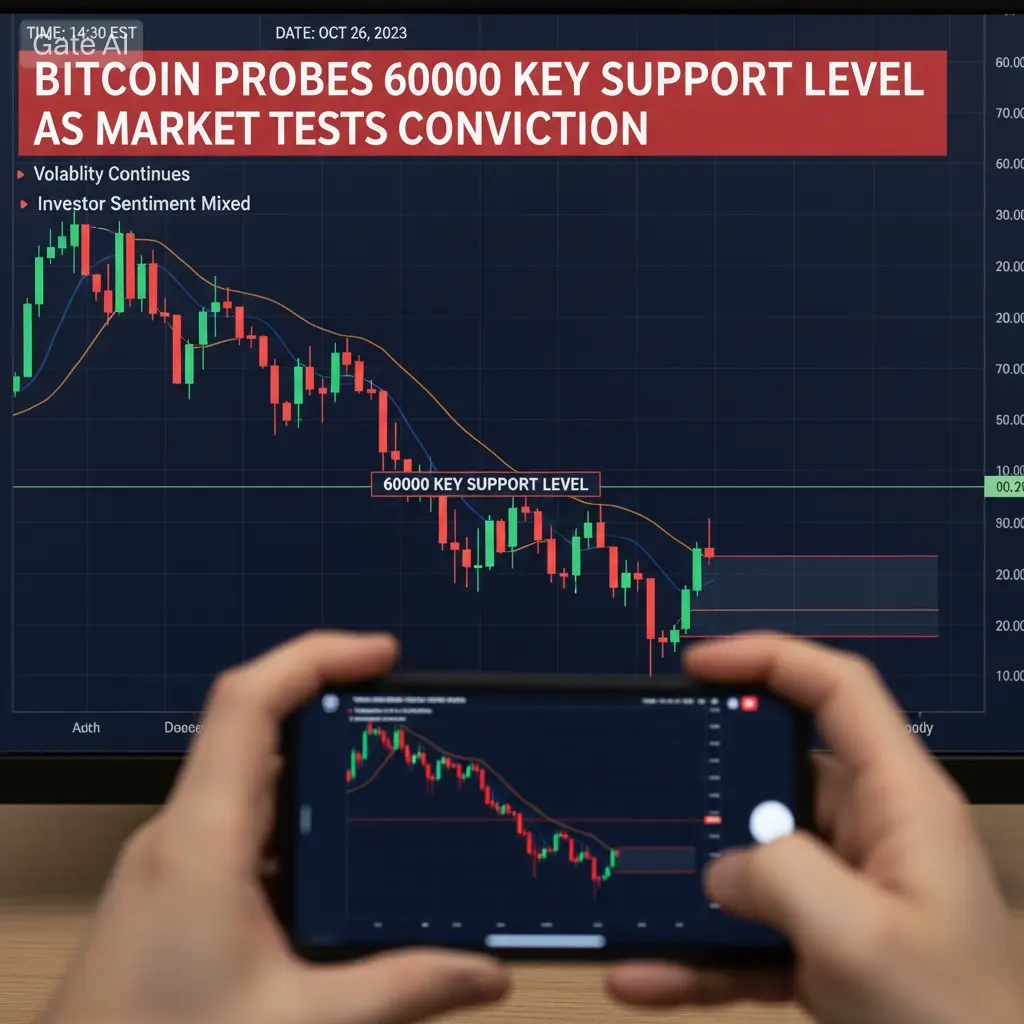
· Critical Support: The recent low around $59,000 is the most immediate level to hold. A break below that could open the door to a much deeper drop, with some analysts eyeing the $50,000-$55,000 range.
· Immediate Resistance: On the upside, Bitcoin needs to reclaim the $62,800 area first, with the more significant resistance zone sitting at $65,000. Until that happens, bounces are likely to be sold.
The market is in a state of extreme fear, and the path of least resistance still seems to be lower. While there are always dip-buyers and corporate accumulators like Strategy out there, they haven't been able to offset the heavy ETF outflows yet. It's a tough environment. Risk management is everything right now.
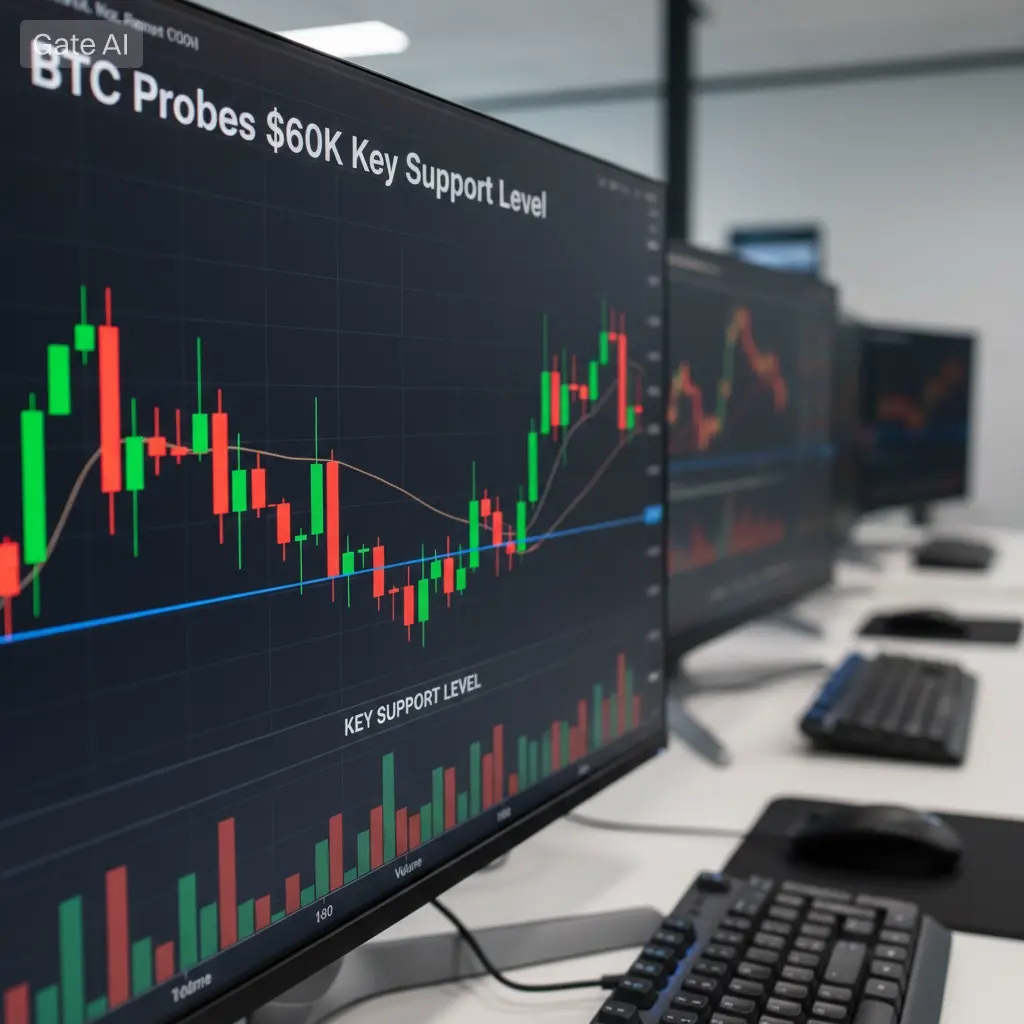
#BTCProbes60KKeySupportLevel
⚠️ Not financial advice.
To get straight to it: the headline you saw about $58,000 was spot on for a moment during the chaos, but the dust has settled a bit. As of June 25th, Bitcoin is trading around $61,665, which is a bit of a rebound from that nightmare low. But it's still down about 4.2% for the week and is sitting more than 50% below its all-time high from last year.
So, what the hell happened? It wasn't just one thing; it was a perfect storm.
The Immediate Trigger: A Liquidation Cascade
The spark that lit the fire was a massive wave of forced selling. A ton of traders were heavily leveraged on long positions (betting the price would go up). When the price started to dip, it triggered a cascade of liquidations, forcing those positions to sell, which pushed the price down even further, triggering more liquidations. It was a brutal feedback loop. We're talking about a massive $1.27 billion to $1.5 billion in liquidations across the crypto market in just 24 hours. It was ugly.
The Structural Problem: ETF Outflows
Underneath that flash crash is a slower, more worrying trend. U.S. spot Bitcoin ETFs have seen net outflows for seven straight weeks now, with one of the largest single-day withdrawals recently being around $459 million. This is the real headwind. It's institutional money walking away, draining a key source of demand and preventing any sustainable recovery.
The Macro Mess: Hawkish Fed and a Strong Dollar
You can't look at crypto in a vacuum. The macro environment is toxic for risk assets right now. The Federal Reserve has turned decisively hawkish, with some policymakers projecting rate hikes in 2026. This has sent the U.S. Dollar Index (DXY) surging to a 13-month high, and a stronger dollar is a classic headwind for Bitcoin. At the same time, crypto is selling off alongside AI and tech stocks, as they've become part of the same "risk-on/risk-off" institutional trade.
And Then There's the Supply Glut Looming
On top of all that, the market is staring down the barrel of some major potential supply overhangs. The creditors from the collapsed exchange are expected to start receiving around $9 billion in Bitcoin starting in July. The fear is that a lot of that will be sold into the market. At the same time, the German government has been transferring seized Bitcoin to exchanges, adding to the selling pressure.
Key Levels to Watch
So, where do we stand technically?
· Critical Support: The recent low around $59,000 is the most immediate level to hold. A break below that could open the door to a much deeper drop, with some analysts eyeing the $50,000-$55,000 range.
· Immediate Resistance: On the upside, Bitcoin needs to reclaim the $62,800 area first, with the more significant resistance zone sitting at $65,000. Until that happens, bounces are likely to be sold.
The market is in a state of extreme fear, and the path of least resistance still seems to be lower. While there are always dip-buyers and corporate accumulators like Strategy out there, they haven't been able to offset the heavy ETF outflows yet. It's a tough environment. Risk management is everything right now.
#BTCProbes60KKeySupportLevel
⚠️ Not financial advice.