#BTC
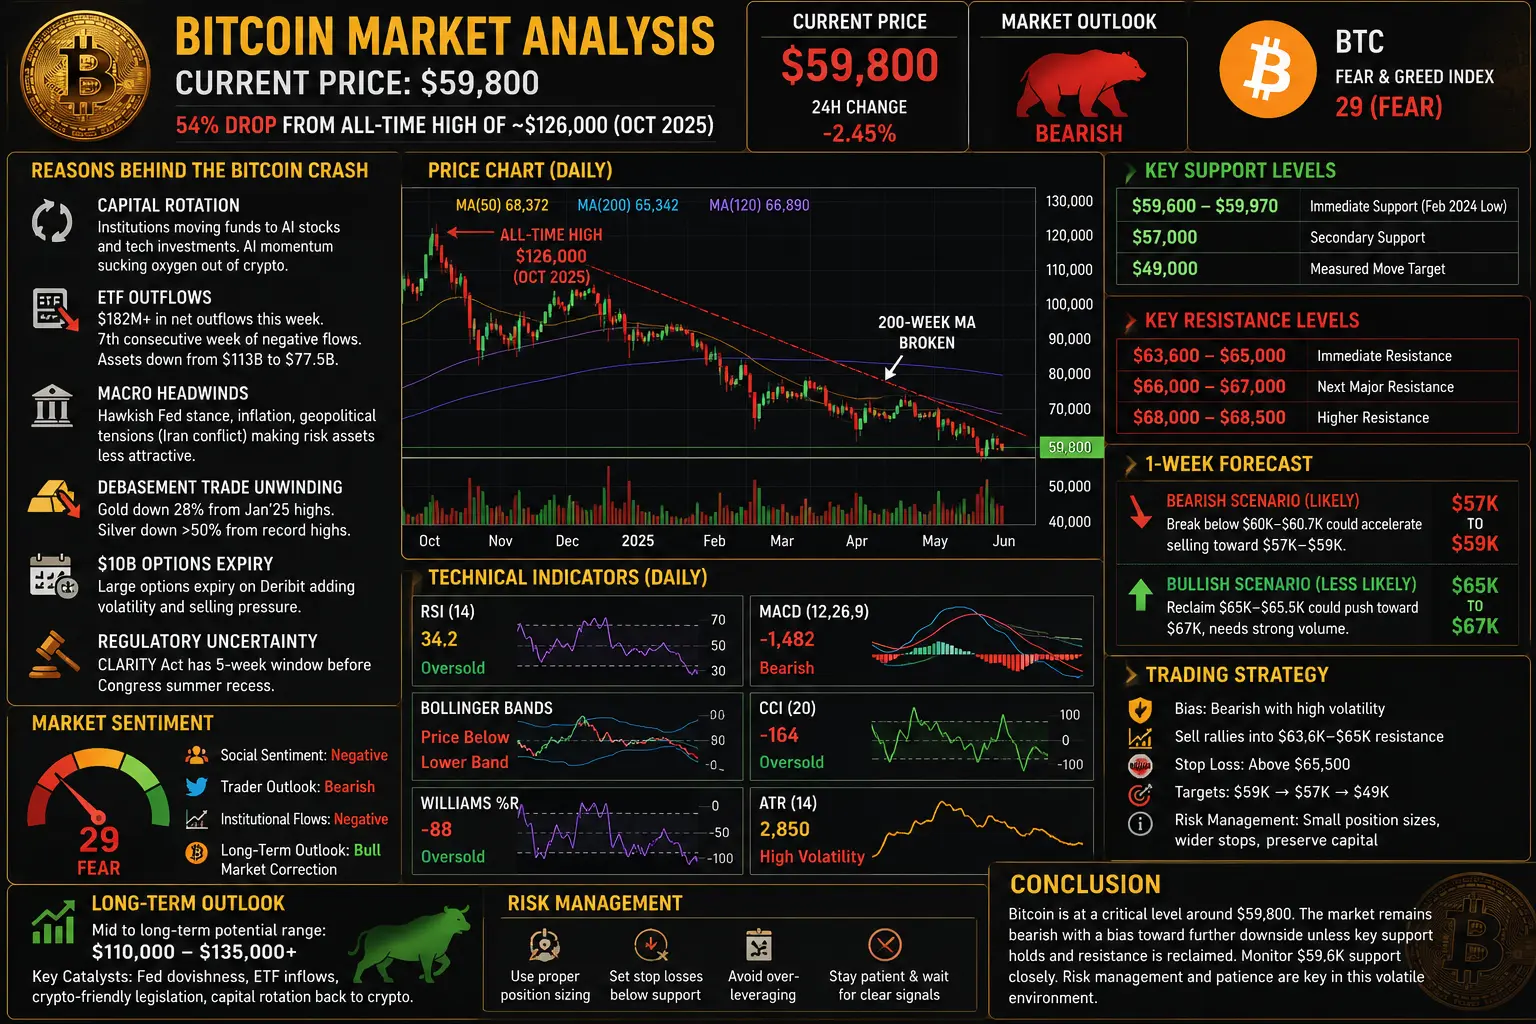
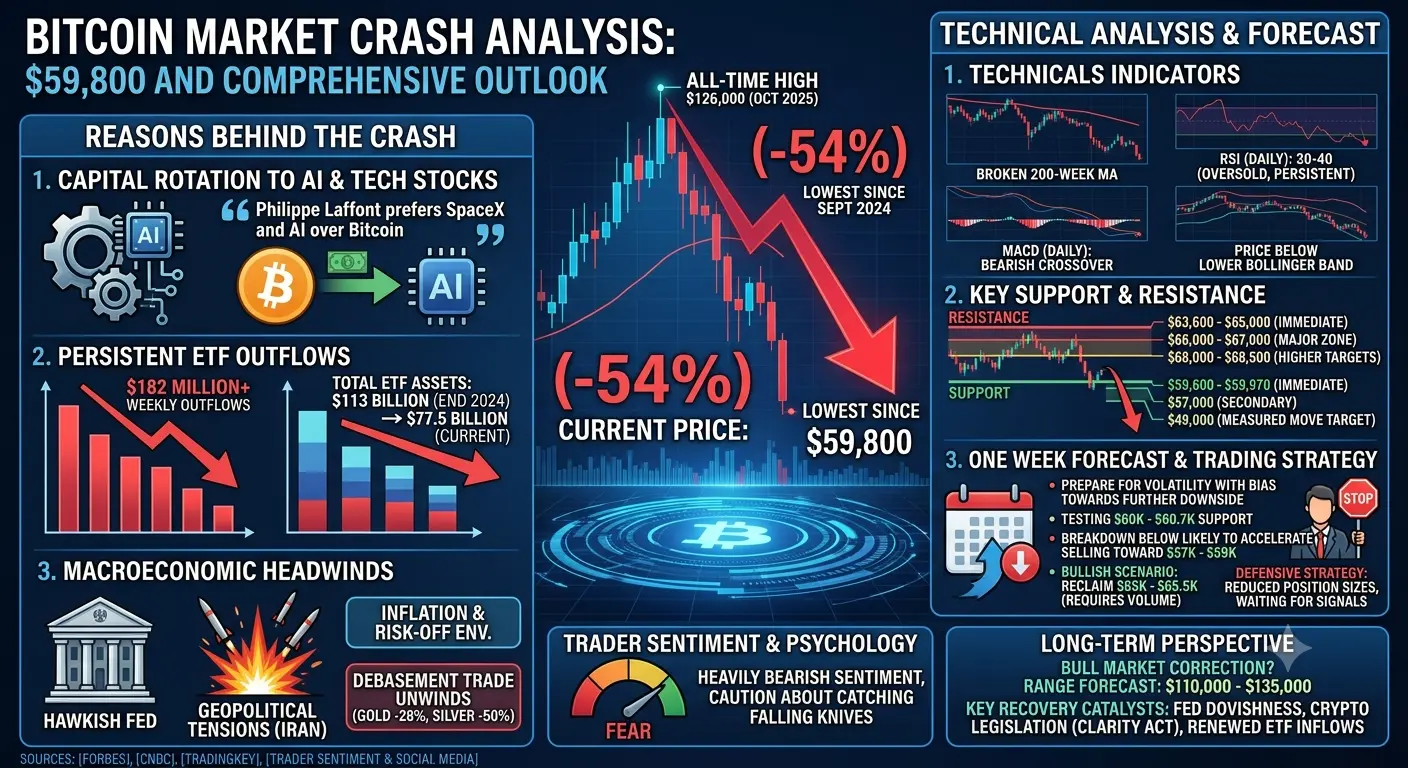
Bitcoin has experienced a dramatic decline over the past several months, with the current price hovering around $59,800, representing a staggering 54% drop from its all-time high of approximately $126,000 reached in October 2025. This correction has pushed Bitcoin to its lowest level since September 2024, creating significant concern among traders and investors about the cryptocurrency's near-term trajectory.
Reasons Behind the Bitcoin Market Crash
The Bitcoin crash can be attributed to multiple interconnected factors that have created a perfect storm of selling pressure. First and foremost, capital rotation has played a major role. Institutional investors have been shifting funds from cryptocurrencies into artificial intelligence stocks and other technology investments. Philippe Laffont, the billionaire founder of Coatue Management hedge fund, explicitly stated he would rather bet on SpaceX stock quadrupling over the next 20 years or AI-backed businesses than Bitcoin. This sentiment reflects a broader trend where AI momentum has been sucking oxygen out of the cryptocurrency room.
Another critical factor is the persistent outflow from spot Bitcoin exchange-traded funds. U.S. spot Bitcoin ETFs have recorded net outflows exceeding $182 million this week alone, marking the seventh consecutive week of negative flows. Total assets held in Bitcoin ETFs have plummeted from approximately $113 billion at the end of last year to just $77.5 billion currently. This institutional exodus has removed substantial buying support from the market.
Macroeconomic headwinds have also weighed heavily on Bitcoin. The Federal Reserve has maintained a hawkish stance due to inflationary pressures stemming from geopolitical tensions, particularly the Iran conflict. This environment has made risk assets less attractive to investors seeking safer havens. Additionally, the debasement trade that previously supported Bitcoin and precious metals has been unwinding, with gold dropping 28% from its January 2025 peak of $5,600 per ounce and silver falling more than 50% from its record highs.
The expiration of approximately $10 billion in Bitcoin options on Deribit has added further volatility to the market. Such large option expiries often trigger increased selling as investors close out positions or adjust their portfolios. The market structure bill known as the CLARITY Act faces a critical five-week window to clear legislative hurdles before Congress summer recess, adding regulatory uncertainty to the mix.
Technical Analysis and Key Levels
From a technical perspective, Bitcoin has broken below its 200-week moving average, which many analysts consider a signal of bear market conditions. The current price action shows significant weakness across multiple timeframes. The immediate support zone lies between $59,600 and $59,970, which corresponds to the February 2024 low area. If this level fails to hold, the next significant support emerges around $57,000, with some analysts pointing to $49,000 as a potential measured move target in a full correction scenario.
On the resistance side, Bitcoin faces immediate selling pressure between $63,600 and $65,000. The next resistance zone sits at $66,000 to $67,000, with higher targets at $68,000 to $68,500. Many technical analysts have identified head-and-shoulders patterns and descending trends on the charts, suggesting continued bearish momentum unless Bitcoin can reclaim key levels.
The Relative Strength Index has been hovering in oversold territory, which typically suggests potential for a bounce. However, in strong downtrends, oversold conditions can persist for extended periods. The Moving Average Convergence Divergence indicator shows bearish crossovers on multiple timeframes, with the 7-day moving average trading below both the 30-day and 120-day moving averages on 4-hour and daily charts. The Commodity Channel Index and Williams %R indicators are also flashing oversold signals, but price action has broken below the lower Bollinger Band at $59,999, indicating overall weakness rather than immediate reversal potential.
Will Bitcoin Fall Further
The probability of Bitcoin declining further remains elevated based on current market conditions. Several analysts have forecast potential drops to $55,000 before finding a sustainable bottom. The probability of Bitcoin falling below $50,000 in 2026 has jumped to 64% according to some market observers, while the odds of a move below $45,000 stand at 46%. These probabilities reflect the bearish sentiment dominating the market.
However, some factors could potentially stem the decline. Bitcoin's current bear market has been less volatile than previous crypto winters due to increased institutional participation and a larger, more liquid investor base. Sam Callahan from OranjeBTC noted that Bitcoin is not as volatile as in previous bear markets because the investor base has become more institutionalized. This structural change could mean smaller percentage declines even if the bear market continues.
One Week Forecast and Trading Strategy
For the upcoming week, traders should prepare for continued volatility with a bias toward further downside. The consensus view among market participants suggests Bitcoin will likely test the $60,000 to $60,700 support zone early in the week. A breakdown below this level could accelerate selling toward $57,000 to $59,000. Conversely, if Bitcoin manages to reclaim $65,000 to $65,500, a push toward $67,000 becomes possible, though this bullish scenario requires significant volume improvement.
The bearish view remains dominant, with most traders expecting resistance tests around $65,000 followed by pullbacks. A weekly close above $64,800 would be necessary to shift momentum toward a more neutral or bullish outlook. Until such a close occurs, the path of least resistance appears to be lower.
Traders are currently adopting defensive strategies, with many reducing position sizes and waiting for clearer signals before committing significant capital. Some experienced traders are looking for short-term bounces to fade, selling into rallies rather than buying dips. The head-and-shoulders pattern visible on multiple timeframes suggests measured moves could take Bitcoin significantly lower if the neckline breaks decisively.
Support and Resistance Summary
The critical support levels to watch are $59,600 to $59,970 as immediate support, followed by $57,000 as secondary support, and $49,000 as a potential measured move target. Resistance levels include $63,600 to $65,000 as immediate resistance, $66,000 to $67,000 as the next major zone, and $68,000 to $68,500 as higher resistance.
RSI and Technical Indicator Analysis
The Relative Strength Index on the daily timeframe has been hovering around 30 to 40, indicating oversold conditions but not yet reaching extreme levels that typically signal strong reversals. The weekly RSI shows more room for decline, suggesting the bearish trend could continue. The MACD histogram remains negative with the signal line above the MACD line, confirming bearish momentum.
The Bollinger Bands show Bitcoin trading below the lower band, which historically indicates oversold conditions. However, in strong downtrends, prices can remain below the lower band for extended periods. The Average True Range has been expanding, indicating increasing volatility which often accompanies major trend changes.
Trader Sentiment and Market Psychology
Current trader sentiment leans heavily bearish, with many market participants expressing caution about catching falling knives. Social media sentiment analysis shows predominantly negative outlooks, with fear and uncertainty dominating discussions. The Crypto Fear and Greed Index has been hovering in fear territory, which can sometimes precede bottoms but also reflects genuine concern about further declines.
Experienced traders are advising caution, suggesting that the current environment favors patience over aggressive positioning. Many are waiting for a clear break of the downtrend or a successful retest of broken support turned resistance before considering long positions. The risk-reward ratio for new long positions remains unfavorable until clearer bottoming patterns emerge.
Long-Term Perspective
Despite the current bearish conditions, some analysts maintain that Bitcoin remains in a bull market correction rather than having tipped into a prolonged bear market. The mid to long-term forecast from some observers suggests Bitcoin could trade in a range of $110,000 to $135,000 eventually, though the timing of such a recovery remains uncertain.
The key catalyst for any sustained recovery would likely involve a combination of factors including Federal Reserve dovishness, successful passage of crypto-friendly legislation, renewed institutional inflows into Bitcoin ETFs, and a rotation of capital back from AI stocks into cryptocurrencies. Until these conditions materialize, Bitcoin may continue to face headwinds.
Risk Management Considerations
For traders navigating this environment, proper risk management becomes paramount. Position sizing should reflect the elevated volatility and uncertainty. Stop losses should be placed below key support levels, and traders should avoid overleveraging in either direction. The current market conditions favor smaller position sizes and wider stops to account for the increased volatility.
Dollar-cost averaging strategies may appeal to long-term investors who believe in Bitcoin's fundamental value proposition, though even these strategies should be implemented with awareness that lower prices may be ahead. The key is to survive the current volatility with capital intact for when conditions eventually improve.
Conclusion
Bitcoin at $59,800 represents a challenging environment for traders and investors alike. The 54% decline from all-time highs reflects a combination of capital rotation, ETF outflows, macroeconomic headwinds, and technical breakdowns. While oversold conditions exist, the path forward likely involves continued volatility with a bias toward further downside until key support levels hold and resistance is reclaimed.
Traders should monitor the $59,600 to $59,970 support zone closely, as a breakdown could accelerate selling toward $57,000 or lower. Resistance at $63,600 to $65,000 must be reclaimed to shift the momentum. The coming week will be critical in determining whether Bitcoin can find a near-term bottom or if further declines are in store. Risk management and patience remain the most important tools for navigating this challenging market environment.
@Gate_Square #BTCProbes60KKeySupportLevel #GateStocks7x24Trading #TradFiCFDGoldMasters