ShanDingMediaGroup

vip
Age 0.2 Year
Peak Tier 3
No content yet
Technical Perspective (Key Levels)
• Short-term Resistance:
◦ First Resistance: $66,900 (20-day moving average)
◦ Strong Resistance: $70,000–$72,000
• Core Support:
◦ First Support: $62,000 (Recent low)
◦ Strong Support: $61,000–$58,000 (200-week moving average, the bull-bear dividing line)
• Pattern: Daily chart shows weak recovery, moving averages are bearish, rebound height is limited
Market Outlook (6.15)
• Short-term (1–3 days): Likely to fluctuate within the $62,000–$67,000 range, struggling to sustain a rebound
• Mid-term (1–4 weeks): Trend reversal requires breaking above $67,000 with
View Original
post-image
post-image
  • Reward
  • Comment
  • Repost
  • Share
Short-term (1–3 days): Slight rebound with oscillation leaning bullish, unlikely to see a large one-sided move.
◦ Very likely to fluctuate within the **$62,000–$66,000** range.
◦ Only if it stabilizes above $65,000 can it look toward $67,000; breaking below $62,000 means the rebound has failed.
• Medium-term (1–4 weeks): The main trend remains bearish, and rebounds are opportunities to short.
◦ Monthly decline of nearly 20%, the bear market structure remains unchanged.
◦ Key resistance zone is $68,000–$70,000; touching this area is a signal to short.
V. Trading Suggestions (Spot + Contracts)
45.40%
View Original
post-image
post-image
[The user has shared his/her trading data. Go to the App to view more.]
  • Reward
  • Comment
  • Repost
  • Share
Price: $63,700 USD, 24h volatility between $63,400–$63,900, extremely low amplitude.
• Moving Averages: Price broke below the 20/50-day moving averages ($67k/$71k), indicating a weakening medium-term trend.
• Sentiment: Fear and Greed Index at 13 (extreme fear), market remains cautious.
• Capital: Yesterday's net inflow into BTC spot ETF was $85.85 million, providing slight support but with limited strength.
• On-chain: Approximately $82 million liquidated in the past 24 hours, bears are dominant, selling pressure persists. #我的Gate交易时刻
BTC2.03%
View Original
post-image
post-image
  • Reward
  • Comment
  • Repost
  • Share
1. Macro: The US May PPI will be announced at 8:30 PM tonight, and inflation data will directly impact expectations for rate cuts and risk appetite.
2. Capital flow diversion: Today, SpaceX is listed on Nasdaq ($75 billion), with significant capital outflows, suppressing BTC rebound.
3. ETF outflows: Since mid-May, a total of $4.4 billion has flowed out, indicating cautious institutional sentiment.
4. Geopolitics: The White House denies rumors of a ceasefire between the US and Iran, and risk aversion sentiment has eased.
Three, technical analysis (key levels)
• Resistance: 64,200–65,000 (short
BTC2.04%
View Original
post-image
  • Reward
  • Comment
  • Repost
  • Share
3GT is really difficult; if you don't succeed, you won't earn any points. Just handle it as you see fit.
View Original
post-image
post-image
  • Reward
  • Comment
  • Repost
  • Share
Wow wow wow
View Original
SummitCapitalMvp
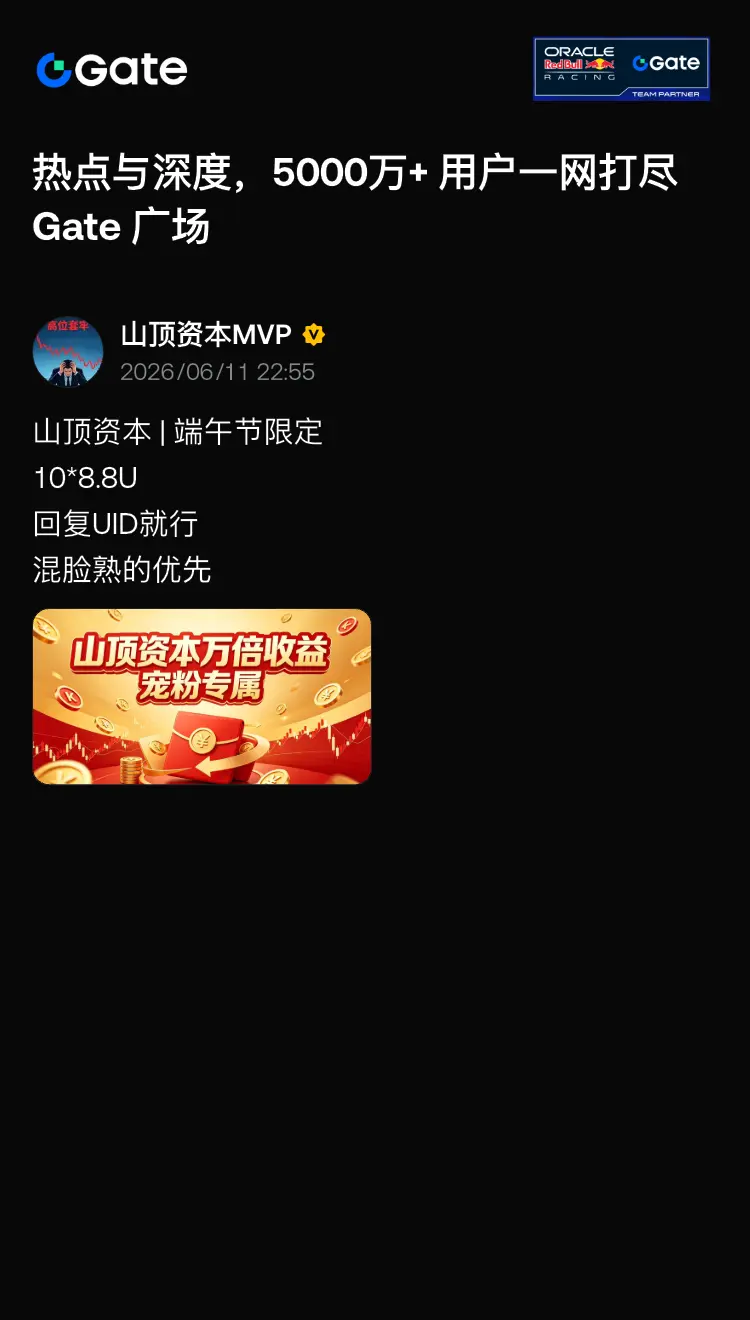
Mountain Peak Capital | Dragon Boat Festival Limited Edition
10*8.8U
Reply with your UID only.
Priority for familiar faces
repost-content-media
  • Reward
  • Comment
  • Repost
  • Share
  • Reward
  • Comment
  • Repost
  • Share
Key Price Levels (London Gold)
• Strong Resistance: $4180-$4220 (former support turned resistance)
• First Resistance: $4120-$4150 (intraday fluctuation range)
• Strong Support: $4030-$4000 (overnight lows + psychological level)
• Extreme Support: $3950-$3900 (medium-term correction target range)
Patterns and Indicators
• Long cycle (weekly/daily): Moving averages arranged in a bearish pattern, Bollinger Bands opening downward, MACD green histogram expanding, and the bearish trend is established.
• Short cycle (4 hours): Oversold; RSI is approaching 30. There is demand for a modest rebound, bu
View Original
post-image
post-image
  • Reward
  • Comment
  • Repost
  • Share
I've been trading on Gate for nearly three years, starting with a few hundred dollars to trade futures, and now I only do spot trading and low-leverage swing trading. The biggest change isn't the numbers in my account, but my understanding of the market.
When I first started, I always thought the market was full of opportunities, constantly looking for new coins and doing short-term trades, but the result was being repeatedly liquidated, losing half of my capital.
Later, I realized that the easiest mistake in trading is overestimating your abilities and underestimating the market risks.
View Original
post-image
  • Reward
  • Comment
  • Repost
  • Share
Bearish pressure (short-term dominance)
• Federal Reserve policy: U.S. inflation remains sticky, market delays rate cut expectations, high interest rates suppress gold prices.
• US dollar and US bonds: US dollar index strengthens, 10-year US Treasury yields remain high, bearish for gold.
• Technical breakdown: Break below the 200-day moving average, bullish confidence is shaken, triggering algorithmic sell orders.
Bullish support (medium to long-term bottoming)
• Central bank gold purchases: Continuous accumulation, setting a record high, forming a bottom support.
• Geopolitical safe-haven dem
USIDX-0.27%
GLDX0.74%
PAXG2.37%
XAUUSD2.90%
View Original
post-image
post-image
  • Reward
  • Comment
  • Repost
  • Share
Bearish (Suppressing Gold Prices)
• Federal Reserve rate hike expectations soar: May non-farm payrolls 172k (expected 85k), unemployment rate 4.3%; market bets on over 76% chance of rate hikes before December, 10-year U.S. Treasury yields surpass 4.5%, greatly increasing the opportunity cost of holding gold.
• U.S. dollar strength + capital outflows: U.S. dollar index rebounds, gold ETFs continue to redeem (net outflow of $2 billion in May), institutional funds shift to U.S. Treasuries.
• Persistent inflation + high oil prices: U.S. CPI remains high, Middle East tensions push oil prices higher
GLDX0.74%
PAXG2.37%
XAUUSD2.90%
USIDX-0.27%
View Original
post-image
post-image
  • Reward
  • Comment
  • Repost
  • Share
  • Reward
  • Comment
  • Repost
  • Share
Recent Trends
• 7 days: -14% to -18% (sharp decline earlier, strong rebound today)
• 30 days: -27% to -28%
• On June 6th, touched **$1,505** (the lowest point in nearly 2 months), then quickly rebounded.
Short-term Highlights
#预测NBA总冠军赢20,000U
• Resistance: $1,750–$1,800
• Support: $1,600, $1,550
View Original
post-image
post-image
  • Reward
  • Comment
  • Repost
  • Share
59,000–$59,100: Intraday low point—strong short-term support; if it breaks below, watch for $56,000.
2. $60,000: A round-number psychological level plus support; currently being tested repeatedly
3. $56,000: The Q4 2024 bottom; strong medium-term support
Resistance (from near to far)
1. $61,800–$62,000: The upper intraday trading range; weak resistance in the short term
2. $65,000–$67,000: First rebound target; a technical rebound rather than a trend reversal
3. $71,900: The 100-day moving average; the medium-term bull-bear dividing line
Indicator signals
• 4H RSI=26.59: Deeply oversold—strong
View Original
post-image
post-image
  • Reward
  • Comment
  • Repost
  • Share
Are you desperate? This kind of cryptocurrency
View Original
  • Reward
  • Comment
  • Repost
  • Share
1. Market Price and Intraday Trends
Yesterday, during the US session, linked to the weakness of US stocks and impacted by short-term whale sell-offs, Bitcoin broke through the key psychological level of 60k USDT, dropping to a low of 59,099 USDT, triggering a large-scale margin call liquidation; intraday in the Asian session, there was a slight recovery from lows, but with no volume, the rebound was weak, and the entire day’s trading range was 59,100 to 61,800, with short-term resistance around 61,000, fluctuating sideways.
24-hour trading volume shrank, the fear index at 29 indicates fear, an
BTC2.04%
View Original
  • Reward
  • Comment
  • Repost
  • Share
Daily chart level (major downtrend)
Price has completely broken below the 5/20/50/100-day moving averages, all moving averages are turning downward, forming multiple layers of resistance; Bollinger Bands are fully trending downward, with the price operating below the lower band; MACD below zero line with increasing green bars, indicating a clear medium-term downtrend with no reversal signals.
• Key resistance: first at 65,000 USDT, strong resistance at 67,000 and 70,000 USDT (former support turned resistance)
• Key support: short-term at 61,000-61,300 USDT (intraday low), with the ultimate psy
View Original
post-image
post-image
  • Reward
  • Comment
  • Repost
  • Share
  • Pinned