ThisIsTranslateContent:

vip
Age 0.6 Year
Peak Tier 6
Learn and Play | Diamond Hand
#认证创作者专属推广任务 AI predicts the World Cup
Yesterday afternoon, a "World Cup Prediction Human-Machine Battle" leaderboard refreshed my understanding. Twelve major AI models and fans predicted the 104 matches of this World Cup; after 15 matches, Baidu Wenxin leads with a 46.7% win rate.
46.7%—In the sport of football full of randomness, this is actually quite impressive. Why? Because football prediction is not a static problem. Team rankings, player injuries, tactical changes, referee standards, weather, even in-game mentality—each variable influences the outcome. If a model only searches throu
View Original
ThisIsTranslateContent:
#认证创作者专属推广任务 AI predicts the World Cup
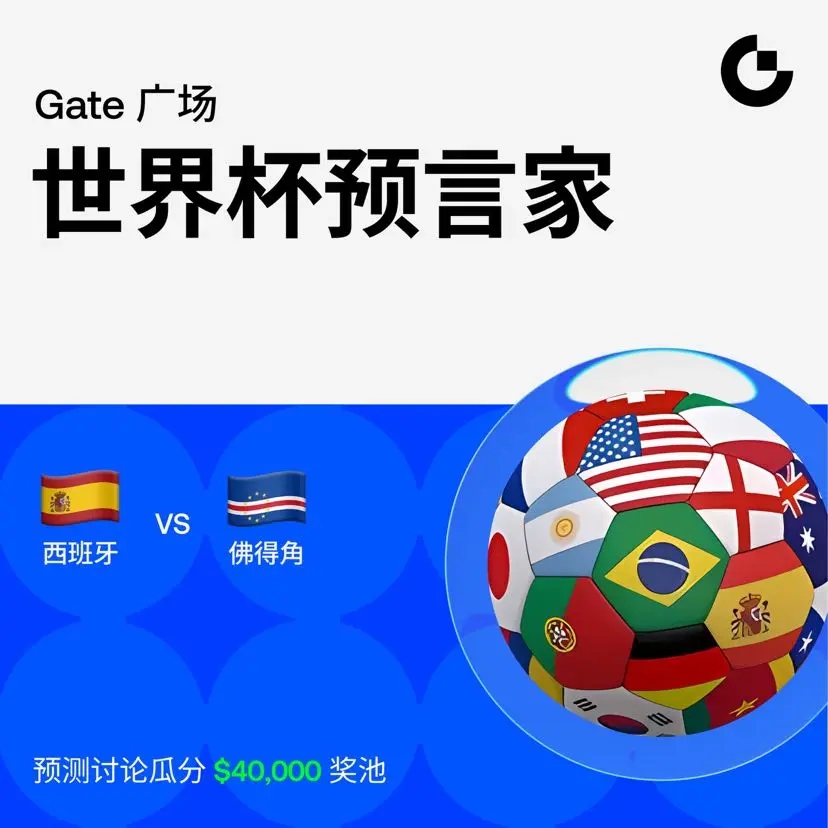
Yesterday afternoon, a "World Cup prediction human-machine battle" leaderboard refreshed my understanding. 12 major AI models and fans predicted this year's World Cup's 104 matches, and after 15 matches, Baidu Wenxin is temporarily in first place with a 46.7% win rate.
46.7%—In the sport of football full of randomness, this is actually quite impressive. Why? Because football prediction is not a static problem. Team rankings, player injuries, tactical changes, referee standards, weather, and even in-game mentality—each variable influences the outcome. If a model only searches through data and then gives a "safe" answer, it can easily become mediocre.
What does this have to do with the bamboo shoot industry?
A lot. AI can predict football, and AI can also predict bamboo shoots—this is no joke. Over the past year, we've seen many cases of AI empowerment in the bamboo industry: Yangzhu Technology developed bamboo-based express packaging with a 95% degradation rate; Shuangqiang Technology invested 100 million yuan in deep processing pre-made bamboo shoot dishes; Ji'an City uses AI to assist bamboo farmers in estimating forest yield benefits...
What happens when AI "understands" bamboo shoots?
Imagine a scenario: satellite remote sensing + meteorological data + soil sensors → AI model predicts this spring's bamboo shoot quantity and quality → processing companies lock in purchase prices 3 months in advance → logistics chain for fresh bamboo shoots automatically matches the best cold chain → retail prices are precisely set before harvest. This is not science fiction. The tea industry already uses AI to predict the yield and price of Longjing before Qingming, and the seafood industry uses AI for dynamic fish school pricing. Bamboo shoots, as one of China's largest under-forest economic crops, why not?
Back to football. What does a 46.7% predicted win rate mean?
It means AI has approached a critical point—it may not always "guess right," but its decision-making framework is more stable than humans. When it's time to buy high, it won't hesitate; when it’s time to cut losses, it won't hold onto illusions. Isn't this exactly what we need in investing and business? Like the growth of a bamboo shoot: its direction is always upward, but it encounters stones, drought, and pests along the way. AI is the one helping us see through the soil.
AI won't replace bamboo farmers, but bamboo farmers who use AI will definitely outcompete those who don't.
repost-content-media
  • Reward
  • 37
  • Repost
  • Share
Sakura_3434:
LFG 🔥
View More
#预测世界杯西班牙VS佛得角
The eye for detail is so sharp! 👑
Compared to those blowout matches where people predict 3-0, 4-0, I am more confident this will be a tight battle of "winning the game but not the spread."
Cape Verde will definitely set up a five-back fortress, with fierce physical confrontations. The bullfighters will find it tough to bite into this hard bone, and they must always be on guard against counterattacks. 🛡️
A 2:1 or 3:1 scoreline hits the perfect spot of "winning the game and covering the spread"! On one side is the aesthetic of passing football, on the other the resilience of Af
View Original
post-image
post-image
  • Reward
  • 43
  • 3
  • Share
HighAmbition:
LFG 🔥
View More
Watching ETH for a full two and a half months, from the beginning of April at $2462 all the way down to now $1504 👀
Even if the dips are tempting in between, I haven't taken a single shot. Strictly follow the discipline: only short, no bottom-fishing. 🚫📈
The big cycle is being crushed tightly, $1700–1750 can't break through effectively, all rebounds are treated as false signals. 🧱
Looking at this month's candlestick chart, a large bearish candle controlling the market, moving averages (MA5/MA10) dead cross downward, a classic bearish arrangement. 📉
The plan moving forward is simple:
• If
ETH-2.33%
View Original
post-image
  • Reward
  • 53
  • 3
  • Share
cryptoStylish:
good information
View More
观马斯克与SpaceX上市之势,易象昭然。乾卦九五:“飞龙在天,利见大人。” 马斯克以星舰为翼、星链为云,正当九五天位,乘时代气运,万众景从,是“见龙”已成“飞龙”,IPO之涨,合乎乾德刚健、顺势而兴。
然发行价135而场外已喊165,兑为泽、为悦,悦极则溢;乾之上九紧接九五,已是“亢龙有悔”之警。火天大有、泽火革并现,机构抢筹、低流通、被动基金锁价,恰似“风雷鼓荡、金火相烁”,暴利与剧震同途。
易曰:“观乎天文以察时变,观乎人文以化成天下。” 今之涨,是时与位俱得;然《系辞》戒“知进退存亡而不失其正”,龙飞极处,不可忘渊。SpaceX此涨,乾道乃革,火在天上——盛极之处,仍须留一分敬畏。⚡🐉📈
ThisIsTranslateContent:
#Gate直通IPO认购SpaceX SpaceX hasn't opened for trading yet, but the market has already priced in $165! Tonight, SPCX will list—go short or go long, all in!
Many people think SpaceX is just selling rockets, but actually, SpaceX is selling something else: orbital transportation, satellite internet, AI computing power, power infrastructure, and future lunar logistics networks. This is the first time the capital market has put the "space economy operating system" on an exchange.
In fact, Wall Street is the first to price future lunar bases, Mars colonization, orbital data centers, and AI infrastructure. Just as the world waits for SpaceX to ring the Nasdaq bell, a mysterious account called "wenyu8888888" suddenly bets all $5.7 million on the table. Not going long, but going all-in short. The shorts believe that $17.5 trillion is the price paid in advance for 2032; the longs believe that once Starship succeeds, SpaceX in 2032 cannot be valued with today’s business model.
Based on publicly available information, SpaceX’s IPO subscription multiple is about 4 times, making it a historically hot IPO, but not reaching some market rumors of 10 or 20 times. Some jokingly call it the biggest "fundraising case" in history! Although the final IPO price was set at $135, the market the night before already provided a higher price anchor—$165! This figure is not from the company’s official guidance but verified by Wall Street analyst target prices and off-market trading prices.
Renowned tech analyst Pierre Ferragu gave a target price of $165, with some institutions even seeing $190. On prediction markets and derivatives trading platforms, SpaceX-related contracts traded between $163 and $167 at times.
Meanwhile, the IPO subscription exceeded four times the offering size, showing strong institutional demand. Before SpaceX officially listed, many asset management firms had already launched related investment and leveraged products, even plans for 2x long SpaceX ETFs. Such phenomena are rare in IPO history, indicating that Wall Street is already building a complete investment ecosystem around SpaceX.
Historically, oversubscription of over 4x combined with leveraged positioning often signals market expectations of significant first-day premium potential. Therefore, investors’ focus has shifted from whether $135 is expensive to whether SpaceX can break through $160 and challenge higher valuations. At $165, the company’s market cap would surpass $2 trillion. The capital market’s bets are no longer just on rocket launches but also on Starlink’s global communication network, orbital AI infrastructure, and the lunar and Martian economies enabled by Starship.
In a sense, $135 is the issuance price set by investment banks, while $165 is the market’s first public pricing of the future space infrastructure era.
SpaceX’s IPO priced at $135, with an estimated valuation of about $1.75 trillion, where the key variable isn’t fundamentals but extremely low free float (about 4.3%). About 15 trading days after listing, a critical milestone occurs: on July 7, Nasdaq 100 will be officially included, along with CRSP/FTSE indices, which will require passive funds to adjust their holdings based on free float, creating an $80–$17.5k buy-in impact. With the free float locked, this phase theoretically creates a "chips vacuum + passive fund squeeze," amplifying short-term price elasticity.
The second key milestone is around late July (July 22 or 29), two days after Q2 earnings, triggering the first about 30% early shareholder lock-up release. Since Musk himself owns about half and has a one-year lock-up period, actual tradable shares are compressed to about 10–15%. This stage shifts the market from "pure buy-driven" to "marginal supply-demand rebalancing," with increased volatility. These two milestones essentially form a time arbitrage structure of "passive index buying → liquidity vacuum → lock-up impact," rather than traditional fundamental valuation models.
Tonight, go short or go long? What’s your take?
repost-content-media
  • Reward
  • 40
  • Repost
  • Share
Ai_Power:
To The Moon 🌕
View More
🏔️🎋
🧧🧧🧧
🆔
🚀
SummitCapitalMvp
Mountain Peak Capital | Dragon Boat Festival Limited Edition
10*8.8U
Reply with your UID only.
Priority for familiar faces
repost-content-media
  • Reward
  • 38
  • Repost
  • Share
Ai_Power:
To The Moon 🌕
View More
🎥 Watching live streams while earning rewards, Gate really has nailed the Watch to Earn concept this time! 🔥
https://www.gate.com/zh-tw/activities/watch-to-earn
Just by watching live streams daily, checking in, and interacting, you can accumulate heat points to participate in lotteries, and there are leaderboard rewards to chase. It's perfect for free riders and active players alike! I just checked, and besides watching live streams, you can earn points by commenting, sharing, scheduling live streams, or even following orders. The activity features are quite rich.
With the current market行情 s
SPCX-7.05%
View Original
post-image
post-image
  • Reward
  • 43
  • 1
  • Share
Ai_Power:
To The Moon 🌕
View More
🔥 Live Lucky Draw Carnival Issue 23 is now live, World Cup benefits are here!
⚽ The World Cup heat is rising, and the rewards are also upgraded!
Participate in live interaction to join the draw: Inter Milan official jersey and Gate 2026 World Cup gift box
There are also 10 GT, 100 SHIB, $10 position experience coupons, lucky bags, and other prizes, 100% winning rate
🎰 Watch live streams to earn heat points, 80 heat points = 1 draw
📌 Easily complete every day:
✔ Watch live streams
✔ Comment and interact
✔ Share the live stream
✔ Complete follow-up tasks
🎁 World Cup special benefits
Sign in
GT-2.96%
SHIB-4.25%
View Original
post-image
  • Reward
  • 52
  • 2
  • Share
AdEmK:
Thanks for sharing
View More
#SpaceXIPOSeesStrongOversubscription
Point 1: SpaceX Is Bringing Its IPO — The Company Is Selling Shares to the Public for the First Time
After years of operating as a private company, SpaceX has officially filed for its initial public offering, marking one of the most significant financial events in modern history. An IPO is the process where a private company offers its shares to the general public, transitioning from private ownership to being listed on a public stock exchange. SpaceX plans to list on Nasdaq under the ticker SPCX, with its debut expected on June 12, 2026. The company set a
HighAmbition
#SpaceXIPOSeesStrongOversubscription
Point 1: SpaceX Is Bringing Its IPO — The Company Is Selling Shares to the Public for the First Time
After years of operating as a private company, SpaceX has officially filed for its initial public offering, marking one of the most significant financial events in modern history. An IPO is the process where a private company offers its shares to the general public, transitioning from private ownership to being listed on a public stock exchange. SpaceX plans to list on Nasdaq under the ticker SPCX, with its debut expected on June 12, 2026. The company set a fixed price of $135 per share, an unusual move since most IPOs offer a price range. SpaceX will sell 555.6 million shares, aiming to raise approximately $75 billion. This would make it the largest IPO ever recorded, far surpassing Alibaba's $25 billion IPO in 2014. The resulting valuation is approximately $1.75 trillion, which would immediately make SpaceX the seventh-largest company in the United States, placing it above Tesla at around $1.6 trillion. SpaceX represents the convergence of space exploration, satellite communications through Starlink, and artificial intelligence. The company generated $18.7 billion in revenue in 2025, with Starlink reaching 10.3 million subscribers and growing at 50 percent year-over-year.
Point 2: There Has Been Very High Demand from Investors
The demand for SpaceX shares has been extraordinary. As of June 5, 2026, SpaceX received approximately $150 billion worth of orders from investors, which is double the $75 billion the company is seeking to raise. Both institutional and retail investors are eager to own a piece of Elon Musk's space empire. Institutional investors including major asset managers, sovereign wealth funds, and pension funds participated in one-on-one meetings during the roadshow. The magnitude of demand tells us that the market views SpaceX as a rare opportunity to invest in a company that dominates launch services, operates the largest satellite broadband network through Starlink, and is pushing into advanced technology ecosystems. This demand is rooted in SpaceX's strong fundamentals: consistent revenue growth, operational profitability, and a clear path toward expanding revenue streams through global coverage, government and commercial contracts, and defense-related partnerships.
Point 3: More People Want to Buy Than Shares Available — This Is Oversubscription
Oversubscription occurs when total demand exceeds the number of shares offered. In SpaceX's case, the oversubscription rate is approximately two times, meaning investors placed orders worth roughly twice the value of all shares available. While a two-times rate might seem modest compared to smaller hyped IPOs, the context here is entirely different. SpaceX is raising $75 billion, an unprecedented amount. Having $150 billion in demand for the largest IPO in history is remarkable because any oversubscription involves staggering dollar amounts. Oversubscription has practical implications. Not every investor who wants shares will receive their full allocation. Underwriters allocate based on investor type, order size, and long-term investment intent. Institutional investors typically receive priority, while retail investors may receive only a fraction of what they requested. This creates a situation where many investors who fail to receive their desired allocation may enter the open market on the first day of trading, driving additional demand and potentially pushing the share price above $135.
Point 4: Strong Means This Demand Is Very High and Robust
The term strong emphasizes that the demand is not marginally above the offering size; it is decisive and powerful. Weak oversubscription might suggest tentative interest. Strong oversubscription indicates committed, firm demand from investors who genuinely intend to hold their positions. In SpaceX's case, the strength is evident in several ways. Orders came in rapidly after the roadshow began, indicating investors already knew they wanted exposure. Demand spans multiple investor categories, from sovereign wealth funds and institutional asset managers to individual retail investors, showing broad-based conviction rather than narrow enthusiasm. Demand persisted even as market conditions became volatile, with Bitcoin and other risk assets experiencing significant sell-offs during the same week. The fact that SpaceX demand remained strong amid broader market turbulence underscores that investors view SpaceX as a fundamentally different kind of asset, one that merits allocation regardless of short-term market fluctuations.
Point 5: This Shows Great Confidence and Interest in SpaceX in the Market
The strong oversubscription signals that the broader market has deep confidence in SpaceX's business model, leadership, and growth prospects. At the business level, investors believe that SpaceX's integrated ecosystem of launch services, satellite broadband, and advanced technologies will continue to generate accelerating revenue and profitability. Starlink has grown from a concept to over 10 million subscribers and multi-billion-dollar annual revenue. At the leadership level, confidence extends to Elon Musk, whose track record demonstrates an ability to build companies that redefine entire industries. At the strategic level, investors view SpaceX as a platform company, not merely a rocket manufacturer. The space economy is projected to grow significantly over coming decades, and SpaceX holds dominant positions in launch services, satellite communications, and space infrastructure. When large institutional investors commit capital at this scale, it creates a validation effect that encourages broader participation and strengthens overall market sentiment.
Point 6: This May Cause the Share Price to Rise After the IPO
When an IPO is strongly oversubscribed, the share price after listing often rises above the IPO price because unmet demand flows into the secondary market. Approximately $75 billion in demand that could not be satisfied through the IPO may seek shares on Nasdaq after listing, creating strong buying pressure on the first day and potentially for weeks afterward. SpaceX is offering only about 5 percent of its total shares, meaning the float is relatively small compared to total valuation. A small float combined with massive demand creates a supply-demand imbalance that can drive price appreciation. However, risks exist. Some analysts have warned that the valuation is extremely rich relative to current revenue, while others believe the growth trajectory and market dominance justify the premium. Whether the share price rises sustainably or becomes volatile will depend on how the market adjusts to valuation expectations and future growth performance.
Point 7: The Impact on the Cryptocurrency Market — How Big a Step for BTC and ETH
The SpaceX IPO's impact on the crypto market operates through multiple channels and represents a major crossover between traditional finance and digital assets.
The liquidity drain effect is the most immediate impact. Bitcoin and other cryptocurrencies experienced pressure as investors reallocated capital toward IPO participation. With tens of billions being raised, capital rotation from risk assets into equity markets has increased short-term pressure on crypto markets.
The Bitcoin treasury connection is also significant. SpaceX reportedly holds a substantial amount of BTC on its balance sheet, making it one of the notable corporate Bitcoin holders. This creates an indirect linkage between SpaceX performance and Bitcoin price movements, as changes in Bitcoin valuation can affect corporate financial reporting under modern accounting standards.
The tokenized IPO bridge is another development. Crypto platforms are beginning to explore tokenized exposure to IPO shares and derivatives tied to public listings. If successful, SpaceX could become a reference point for future tokenized equity models, bridging traditional finance and blockchain infrastructure.
The long-term structural impact includes increased institutional awareness of digital assets due to corporate Bitcoin exposure and broader financial integration. While short-term pressure on BTC and ETH has been visible due to capital rotation, longer-term implications may include stronger institutional adoption and expanded financial infrastructure linking equities and crypto markets.
In summary, short-term pressure on crypto markets reflects liquidity movement into IPO participation, while long-term effects could support broader institutional recognition and infrastructure growth across digital assets.
repost-content-media
  • Reward
  • 51
  • Repost
  • Share
CryptoSelf:
2026 GOGOGO 👊
View More
#分享美股交易赢英伟达股票
AMD Leads AI Tech Stocks Rebound
AMD surged strongly before the market open today, as of 18:05 Beijing time, pre-market gain +3.72%, at $182.60 (yesterday's close $176.05). Key driving factors include:
Product breakthroughs: Instinct MI400 series AI chips exceeded yield expectations, Microsoft Azure added 500k units order
Industry positive news: AI server shipments expected to increase 45% in Q2, institutions raised GPU market share to 32%
Capital rush: Semiconductor sector net main force inflow of $1.2 billion in a single day, hitting a new high this year
Technical indicator an
View Original
LittleGodOfWealthPlutus
#分享美股交易赢英伟达股票
AMD Leads AI Tech Stocks Rebound
AMD surged strongly before the market open today; as of 18:05 Beijing time, pre-market gain of +3.72%, trading at $182.60 (yesterday's close was $176.05). Key driving factors include:
Product Breakthroughs: Instinct MI400 series AI chips exceeded yield expectations, Microsoft Azure added 500k units order
Industry Positive News: AI server shipments expected to increase by 45% in Q2, institutions raised GPU market share to 32%
Capital Inflows: Semiconductor sector saw a net main force inflow of $1.2 billion in a single day, hitting a new high this year
Technical Indicator Analysis
Trend and Moving Averages:
Stock price gapped above the psychological level of $180, with 5/10/50-day moving averages in a bullish alignment
200-day moving average ($165) maintained a 45-degree upward angle, solidifying the medium-term upward channel
Momentum Indicators:
RSI surged to 67: approaching overbought territory but no divergence, healthy volume support
MACD red bars accelerating: slope of the fast line at 55 degrees, bullish momentum continues to strengthen
Volume-Price Structure:
Yesterday's volume: 62.28 million shares (28% above the monthly average), breakout accompanied by continuous large institutional orders
Pre-market
180

Accumulated buy orders in the 180–183 range reach 71%, with short covering hitting a monthly high
Key Support and Resistance Levels
Support:
$178.50: Gap upper edge + 5-day moving average resonance zone
$175.20: 50-day moving average and Fibonacci 23.6% retracement double defense line
Resistance:
$185.90: Year-to-date high (set in May 2026)
$189: Previous all-time high + maximum pain point resistance zone for options
Market Outlook
Short-term (1 week):
Expected to challenge the $185–188 resistance zone, key catalysts:
Wednesday Taipei Computer Show: MI400 chip performance data disclosed
Thursday US CPI data: Core inflation ≤3.0% will reinforce tech stock valuation recovery
Medium to Long-term (3 months):
Fundamental core drivers:
✅ AI chip overtaking: MI300X performance-to-power ratio surpasses Nvidia H100 by 15%, market share accelerating
✅ Data center explosion: EPYC processors' share in Amazon AWS exceeds 38%
⚠ Capacity bottleneck: TSMC CoWoS packaging capacity allocation may impact delivery
Trading Recommendations
Short-term traders:
Go long above $180, with stop-loss at $177.3 (exit if gap is broken)
Add positions after breaking $185.9, target $187–189, with stair-step profit-taking
Long-term investors:
Current valuation (PS 9.8x) below historical average, recommend layered deployment:
Current price $182.6 (6%)
Pullback to $178 (9%)
Deep correction to $172 (12%)
repost-content-media
  • Reward
  • 55
  • 2
  • Share
Ai_Power:
2026 GOGOGO 👊
View More
Post-NFP U.S. stock market outlook, the framework is quite detailed.
Currently, the data is too strong, and the rate cut expectations have been wiped out; in the short term, expect volatility at high levels. Holding cash without worry, AI hardware can withstand the pressure, software faces greater challenges.
Don't chase highs; wait for a pullback to key support levels before considering adding positions. High-dividend financials can be used as a shield first. As long as you don't make reckless moves in this market, protecting profits is winning; only by enduring can you see clearly.
Pure pers
NAS100-0.11%
View Original
ThisIsTranslateContent:
#分享美股交易赢英伟达股票 Panoramic Analysis of the Future Short- and Medium-Term Trends of U.S. Stocks (June 2026, After Non-Farm Payrolls Surpass Expectations)
U.S. Stock Market Analysis (Eastern US, June 4 | Beijing Time, Early June 5 Close): Extreme style divergence, Dow hits a record high
1. Current Core Background: Bullish long cycle intact, but a short-term adjustment window has emerged
Medium to long-term (quarter / half-year) trend remains unchanged
The AI-driven long bull structure since 2023 in U.S. stocks remains unbroken, with corporate profit centers relying on computing power, large models, and AI hardware/software continuously advancing; the soft landing foundation of the U.S. economy persists, with no signs of deep recession, and long-term capital allocation towards tech growth remains the main direction without reversal.
In the short term (1–4 weeks), from strong to consolidative digestion
The three major indices in May experienced continuous short squeezes, with nine consecutive weekly gains, accumulating substantial profit-taking; combined with May’s non-farm employment and wages significantly exceeding expectations, the rate cut expectations cooled sharply, U.S. Treasury real yields rose, high-valuation tech stocks faced valuation compression, and the market shifted from a one-sided rise to high-level wide-range volatility.
2. Key Macro Variables: Federal Reserve Rate Expectations (Determine Upside/Downside Space)
1. Expectations shift caused by non-farm payrolls: In May, new employment and hourly wages both exceeded market forecasts, switching market logic: the June and July FOMC meetings completely dispel rate cut possibilities; the full-year rate cut expectation has been compressed from 2–3 cuts to at most 1, with some institutions pricing in no cuts for the year; the 10-year U.S. Treasury yield stabilizes above 4.50%, and rising real yields directly suppress high P/E AI leaders.
2. Three interest rate scenarios corresponding to U.S. stocks’ movements
Most probable baseline scenario: Only one rate cut in the year (September), with U.S. Treasuries oscillating between 4.4%–4.6%, indices digesting at high levels. S&P 500 range: 7450–7650, NASDAQ: 26,500–27,300; AI hardware remains resilient, internet software shows weaker oscillation, value financials and high-dividend defensives outperform.
Bullish hawkish scenario (risk scenario): No rate cuts throughout the year, yields break above 4.6%, NASDAQ deep correction of 8%–12%, S&P 500 retreat of 5%–7%; large-scale capital shift from growth to banks, energy, and essential consumer staples with high yields.
Bearish dovish scenario (low probability): Future inflation rapidly declines
CPI/PCE continues downward, first rate cut in July, yields fall below 4.3%, NASDAQ surpasses 27300 again to reach new highs, AI sector fully restarts a major upward wave.
3. Sector Strengths and Weaknesses Pattern
(Future 1–2 months fixed seesaw)
1. Relative defensive mainline (volatility shelter for funds)
Banks, insurance, finance: high interest rate environment maintains high net interest margins, stable earnings, low valuation, minimal adjustment room;
Energy sector: Middle East geopolitical support keeps oil prices in the 92–97 USD range, cash flow and dividends of oil & gas companies remain robust; essential consumer and utilities
High dividend: defensive attribute, much less volatile than tech, suitable for bottom allocation in volatile markets.
2. High-level oscillation and clear divergence in AI tech (core contradiction of the market)
More resilient: AI hardware (servers, chips, storage, optical communication) companies like Dell, HPE, Micron, ARM, NVIDIA are on order performance realization tracks; even with valuation compression, the decline is limited, and institutions support after big drops;
Weaker oscillation: cloud software, internet platforms (Microsoft, Google, Amazon, Meta) with large prior gains and higher valuation premiums, less elastic during rising interest rates, weaker rebound compared to hardware;
Weak: consumer electronics, traditional semiconductors (Intel, Qualcomm) with flat demand for PCs and phones, losing share to new AI sectors, low investor attention.
3. Weak sectors
Real estate, long-cycle durable consumption, high interest rates suppress credit and housing/car demand, facing medium- to long-term pressure.
4. Key Technical Support and Resistance Levels
S&P 500 resistance: 7630–7650 (historical new high trapped selling zone)
First support: 7520; strong support: 7450 (the life line of this rally, breaking below signals medium-term weakening) NASDAQ resistance: 27200–27300; first support: 26700;
Strong support: 26300 (loss indicates a 10% level correction) Dow Jones resistance: 51400
Support: 50800, 50300 (blue-chip resilience strongest, smallest pullback)
5. Mid-term (3–6 months) Long-term Logic
AI capital expenditure is the profit ballast
Global enterprise computing power procurement and large model deployment continue to expand, tech giants’ revenue growth significantly outpaces traditional industries, long-term funds will not fully withdraw from tech; adjustments are mainly valuation repairs, not fundamental reversals.
Corporate buybacks and dividends support market bottoms
Major stock buyback programs by U.S. giants continue, dividend ratios remain stable, greatly limiting deep declines in indices, making a 20%+ bear market retreat unlikely.
External geopolitical shocks are pulse-like impacts
Middle East and Russia-Ukraine conflicts will only cause daily/weekly volatility, unable to change the main trend driven by earnings and interest rates.
6. Major Potential Risks
(Downside catalysts) Rebound in inflation (oil prices above 100, rising service prices), Fed signals to keep rate hike options open; commercial real estate, small bank credit bad debts expose, triggering localized financial liquidity tensions;
AI Q2 earnings guidance collectively downward, order shortfalls, group funds disintegrate; election policy uncertainties rise, corporate capital expenditure contracts.
7. Cyclical Operation Strategy Reference
Short-term (1–2 weeks): Do not open new positions chasing new highs, reduce positions at resistance levels; buy the dip in AI hardware and banking/energy value stocks in stages; control position size at 60–70%, avoid heavy holdings.
Medium-term (1–3 months): Adopt balanced allocation: 40% AI hardware leaders + 30% financial and energy defensives + 30% cash; increase tech positions if NASDAQ drops below 2630.
Long-term (over half a year): Continue deploying AI computing power across the industry during deep corrections; the foundation of the U.S. long bull remains, AI industry cycle not over.
The above is only a logical market analysis and does not constitute any investment or trading advice. $NAS100 $US50050
repost-content-media
  • Reward
  • 41
  • 1
  • Share
Ai_Power:
To The Moon 🌕
View More
Summit Capital | Fan Appreciation Exclusive
The investment has paid off—keep adding!
2*1888U
Just reply with your UID
Priority to those familiar faces
View Original
SummitCapitalMvp
Summit Capital | Fan Appreciation Exclusive
The investment has paid off, keep going
2*1888U
Just reply with your UID
Priority to familiar faces
repost-content-media
  • Reward
  • 37
  • 1
  • Share
cryptoStylish:
good information
View More
#分享美股交易赢英伟达股票 Based on the latest market data and industry trends, here is AMD's market analysis:
1 Overall Market Share and Growth Trends
In the first quarter of 2026, AMD's overall share in the x86 CPU market reached 32.6%, a 5.6 percentage point increase compared to the same period last year, setting a new record high. Excluding the mainboard SoC sector, the broad CPU market share was 30%, still higher than the previous quarter and the same period last year.
In the server CPU market, AMD EPYC processors accounted for 33.2% of shipments, with revenue share reaching 46.2%, demonstrating a
AMD5.21%
View Original
ThisIsTranslateContent:
#分享美股交易赢英伟达股票 Based on the latest market data and industry trends, here is AMD's market analysis:
1 Overall Market Share and Growth Trends
In the first quarter of 2026, AMD's overall share in the x86 CPU market reached 32.6%, a 5.6 percentage point increase compared to the same period last year, setting a new record high. Excluding the mainboard SoC sector, the broad CPU market share was 30%, still higher than the previous quarter and the same period last year.
In the server CPU market, AMD EPYC processors accounted for 33.2% of shipments, with revenue share reaching 46.2%, indicating a significant improvement in its competitiveness in the high-end server market.
2 Business Segment Performance
Data Center Business: Revenue reached $5.78 billion, a 57.2% increase year-over-year, becoming the core growth driver. Driven by AI inference and intelligent agent demand, the server CPU demand structure is growing structurally. AMD expects the server CPU market to exceed $120 billion by 2030, with the compound annual growth rate raised from 18% to over 35%.
Client and Gaming Business: The desktop market was affected by overall weakness, with AMD's share slightly declining, but the notebook market performed well, increasing from 22.5% to 28.3%. The Ryzen X3D series processors, with high gaming performance, became a key growth factor.
Embedded Business: Revenue grew by 6%, benefiting from demand in enterprise and industrial sectors. AMD's layout in the embedded market continues to deepen.
3 Competitive Landscape
Against Intel: In the server CPU market, AMD continues to erode Intel's share through the performance, efficiency, and cost advantages of EPYC processors. Intel's server CPU revenue share has fallen to 53.8%.
Against NVIDIA: In the GPU market, AMD's Instinct series GPUs (such as MI450) are gradually increasing volume, competing with NVIDIA. However, NVIDIA still holds 94% of the discrete graphics card market, while AMD accounts for only 6%.
4 Future Outlook and Risks
Opportunities: AI inference and intelligent agent applications drive CPU demand growth. AMD's dual-engine strategy of CPU + GPU is expected to further expand its share in data centers and enterprise markets. It is estimated that by 2027, annual revenue from data center AI business will reach several hundred billion dollars.
Risks: Competition in the GPU market remains fierce, with NVIDIA's technological and ecosystem advantages still prominent; tight memory supply may impact PC shipments in the second half of the year; if AI development underperforms, it could delay the growth in computing power demand.
Overall, AMD has established a leading position in the server CPU market, with steady growth in client and embedded businesses. However, it needs to address competition in the GPU market and supply chain challenges. Future growth potential depends on product iteration and ecosystem development. $AMD
repost-content-media
  • Reward
  • 49
  • 1
  • Share
Ai_Power:
To The Moon 🌕
View More
Nothing major over the weekend, just sorting out my thoughts.
Overall still somewhat weak, with the moving averages pressing down, 59100 looks more like a mid-way rest stop rather than a final destination.
Briefly sharing three thoughts:
1️⃣ Oversold conditions will lead to a small rebound, indicators need some repair, keep an eye on the 61500–62000 range above.
2️⃣ Don’t get too bullish on the rebound, many are trapped above, if volume can’t keep up, it’s a good opportunity to adjust your positions.
3️⃣ If the momentum is moderate, be mentally prepared around 57000, breaking below might lead
BTC-2.47%
View Original
post-image
  • Reward
  • 61
  • Repost
  • Share
Ai_Power:
2026 GOGOGO 👊
View More
#ShareYourUSStocksWinNvidia
#NVDA
Nvidia remains one of the strongest AI-driven momentum assets in global markets, supported by explosive demand for artificial intelligence infrastructure, high-performance GPUs, and data-center expansion cycles. On Gate, NVDA exposure through USDT-paired CFD products allows traders to participate in NVIDIA price movement directly inside a crypto-native trading ecosystem without requiring traditional stock brokerage infrastructure.
At the current moment, NVDA trades near 0.06761 USDT within a volatile but structurally bullish short-term range. Market behavior
Vortex_King
#ShareYourUSStocksWinNvidia
#NVDA
Nvidia remains one of the strongest AI-driven momentum assets in global markets, supported by explosive demand for artificial intelligence infrastructure, high-performance GPUs, and data-center expansion cycles. On Gate, NVDA exposure through USDT-paired CFD products allows traders to participate in NVIDIA price movement directly inside a crypto-native trading ecosystem without requiring traditional stock brokerage infrastructure.
At the current moment, NVDA trades near 0.06761 USDT within a volatile but structurally bullish short-term range. Market behavior continues reflecting strong AI-sector liquidity flow despite periodic profit-taking pressure across semiconductor stocks. The recent structure shows aggressive intraday participation combined with recurring pullback absorption, indicating that buyers continue defending higher support zones rather than abandoning momentum exposure.
The broader AI narrative remains the primary engine behind NVDA strength. Institutional capital continues rotating toward companies positioned at the center of AI infrastructure expansion, and Nvidia remains the dominant supplier of advanced GPU architecture powering large-scale machine learning systems, hyperscale cloud deployments, and enterprise AI acceleration.
From a technical perspective, the market structure remains constructive while volatility gradually compresses. Bollinger Bands are tightening on higher timeframes, often a precursor to sharp directional expansion. The daily MACD structure continues stabilizing above bearish exhaustion territory, while shorter intraday momentum indicators suggest temporary overbought conditions that could trigger shallow retracement before continuation resumes.
Volume behavior remains one of the strongest bullish confirmations in the current setup. Recent upward movement has been accompanied by improving participation rather than declining liquidity, indicating that capital inflow remains active. As long as price appreciation continues alongside healthy volume expansion, bullish continuation probability remains elevated.
Social and sentiment activity surrounding AI-sector assets has also accelerated sharply. Market discussion volume around semiconductor and AI infrastructure themes continues expanding as traders position for the next wave of technology-sector momentum. Relative performance versus broader crypto assets also remains strong, showing that NVDA-specific catalysts are currently overpowering general market drift.
The short-term outlook favors bullish continuation after controlled consolidation. If volatility compression resolves upward, the first target becomes recovery of recent swing highs followed by psychological breakout zones. Sustained momentum above resistance could open the path toward extended upside continuation fueled by renewed AI-sector participation and institutional trend-following capital.
The conservative scenario assumes temporary retracement toward short-term support before continuation resumes. Such pullbacks would help momentum indicators reset while preserving the broader bullish structure. A bearish breakdown scenario would require loss of major support zones combined with weakening volume participation and broader technology-sector risk-off pressure.
For bullish trading strategy structure, the preferred approach focuses on buying controlled pullbacks into support rather than chasing vertical candles. This improves risk-to-reward alignment while maintaining exposure to the dominant uptrend. Stop-loss positioning should remain below structural support zones to avoid premature liquidation during standard volatility fluctuations.
For short-term bearish hedging setups, traders may consider tactical downside exposure only if momentum exhaustion expands into higher timeframes and resistance repeatedly rejects price continuation. However, bearish positioning should remain tactical because the higher-timeframe structure still strongly favors the AI growth narrative.
Key support levels continue forming through recent accumulation territory where buyers repeatedly defended downside pressure. Immediate resistance remains near short-term swing highs followed by stronger breakout zones that could activate momentum acceleration if breached with volume confirmation.
Risk management remains critical in leveraged CFD environments. Traders should avoid excessive leverage exposure and instead size positions according to stop-loss distance and overall portfolio risk tolerance. During volatility expansion phases, partial profit-taking combined with stop-loss adjustment toward breakeven can help preserve gains while maintaining upside participation.
The broader strategic outlook for Nvidia remains highly constructive as long as AI infrastructure demand, cloud expansion, and semiconductor capital expenditure cycles continue strengthening globally. Combined with the crypto-native trading infrastructure available on Gate, NVDA continues representing one of the strongest technology-momentum opportunities across modern multi-asset trading markets.
repost-content-media
  • Reward
  • 41
  • Repost
  • Share
Ai_Power:
To The Moon 🌕
View More
#ShareYourUSStocksWinNvidia
#KO
Coca-Cola tokenized stock (KO) on Gate.io is currently trading around $77.89 and continues to stand out as one of the more stable market-linked assets available to traders seeking exposure to a globally recognized consumer brand. Backed by the performance of The Coca-Cola Company, the tokenized stock reflects investor sentiment toward a business that has demonstrated resilience through multiple economic cycles. With a market capitalization exceeding $330 billion and a long history of steady revenue generation, Coca-Cola remains a widely followed name among bot
KO-0.02%
HighAmbition
#ShareYourUSStocksWinNvidia
#KO
Coca-Cola tokenized stock (KO) on Gate.io is currently trading around $77.89 and continues to stand out as one of the more stable market-linked assets available to traders seeking exposure to a globally recognized consumer brand. Backed by the performance of The Coca-Cola Company, the tokenized stock reflects investor sentiment toward a business that has demonstrated resilience through multiple economic cycles. With a market capitalization exceeding $330 billion and a long history of steady revenue generation, Coca-Cola remains a widely followed name among both institutional and retail participants.
Recent financial results have reinforced confidence in the company's business model. Coca-Cola reported year-over-year growth in earnings and revenue, supported by continued demand across its global beverage portfolio. Organic revenue growth remained positive, highlighting the company's ability to maintain pricing power and adapt to changing consumer preferences. While management has acknowledged varying demand trends across different regions and consumer groups, the overall business outlook remains constructive due to the company's diversified operations and strong brand portfolio.
From a technical perspective, the broader trend remains positive. The stock is trading above its 50-day moving average near $77.70 and its 200-day moving average around $74.20, a structure that generally reflects underlying strength. The gap between these moving averages suggests that buyers have maintained control over the medium-term trend. However, momentum indicators indicate that the stock may be entering a period of consolidation after its recent advance. The RSI near 77 signals strong momentum but also suggests that price may need time to cool before establishing the next directional move.
Key support levels remain important for traders monitoring potential entry opportunities. Immediate support sits near $77.70, followed by stronger support around $75.00. If broader market conditions weaken, additional support may emerge near $72.00 and the longer-term trend area around $66.50. These zones have historically attracted buying interest and may continue to serve as important areas for price stabilization.
On the upside, resistance levels begin around $79.16 and $79.55, followed by the significant $80.08 area. A sustained move above $80.08 would likely attract increased attention from momentum-focused traders and could create conditions for a retest of the 52-week high at $82.66. If that level is successfully surpassed, market participants may begin focusing on longer-term analyst targets ranging from approximately $86 to $92, although reaching those levels would likely require continued earnings growth and supportive market conditions.
Market sentiment remains generally constructive. Many investors continue to view Coca-Cola as a defensive holding capable of generating relatively stable performance during periods of economic uncertainty. The company's global footprint, diversified beverage lineup, and consistent cash flow generation contribute to its reputation as a high-quality business. At the same time, some traders remain cautious due to the stock's recent gains and elevated valuation metrics, preferring to wait for pullbacks before increasing exposure.
For traders using Gate.io's tokenized stock product, price action should continue to be monitored around the major support and resistance zones. Pullbacks toward support levels may offer more favorable risk-to-reward opportunities than chasing strength near resistance. Conversely, a confirmed breakout above key resistance levels could signal renewed momentum and potentially support further upside. Regardless of market direction, disciplined position sizing and risk management remain essential considerations.
Overall, Coca-Cola continues to present a balanced profile combining business stability, consistent financial performance, and moderate growth potential. While short-term volatility and consolidation remain possible following recent gains, the broader trend remains constructive as long as the stock maintains support above its key moving averages. Traders and investors alike will be watching upcoming earnings reports, consumer demand trends, and broader market conditions for clues regarding the next phase of price movement.
.@Gate_Square #PredictNBAFinalsWin20000U #TradeCFDWinGold #BitcoinETFSees7272BTCOutflow
repost-content-media
  • Reward
  • 44
  • Repost
  • Share
Ai_Power:
To The Moon 🌕
View More
#ShareYourUSStocksWinNvidia
NVIDIA is currently trading around $218.66, with a daily gain of about +1.82%, placing it just below its 52-week high of $236.54. The stock has shown strong multi-timeframe performance, including a +17.2% year-to-date gain and a +56.2% one-year return, while maintaining a massive market capitalization of roughly $5.30 trillion, making it one of the most influential equities in global markets.
📊 Current Market Structure
NVIDIA is currently in a late-stage uptrend consolidation phase, where price is no longer in a strong breakout trend but instead moving within a ti
MrFlower_XingChen
#ShareYourUSStocksWinNvidia
NVIDIA is currently trading around $218.66, with a daily gain of about +1.82%, placing it just below its 52-week high of $236.54. The stock has shown strong multi-timeframe performance, including a +17.2% year-to-date gain and a +56.2% one-year return, while maintaining a massive market capitalization of roughly $5.30 trillion, making it one of the most influential equities in global markets.
📊 Current Market Structure
NVIDIA is currently in a late-stage uptrend consolidation phase, where price is no longer in a strong breakout trend but instead moving within a tight range near historical highs. Trading just below peak levels suggests that momentum is still bullish overall, but price action is increasingly influenced by profit-taking, volatility, and macro uncertainty rather than aggressive accumulation.
📈 Fundamental Performance Overview
Fundamentally, NVIDIA remains extremely strong with revenue growth of +85.2% year-over-year, operating margins of 65.6%, and net margins of 63%, reflecting exceptional profitability. Its return on equity of 114.3% and TTM revenue of $253.49B highlight its dominance in the AI hardware and GPU ecosystem, where demand continues to be driven by hyperscalers and enterprise AI infrastructure expansion.
⚖️ Valuation and Market Expectations
Despite strong earnings, NVIDIA is trading at a P/E ratio of 33.7x, which places it in a high-expectation valuation category. This means the stock is no longer purely driven by growth acceleration but by whether that growth can be sustained at scale. At this stage, even minor signs of slowdown or demand normalization can lead to sharper market reactions due to elevated expectations.
🧠 Analyst Sentiment and Forecasts
Wall Street sentiment remains overwhelmingly bullish, with a “Strong Buy” consensus rating across more than 37 analysts. The median price target is $286.50, implying about +31% upside potential, while bullish forecasts extend as high as $500, and conservative downside estimates sit near $180. This wide range reflects uncertainty about how long the AI growth cycle can remain at peak intensity.
🧱 Key Technical Support Levels
On the downside, the most important support zone is between $210 and $215, which now acts as a critical structural demand area. Below that, the next key support is $200, followed by deeper correction levels near $185–$180. A breakdown below $210 would signal weakening momentum and increase the probability of a broader consolidation phase.
🚧 Key Resistance Levels
On the upside, NVIDIA faces strong resistance between $230 and $236, which represents the all-time high zone. A confirmed breakout above $236 would indicate renewed bullish continuation and could trigger a new price discovery phase. Until that breakout occurs, the stock remains in a range-bound resistance compression structure.
🚀 Bullish Scenario Outlook
In a bullish continuation case, a breakout above $236 with strong volume could push NVIDIA toward $250–$270 in the short term, followed by a move toward the $286 analyst median target, and potentially $320+ in a strong AI-driven liquidity expansion cycle. This scenario requires sustained institutional inflows and continued AI demand acceleration.
---
📉 Bearish Scenario Outlook
In a bearish or corrective scenario, failure to hold the $210–$215 support zone could trigger a deeper pullback toward $200, and if selling pressure accelerates, a move toward $185–$180 becomes possible. This would represent a normal but sharp valuation reset within a high-growth stock experiencing rotation or macro pressure.
🌐 Market Drivers and Catalysts
Key drivers include continued AI infrastructure demand, expansion into new markets like PC CPUs and AI laptops (N1X and RTX Spark), and the emerging agentic AI opportunity estimated at $200B+ TAM. These catalysts reinforce long-term growth, even as short-term volatility increases due to macro conditions and sector rotation.
⚠️ Risk Factors
Major risks include high valuation sensitivity, increasing competition from custom silicon providers such as hyperscalers, and geopolitical risks such as export restrictions. Additionally, rotation out of mega-cap tech into other sectors could temporarily reduce momentum even if fundamentals remain strong.
🧭 Final Market Interpretation
Overall, NVIDIA is in a strong but late-cycle expansion phase, where fundamentals remain extremely bullish but price action is increasingly sensitive near all-time highs. The key battle zone is between $210 support and $236 resistance, and whichever side breaks first will likely define the next major directional trend—either continuation into new highs or a broader consolidation/correction phase.
repost-content-media
  • Reward
  • 32
  • Repost
  • Share
Ai_Power:
To The Moon 🌕
View More
#SpaceXRoadshowHighlightsAsteroidMining
𝗦𝗽𝗮𝗰𝗲𝗫 𝗥𝗼𝗮𝗱𝘀𝗵𝗼𝘄 𝗛𝗶𝗴𝗵𝗹𝗶𝗴𝗵𝘁𝘀 𝗔𝘀𝘁𝗲𝗿𝗼𝗶𝗱 𝗠𝗶𝗻𝗶𝗻𝗴 — 𝗧𝗵𝗲 𝗡𝗲𝘅𝘁 𝗙𝗿𝗼𝗻𝘁𝗶𝗲𝗿 𝗢𝗳 𝗧𝗵𝗲 𝗦𝗽𝗮𝗰𝗲 𝗘𝗰𝗼𝗻𝗼𝗺𝘆
𝗔𝘀𝘁𝗲𝗿𝗼𝗶𝗱 𝗠𝗶𝗻𝗶𝗻𝗴 𝗘𝗻𝘁𝗲𝗿𝘀 𝗧𝗵𝗲 𝗜𝗻𝘃𝗲𝘀𝘁𝗺𝗲𝗻𝘁 𝗖𝗼𝗻𝘃𝗲𝗿𝘀𝗮𝘁𝗶𝗼𝗻
One of the most discussed developments from the recent SpaceX roadshow was the company's decision to highlight asteroid mining as a potential future business opportunity. While SpaceX is widely known for launch services, Starlink, and its long-term vision of Mars colonization, the inclusion of asteroid minin
IRON-9.31%
MrFlower_XingChen
#SpaceXRoadshowHighlightsAsteroidMining
𝗦𝗽𝗮𝗰𝗲𝗫 𝗥𝗼𝗮𝗱𝘀𝗵𝗼𝘄 𝗛𝗶𝗴𝗵𝗹𝗶𝗴𝗵𝘁𝘀 𝗔𝘀𝘁𝗲𝗿𝗼𝗶𝗱 𝗠𝗶𝗻𝗶𝗻𝗴 — 𝗧𝗵𝗲 𝗡𝗲𝘅𝘁 𝗙𝗿𝗼𝗻𝘁𝗶𝗲𝗿 𝗢𝗳 𝗧𝗵𝗲 𝗦𝗽𝗮𝗰𝗲 𝗘𝗰𝗼𝗻𝗼𝗺𝘆
𝗔𝘀𝘁𝗲𝗿𝗼𝗶𝗱 𝗠𝗶𝗻𝗶𝗻𝗴 𝗘𝗻𝘁𝗲𝗿𝘀 𝗧𝗵𝗲 𝗜𝗻𝘃𝗲𝘀𝘁𝗺𝗲𝗻𝘁 𝗖𝗼𝗻𝘃𝗲𝗿𝘀𝗮𝘁𝗶𝗼𝗻
One of the most discussed developments from the recent SpaceX roadshow was the company's decision to highlight asteroid mining as a potential future business opportunity. While SpaceX is widely known for launch services, Starlink, and its long-term vision of Mars colonization, the inclusion of asteroid mining in investor materials signals that management is thinking far beyond today's revenue streams. The concept transforms SpaceX from being viewed solely as a transportation company into a potential infrastructure provider for an entirely new space-based economy.
𝗪𝗵𝘆 𝗔𝘀𝘁𝗲𝗿𝗼𝗶𝗱 𝗠𝗶𝗻𝗶𝗻𝗴 𝗜𝘀 𝗚𝗮𝗶𝗻𝗶𝗻𝗴 𝗔𝘁𝘁𝗲𝗻𝘁𝗶𝗼𝗻
Asteroids contain vast quantities of valuable resources that could eventually support both Earth-based industries and future space operations. Many asteroids are believed to contain significant amounts of platinum-group metals, gold, nickel, iron, and rare industrial materials. Some also contain large deposits of water, which can be converted into hydrogen and oxygen fuel for spacecraft. If these resources become economically accessible, asteroid mining could unlock entirely new supply chains that are not constrained by Earth's finite resources.
𝗦𝘁𝗮𝗿𝘀𝗵𝗶𝗽 𝗜𝘀 𝗧𝗵𝗲 𝗞𝗲𝘆 𝗘𝗻𝗮𝗯𝗹𝗲𝗿
The foundation of this vision is Starship, SpaceX's fully reusable heavy-lift rocket system. Traditional space missions have historically been limited by extremely high transportation costs. SpaceX believes that dramatically reducing launch expenses through rapid reusability could make previously impossible commercial activities economically viable. Under this framework, asteroid mining is not simply about resource extraction; it is about lowering transportation costs enough to create profitable business models in space.
𝗕𝗲𝘆𝗼𝗻𝗱 𝗔𝘀𝘁𝗲𝗿𝗼𝗶𝗱𝘀: 𝗔 𝗠𝘂𝗹𝘁𝗶-𝗧𝗿𝗶𝗹𝗹𝗶𝗼𝗻 𝗗𝗼𝗹𝗹𝗮𝗿 𝗩𝗶𝘀𝗶𝗼𝗻
The roadshow presentation placed asteroid mining within a broader collection of future opportunities. These included lunar manufacturing, cargo transportation to Mars, human settlement infrastructure, in-orbit manufacturing, and energy production beyond Earth. Collectively, these initiatives represent a vision where space becomes a productive economic environment rather than merely a destination for scientific exploration. SpaceX is effectively positioning itself as the infrastructure backbone for this potential future economy.
𝗪𝗮𝘁𝗲𝗿 𝗖𝗼𝘂𝗹𝗱 𝗕𝗲𝗰𝗼𝗺𝗲 𝗠𝗼𝗿𝗲 𝗩𝗮𝗹𝘂𝗮𝗯𝗹𝗲 𝗧𝗵𝗮𝗻 𝗚𝗼𝗹𝗱
One of the most overlooked aspects of asteroid mining is the strategic value of water. In space, water is not merely a resource for human consumption. It can be processed into rocket fuel, enabling refueling depots throughout the solar system. Such infrastructure could significantly reduce mission costs and expand humanity's operational reach beyond Earth orbit. As a result, future space logistics networks may place extraordinary value on water-rich asteroids.
𝗜𝗻𝘃𝗲𝘀𝘁𝗼𝗿𝘀 𝗔𝗿𝗲 𝗘𝘃𝗮𝗹𝘂𝗮𝘁𝗶𝗻𝗴 𝗧𝗵𝗲 𝗟𝗼𝗻𝗴-𝗧𝗲𝗿𝗺 𝗢𝗽𝗽𝗼𝗿𝘁𝘂𝗻𝗶𝘁𝘆
The inclusion of asteroid mining in SpaceX's investor presentation does not mean operational mining missions are imminent. Rather, it demonstrates how the company is communicating its long-term strategic vision to investors. Market participants are increasingly evaluating SpaceX not only based on current businesses such as Starlink and launch services but also on its ability to create entirely new industries over the coming decades.
𝗧𝗵𝗲 𝗘𝗰𝗼𝗻𝗼𝗺𝗶𝗰𝘀 𝗥𝗲𝗺𝗮𝗶𝗻 𝗧𝗵𝗲 𝗕𝗶𝗴𝗴𝗲𝘀𝘁 𝗖𝗵𝗮𝗹𝗹𝗲𝗻𝗴𝗲
Despite the excitement, asteroid mining still faces substantial technological and economic hurdles. Resource identification, extraction methods, transportation logistics, regulatory frameworks, and mission reliability must all improve significantly before commercial viability can be achieved. The industry's success ultimately depends on whether transportation costs can decline enough to make off-world resource extraction profitable on a sustainable basis.
𝗧𝗵𝗲 𝗟𝗼𝗻𝗴-𝗧𝗲𝗿𝗺 𝗜𝗺𝗽𝗹𝗶𝗰𝗮𝘁𝗶𝗼𝗻𝘀
If SpaceX succeeds in making large-scale space transportation affordable, asteroid mining could fundamentally reshape global commodity markets. Access to previously unreachable resources would create new economic opportunities, alter supply chains, and potentially establish the foundations of a true interplanetary economy. While such outcomes remain years or decades away, the concept highlights how rapidly the discussion surrounding commercial space activity is evolving.
𝗦𝘁𝗿𝗮𝘁𝗲𝗴𝗶𝗰 𝗢𝘂𝘁𝗹𝗼𝗼𝗸
According to MrFlower_XingChen, the significance of SpaceX highlighting asteroid mining is not that mining missions are about to begin. The real importance lies in the company's attempt to redefine how investors think about the future of space. Rather than focusing exclusively on rockets and satellites, SpaceX is presenting a vision in which transportation infrastructure enables entirely new industries. If Starship delivers on its promise of dramatically lower launch costs, asteroid mining could transition from science fiction to one of the most transformative economic opportunities of the 21st century.
#TradeCFDWinGold #StockTradingChallengeUpTo17000U #DailyPolymarketHotspot @Gate_Square @Gate广场_Official
repost-content-media
  • Reward
  • 32
  • Repost
  • Share
cryptoStylish:
goood information
View More
#ChipStocksCrashedDowHitRecordHigh
𝗖𝗵𝗶𝗽 𝗦𝘁𝗼𝗰𝗸𝘀 𝗖𝗿𝗮𝘀𝗵𝗲𝗱 𝗪𝗵𝗶𝗹𝗲 𝗗𝗼𝘄 𝗛𝗶𝘁𝘀 𝗥𝗲𝗰𝗼𝗿𝗱 𝗛𝗶𝗴𝗵 — 𝗧𝗵𝗲 𝗠𝗮𝗿𝗸𝗲𝘁 𝗥𝗼𝘁𝗮𝘁𝗶𝗼𝗻 𝗕𝗲𝗵𝗶𝗻𝗱 𝗧𝗵𝗲 𝗗𝗶𝘃𝗲𝗿𝗴𝗲𝗻𝗰𝗲
𝗔 𝗖𝗹𝗮𝘀𝘀𝗶𝗰 𝗠𝗮𝗿𝗸𝗲𝘁 𝗗𝗶𝘃𝗲𝗿𝗴𝗲𝗻𝗰𝗲 𝗜𝘀 𝗨𝗻𝗳𝗼𝗹𝗱𝗶𝗻𝗴
The latest session highlighted a striking divergence: semiconductor and chip stocks fell sharply, while the Dow Jones Industrial Average reached fresh record highs. At first glance, this appears contradictory, but in reality it reflects a deeper rotation within global equity markets. Capital is not leaving equities; inst
US30-0.08%
MrFlower_XingChen
#ChipStocksCrashedDowHitRecordHigh
𝗖𝗵𝗶𝗽 𝗦𝘁𝗼𝗰𝗸𝘀 𝗖𝗿𝗮𝘀𝗵𝗲𝗱 𝗪𝗵𝗶𝗹𝗲 𝗗𝗼𝘄 𝗛𝗶𝘁𝘀 𝗥𝗲𝗰𝗼𝗿𝗱 𝗛𝗶𝗴𝗵 — 𝗧𝗵𝗲 𝗠𝗮𝗿𝗸𝗲𝘁 𝗥𝗼𝘁𝗮𝘁𝗶𝗼𝗻 𝗕𝗲𝗵𝗶𝗻𝗱 𝗧𝗵𝗲 𝗗𝗶𝘃𝗲𝗿𝗴𝗲𝗻𝗰𝗲
𝗔 𝗖𝗹𝗮𝘀𝘀𝗶𝗰 𝗠𝗮𝗿𝗸𝗲𝘁 𝗗𝗶𝘃𝗲𝗿𝗴𝗲𝗻𝗰𝗲 𝗜𝘀 𝗨𝗻𝗳𝗼𝗹𝗱𝗶𝗻𝗴
The latest session highlighted a striking divergence: semiconductor and chip stocks fell sharply, while the Dow Jones Industrial Average reached fresh record highs. At first glance, this appears contradictory, but in reality it reflects a deeper rotation within global equity markets. Capital is not leaving equities; instead, it is rotating between sectors based on changing expectations around growth, valuation, and macroeconomic conditions.
𝗣𝗿𝗼𝗳𝗶𝘁-𝗧𝗮𝗸𝗶𝗻𝗴 𝗜𝗻 𝗧𝗵𝗲 𝗔𝗜 𝗟𝗲𝗮𝗱𝗲𝗿𝘀𝗵𝗶𝗽 𝗚𝗿𝗼𝘂𝗽
Semiconductors have been the primary winners of the AI-driven market cycle, attracting massive inflows due to explosive demand expectations for data centers, cloud infrastructure, and advanced computing. Companies such as NVIDIA and other chip leaders saw valuations expand rapidly as investors priced in aggressive future growth. However, after such a strong multi-month rally, the latest decline likely reflects position rebalancing and profit-taking, rather than an immediate deterioration in long-term fundamentals.
𝗘𝘅𝗽𝗲𝗰𝘁𝗮𝘁𝗶𝗼𝗻𝘀 𝗛𝗮𝘃𝗲 𝗕𝗲𝗰𝗼𝗺𝗲 𝗧𝗼𝗼 𝗛𝗶𝗴𝗵
A key pressure point for semiconductor stocks is that expectations have run ahead of reality. Investors are no longer debating whether AI demand is strong—they are questioning whether future growth can exceed already elevated forecasts. When expectations become stretched, even strong earnings or positive news can trigger disappointment. This creates short-term volatility even in structurally strong sectors.
𝗧𝗵𝗲 𝗗𝗼𝘄 𝗝𝗼𝗻𝗲𝘀 𝗥𝗮𝗹𝗹𝘆 𝗦𝗶𝗴𝗻𝗮𝗹𝘀 𝗦𝗲𝗰𝘁𝗼𝗿 𝗥𝗼𝘁𝗮𝘁𝗶𝗼𝗻
While chip stocks weakened, the Dow Jones strength suggests capital rotation into more traditional sectors. The index is heavily weighted toward industrials, financials, healthcare, and consumer companies, which tend to benefit from more stable economic conditions. This shift indicates that investors may be seeking balance, moving away from high-growth volatility toward sectors with more predictable earnings streams.
𝗜𝗻𝘁𝗲𝗿𝗲𝘀𝘁 𝗥𝗮𝘁𝗲𝘀 𝗔𝗿𝗲 𝗦𝗵𝗮𝗽𝗶𝗻𝗴 𝗦𝗲𝗰𝘁𝗼𝗿 𝗣𝗿𝗲𝗳𝗲𝗿𝗲𝗻𝗰𝗲𝘀
Another major driver of this divergence is the evolving interest-rate environment. Higher or uncertain rates tend to compress valuations of high-growth technology stocks more heavily than mature, cash-flow-stable companies. As bond yields fluctuate, investors often rotate toward sectors that are less sensitive to discount-rate changes, which helps explain relative strength in the Dow compared to semiconductor-heavy indices.
𝗟𝗶𝗾𝘂𝗶𝗱𝗶𝘁𝘆 𝗥𝗼𝘁𝗮𝘁𝗶𝗼𝗻 𝗥𝗮𝘁𝗵𝗲𝗿 𝗧𝗵𝗮𝗻 𝗘𝘅𝗶𝘁𝗲𝗿𝗶𝗼𝗻
Importantly, this is not a broad exit from risk assets. Instead, it reflects internal capital rotation within equities. Institutional investors frequently shift exposure between sectors while maintaining overall market participation. In this environment, weakness in one segment is often offset by strength elsewhere, allowing indices like the Dow to continue advancing even as technology corrects.
𝗔 𝗠𝗼𝗿𝗲 𝗠𝗮𝘁𝘂𝗿𝗲 𝗕𝘂𝗹𝗹 𝗠𝗮𝗿𝗸𝗲𝘁 𝗦𝘁𝗿𝘂𝗰𝘁𝘂𝗿𝗲
This divergence may also signal a transition into a more mature phase of the bull market, where leadership expands beyond a narrow group of mega-cap technology stocks. Instead of relying solely on AI-driven momentum, broader participation from industrial and financial sectors suggests a healthier and more diversified market structure.
𝗧𝗵𝗲 𝗞𝗲𝘆 𝗤𝘂𝗲𝘀𝘁𝗶𝗼𝗻 𝗔𝗵𝗲𝗮𝗱
The central question going forward is whether semiconductor weakness is temporary or the beginning of a longer rotation. If AI-driven demand remains strong, chip stocks may stabilize and reassert leadership. If not, the market may continue broadening its leadership base, reducing dependence on a single growth narrative.
𝗦𝘁𝗿𝗮𝘁𝗲𝗴𝗶𝗰 𝗜𝗻𝘀𝗶𝗴𝗵𝘁
According to MrFlower_XingChen, this is not a conflict between “tech versus traditional stocks,” but rather a natural capital flow cycle within a global bull market. Markets continuously reprice expectations, and leadership rotates as investors search for the next source of returns. The real signal is not daily volatility, but where liquidity is moving next—and why.
#ChipStocksCrashedDowHitRecordHigh #TradeCFDWinGold #StockTradingChallengeUpTo17000U @Gate_Square @Gate广场_Official
repost-content-media
  • Reward
  • 28
  • Repost
  • Share
cryptoStylish:
goood information
View More
【📅 June 5 · Non-Farm Night · Trading Preview】
⏰ Time: Tonight at 8:30 PM
📍 Follow: USD / U.S. Bonds / Gold / BTC·ETH / U.S. Stocks
📊 Market Expectations:
• Non-farm employment change: 85,000–90k (previous: 115k)
• Unemployment rate: 4.3% (unchanged)
• Hourly wages month-over-month: 0.3%
🧠 Core Logic:
① Data exceeds expectations → Delay in rate cuts → Strong USD → Risk assets under pressure 📉
② Data underperforms → Rate cut expectations heat up → Weak USD → Crypto, stocks, and gold resonate and rebound 📈
③ In line with expectations → Volatility for a while, then return to the original tre
BTC-2.47%
ETH-2.31%
View Original
  • Reward
  • 47
  • Repost
  • Share
cryptoStylish:
goood information
View More
#分享美股交易赢英伟达股票 U.S. stocks "Old Degen Stocks" rebound across the board.
Last night and this morning, the three major U.S. stock indices all surged, with the Dow Jones Industrial Average soaring over 970 points at one point, hitting a record high, with traditional sectors such as healthcare, finance, and real estate all closing higher; the Nasdaq slightly declined by 0.09%, after initially dropping over 1%, with large tech stocks mostly rising.
Some analysts pointed out that although chip giant Broadcom's earnings outlook fell short of expectations, causing a sell-off in the chip sector, mar
SPYX0.32%
AMZNX1.79%
AAPLON-0.12%
MSFTON-1.00%
View Original
ThisIsTranslateContent:
#分享美股交易赢英伟达股票 U.S. stocks "Old Degen Stocks" rebound across the board.
Last night and this morning, the three major U.S. stock indices all surged, with the Dow Jones Industrial Average soaring over 970 points at one point, hitting a new all-time high, with traditional sectors such as healthcare, finance, and real estate all closing higher; the Nasdaq slightly declined by 0.09%, initially dropping over 1% at the open, while large tech stocks mostly rose.
Some analysts pointed out that although chip giant Broadcom's earnings outlook fell short of expectations, causing a sell-off in the chip sector, market "buying on dips" sentiment supported the Nasdaq to nearly recover all its losses.
Meanwhile, market expectations that the Middle East conflict may end also boosted investor sentiment. On the 4th local time, U.S. President Trump stated that if the U.S. and Iran reach an agreement, he does not rule out the possibility of meeting with Iran’s new Supreme Leader. Additionally, under U.S. mediation, Israel and Lebanon reached a ceasefire agreement, which is seen as one of the key prerequisites for Iran to accept a peace deal.
Dow soars sharply
On Thursday Eastern Time, U.S. stocks showed a clear divergence, with the Dow rising 874.86 points, or 1.73%, to a new all-time high at the close; the S&P 500 increased by 0.41%, while the Nasdaq slightly declined by 0.09%.
Large tech stocks mostly rose, with Google A surging over 3%, Nvidia up nearly 2%, Amazon up over 1%, Meta up 0.74%, Apple up 0.31%, Microsoft up 0.17%, and Tesla down over 1%.
Most U.S. chip stocks declined, with the Philadelphia Semiconductor Index down over 2%, Broadcom plunging over 12%, Micron Technology dropping over 7%, Arm down over 4%, AMD down over 3%, and Qualcomm down over 2%; Marvell Technology rose nearly 5%, and TSMC ADR and ASML ADR both increased over 1%.
On the news front, Broadcom’s latest revenue data slightly missed market expectations, casting a shadow over the AI investment boom that had been driving the market higher, leading investors to reassess whether AI infrastructure investments have already overstretched future growth expectations. This triggered a sell-off across the tech sector, with the Nasdaq initially dropping over 1%, but the "buy on dips" sentiment in the market supported the Nasdaq to nearly recover all its losses.
Paul Nolte, senior wealth advisor and chief market strategist at Murphy & Sylvest, said: “Currently, the market has almost no obvious flaws, except for Broadcom. But I think investors are buying on dips. I don’t believe investors have given up on the chip sector, but they still haven’t truly addressed a core question: Is this rally real? Are these valuations reasonable? I’m not sure investors have seriously examined these issues.”
Matt Maley of Miller Tabak pointed out that the rebound in chip stocks since the March lows has been very strong, even parabolic. If Broadcom’s earnings report becomes a catalyst for a multi-day correction, it would actually be healthy for the overall market.
Despite pressure on tech stocks, the overall market pattern shows capital rotation rather than collective withdrawal, with financials and healthcare leading the gains. Analysts noted that the rise in these sectors is not driven by obvious fundamentals but mainly by capital flow effects after high-momentum sectors decline.
Bret Kenwell of eToro said that earnings expectations continue to be raised, and corporate management generally holds a positive attitude toward consumer resilience. For retail investors, this remains an opportunity to buy on dips. But the market does need to breathe, which doesn’t mean the stock market will top out immediately, but rather that the market can benefit from rotation or consolidation.
On the economic data front, U.S. initial jobless claims unexpectedly increased by 6.1% last week, and Q1 labor costs and productivity data were significantly revised downward. A report from Challenger, Gray & Christmas showed that U.S. companies announced a surge of 11% in layoffs in May, reaching 97,006, with nearly 40% attributed to AI.
repost-content-media
  • Reward
  • 42
  • Repost
  • Share
cryptoStylish:
goood information
View More
  • Pinned