GateUser-5caa169c

vip
Age 0.1 Year
Peak Tier 0
No content yet
#ShareYourUSStocksWinNvidia
The SAMSUNG/USD Perpetual Futures contract trading on Hyperliquid represents a derivative instrument that tracks the performance of Samsung Electronics stock without requiring direct equity ownership. This perpetual contract allows traders to gain exposure to Samsung price movements with the flexibility of cryptocurrency-style trading mechanics including leverage and continuous trading hours. The current trading environment shows significant activity with the contract experiencing a positive daily movement of over two percent, indicating healthy market participatio
SAMSUNG2.95%
HighAmbition
#ShareYourUSStocksWinNvidia
The SAMSUNG/USD Perpetual Futures contract trading on Hyperliquid represents a derivative instrument that tracks the performance of Samsung Electronics stock without requiring direct equity ownership. This perpetual contract allows traders to gain exposure to Samsung price movements with the flexibility of cryptocurrency-style trading mechanics including leverage and continuous trading hours. The current trading environment shows significant activity with the contract experiencing a positive daily movement of over two percent, indicating healthy market participation and interest from traders seeking exposure to the Korean technology giant.
Understanding the current price action is essential for developing an effective trading strategy. The contract opened at 192.54 and has traded within a daily range of 192.54 to 201.49, demonstrating reasonable volatility that creates opportunities for both short-term scalpers and longer-term position traders. The previous close at 192.54 provides context for overnight sentiment, while the current price level near 199 suggests the market is maintaining bullish momentum with buyers showing willingness to push prices higher throughout the trading session.
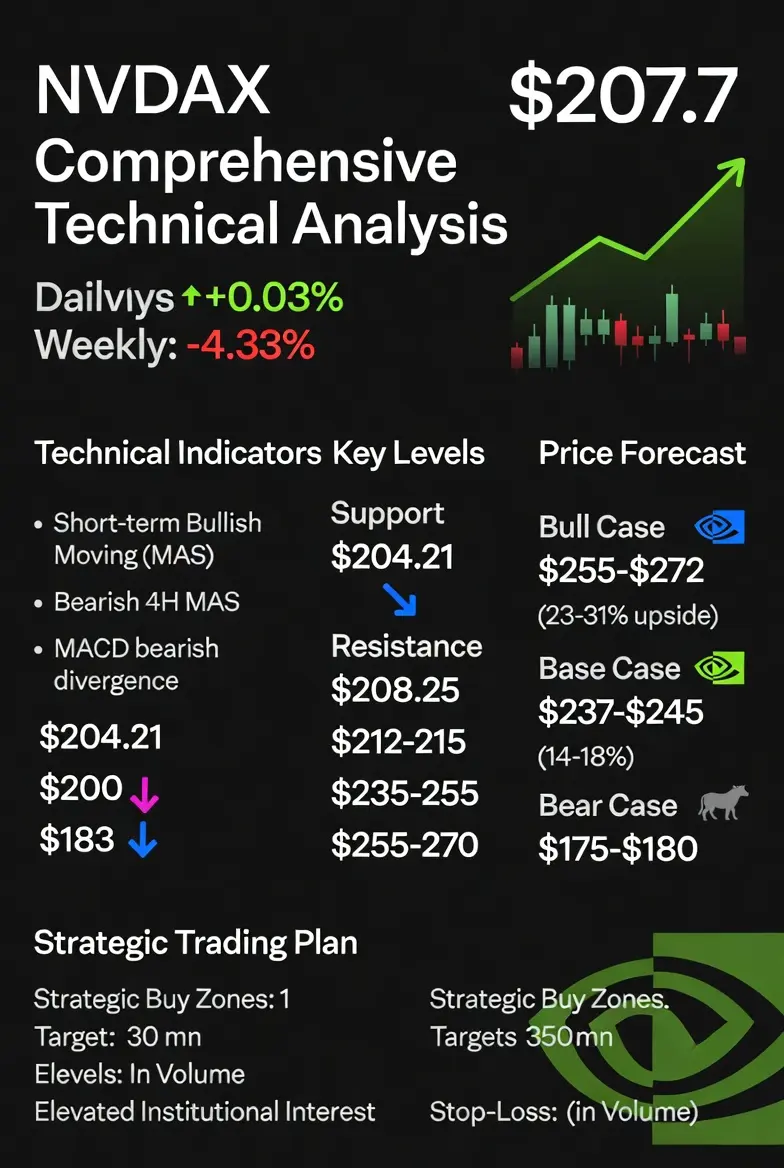
Support and resistance analysis forms the foundation of any sound trading approach. At the current price level around 199, several key technical levels demand attention. Immediate support can be identified around the daily open of 192.54, which represents the session low and a level where buyers initially stepped in. Below this, psychological support exists at 190, followed by stronger technical support near 185. These levels become critical for risk management as they represent areas where selling pressure historically encounters buying interest.
On the resistance side, the immediate challenge appears at the daily high of 201.49, which represents the upper boundary of current price exploration. A decisive break above this level could open the path toward the next psychological resistance at 205, followed by more substantial resistance near 210. These resistance levels are not arbitrary numbers but represent zones where supply has previously overwhelmed demand, requiring significant buying conviction to overcome.
The trading plan for SAMSUNG perpetual futures at current levels requires careful consideration of multiple factors. Entry strategy should focus on identifying optimal risk-reward setups. For bullish positions, waiting for a pullback toward the 195 to 197 range offers better entry pricing than chasing at current levels. This approach allows traders to position themselves near support while maintaining logical stop placement below the 192 session low. Alternatively, momentum traders might consider entries on confirmed breaks above 201.50 with the expectation of continued upward movement.
Risk management remains paramount when trading perpetual futures due to the leverage typically available and the funding rate mechanics that affect holding costs. Position sizing should never exceed comfortable risk parameters, with individual trades representing no more than two to five percent of total trading capital. Stop loss placement requires balancing protection against normal market noise while allowing sufficient room for the trade to develop. For long positions entered near 199, stops below 192 provide reasonable protection while acknowledging the daily range volatility.
Target setting should follow a tiered approach to maximize profitability while managing risk. Initial profit targets near 205 capture the first resistance level and represent a three percent gain from current levels. Secondary targets at 210 offer more substantial returns of approximately five to six percent while requiring sustained bullish momentum. Traders employing this approach should consider partial profit-taking at each target level, reducing exposure while letting remaining positions run with trailing stops to capture extended moves.
The broader market context significantly impacts SAMSUNG perpetual futures performance. Samsung Electronics operates as a major semiconductor and technology conglomerate with exposure to multiple growth sectors including artificial intelligence memory solutions, smartphone manufacturing, and display technologies. Recent analyst upgrades and positive sentiment surrounding high-bandwidth memory demand create a favorable fundamental backdrop that supports higher valuations. Goldman Sachs has notably raised price targets significantly, reflecting confidence in the company's ability to capitalize on artificial intelligence infrastructure spending.
Funding rates on perpetual contracts require constant monitoring as they represent the cost of holding positions overnight. Positive funding rates indicate long positions paying shorts, suggesting bullish sentiment but also increasing holding costs for extended positions. Traders should factor these costs into their holding period calculations and adjust position sizes accordingly. Periods of elevated funding rates might suggest crowded positioning, increasing the risk of sudden reversals.
Technical indicators can provide additional confirmation for trading decisions. Moving averages help identify trend direction with the fifty-period and two-hundred-period averages serving as dynamic support and resistance levels. Volume analysis reveals the conviction behind price movements, with breakouts on high volume carrying more significance than those on low participation. Momentum indicators such as relative strength index help identify overbought or oversold conditions that might signal potential reversal points.
Market sentiment analysis extends beyond technical indicators to include broader risk appetite measures. Technology sector performance, Korean won exchange rate movements, and global semiconductor demand all influence Samsung stock performance and by extension the perpetual contract. Traders should monitor these macro factors alongside technical levels to develop a complete market understanding.
Execution considerations for SAMSUNG perpetual futures include understanding the specific contract specifications on Hyperliquid. Tick sizes, minimum order quantities, and available leverage all impact trading decisions. Using limit orders rather than market orders helps avoid slippage, particularly important in less liquid periods or during volatile news events. Traders should also familiarize themselves with the platform's liquidation mechanics to avoid forced position closures during adverse moves.
Psychological factors play a crucial role in trading success. The fear of missing out can drive poor entry decisions, while loss aversion might cause premature exits from profitable positions. Developing and adhering to a predetermined trading plan helps mitigate these emotional responses. Recording trade rationales and outcomes facilitates continuous improvement and pattern recognition.
The path forward for SAMSUNG perpetual futures appears constructive based on current technical positioning and fundamental tailwinds. However, traders must remain vigilant for changes in market conditions that could invalidate current assumptions. Regular reassessment of support and resistance levels as price action develops ensures the trading plan remains relevant and responsive to evolving market dynamics.
In conclusion, trading SAMSUNG perpetual futures at current price levels around 199 offers opportunities for disciplined traders who approach the market with proper risk management and clear strategic objectives. The combination of favorable technical positioning, supportive fundamental factors, and reasonable volatility creates an environment where well-planned trades can achieve attractive risk-adjusted returns. Success requires patience in waiting for optimal entry points, discipline in adhering to stop losses, and flexibility in adapting to changing market conditions.@Gate_Square #ShareYourUSStocksWinNvidia #TradeCFDWinGold
repost-content-media
  • Reward
  • Comment
  • Repost
  • Share
#ShareYourUSStocksWinNvidia
#NVDAX
NVDAX is currently trading at $207.7, showing resilience after fluctuating between $204.21 and $208.25 over the past 24 hours. The stock has registered a modest gain of 0.03% in the daily timeframe while experiencing a pullback of 4.33% over the past week. Trading volume has seen significant expansion alongside price movements, indicating heightened institutional participation and stronger capital flows into the asset.
Technical Analysis Across Multiple Timeframes
On the 15-minute chart, NVDAX displays a bullish moving average alignment with MA7 positioned
NVDAX0.37%
HighAmbition
#ShareYourUSStocksWinNvidia
#NVDAX
NVDAX is currently trading at $207.7, showing resilience after fluctuating between $204.21 and $208.25 over the past 24 hours. The stock has registered a modest gain of 0.03% in the daily timeframe while experiencing a pullback of 4.33% over the past week. Trading volume has seen significant expansion alongside price movements, indicating heightened institutional participation and stronger capital flows into the asset.
Technical Analysis Across Multiple Timeframes
On the 15-minute chart, NVDAX displays a bullish moving average alignment with MA7 positioned above MA30 and MA120, suggesting short-term upward momentum. However, both the CCI and Williams Percentage Range indicators have entered overbought territory, signaling potential exhaustion in buying pressure and the possibility of a near-term correction. Traders should exercise caution as these oscillators approach extreme levels.
The 4-hour timeframe presents a contrasting picture with a bearish moving average configuration where MA7 sits below MA30 and MA120, indicating a clear downtrend in the medium-term perspective. This divergence between short-term and medium-term signals suggests consolidation or range-bound behavior may persist in the immediate future.
Daily timeframe analysis reveals a concerning MACD bearish divergence pattern where price has achieved new highs while the DIF line failed to confirm this movement. This classic technical signal often precedes short-term pullbacks and warrants defensive positioning for risk-averse traders.
Critical Support and Resistance Levels
Immediate support is established at approximately $204.21, representing the recent 24-hour low and a key demand zone where buyers have previously stepped in. A secondary support level exists around $200, which aligns with psychological round-number support and previous consolidation areas. The major support floor is located at $183, based on medium-term trend analysis, where substantial buying interest would be expected to emerge.
On the resistance side, immediate resistance stands at $208.25, marking the recent 24-hour high. A decisive break above this level could open the path toward $212-$215, representing the next congestion zone. The significant resistance cluster exists between $235 and $255, where prior price rejection and profit-taking activities have been observed. Analyst price targets from major institutions cluster around $255-$270, with some bullish projections extending toward $272 based on fundamental catalysts.
Price Forecast and Scenario Analysis
The bull case for NVDAX remains compelling despite recent consolidation. Fundamental drivers include the ongoing Blackwell architecture ramp, accelerating agentic AI demand, and full-stack platform stickiness that increases customer switching costs. Meta Platforms has committed to millions of Blackwell and Rubin GPUs, while OpenAI is building more than 10 gigawatts of NVIDIA systems. CEO Jensen Huang has indicated the company sees at least $1 trillion in orders for Blackwell and Vera Rubin through 2027. Under this optimistic scenario, price targets of $255-$272 appear achievable over the next 12 months, representing upside potential of approximately 23-31% from current levels.
The base case scenario assumes continued execution on revenue guidance of approximately $78 billion for Q1 FY2027, stable gross margins around 75%, and gradual recovery in China Data Center contributions. This outlook supports a price target of $237-$245, consistent with consensus analyst estimates and representing 14-18% upside potential.
The bear case centers on geopolitical risks, particularly the complete exclusion of China Data Center compute contribution from guidance, estimated at approximately $50 billion in addressable market. Concentration risk from hyperscalers representing 50% of Data Center revenue presents additional vulnerability. Should these headwinds materialize alongside broader tech sector weakness, support at $183 becomes critical, with potential downside extending toward $175-$180 in a risk-off environment.
Strategic Trading Plan
For active traders, the current price action suggests a range-bound approach between $204 support and $208 resistance. Consider initiating long positions on confirmed breaks above $208.25 with targets at $212, $215, and eventually $235. Stop-loss orders should be placed below $203 to protect against false breakouts.
Swing traders might accumulate positions near the $204-$205 support zone with a medium-term horizon targeting $235-$255. Risk management remains paramount given the bearish MACD divergence on the daily chart, suggesting position sizing should reflect elevated volatility expectations.
Investors with longer time horizons can view current levels as accumulation opportunities, particularly on any weakness toward $200 or the $183 support level. The structural AI infrastructure demand narrative remains intact, and valuation compression from previous highs has improved the risk-reward profile for patient capital.
Volume analysis confirms institutional interest remains robust, with 24-hour trading activity significantly elevated. This liquidity environment supports efficient execution for both entry and exit strategies. Monitor earnings announcements, guidance updates, and geopolitical developments closely as these catalysts will likely determine the next directional move.
Risk management protocols should include strict stop-loss discipline, position sizing appropriate for account risk tolerance, and awareness of the 4-hour bearish trend alignment that may produce headwinds for bullish positions in the near term.@Gate_Square #Web3SecurityGuide #GMTokenLaunchAndPromotion #CryptoSurvivalGuide
repost-content-media
  • Reward
  • Comment
  • Repost
  • Share
#StrongNonfarmPayrollsRekindleRateHikeFear
On June 5, 2026, the United States Bureau of Labor Statistics released the May Nonfarm Payrolls report, and the numbers shocked the market. The US economy added 172,000 jobs in May, which was roughly double what economists had predicted. The consensus forecast was only 85,000 jobs, with some estimates clustering between 80,000 and 88,000. The unemployment rate held steady at 4.3 percent, right in line with expectations. This was not just a small beat; it was a blowout. The previous month of April had already been revised upward to 179,000 jobs, so th
HighAmbition
#StrongNonfarmPayrollsRekindleRateHikeFear
On June 5, 2026, the United States Bureau of Labor Statistics released the May Nonfarm Payrolls report, and the numbers shocked the market. The US economy added 172,000 jobs in May, which was roughly double what economists had predicted. The consensus forecast was only 85,000 jobs, with some estimates clustering between 80,000 and 88,000. The unemployment rate held steady at 4.3 percent, right in line with expectations. This was not just a small beat; it was a blowout. The previous month of April had already been revised upward to 179,000 jobs, so the labor market was showing no signs of slowing down whatsoever. The three-month average of job gains remained solid, painting a picture of an economy that was still humming along at a steady pace, with companies continuing to hire, consumers continuing to spend, and wages continuing to rise.
The key term in the headline is "Rekindle." This word means to reignite or bring back something that had previously faded. In this context, it means that the fear of interest rate hikes, which had somewhat diminished in earlier months as the market hoped for rate cuts, has now come roaring back to life. Before this NFP report, many investors and market participants had been building their strategies around the expectation that the Federal Reserve would eventually cut interest rates. The narrative was that the labor market was stagnating, layoffs were increasing, and the economy was slowing down, all of which would push the Fed toward easing monetary policy. Wall Street was pricing in a gradual path of rate reductions. But the 172,000 jobs number shattered that narrative completely.
Here is why strong employment data rekindles rate hike fear, step by step. First, when job growth is robust, it signals that the economy is still strong and businesses are confident enough to hire more workers. Second, a strong economy with more people earning wages means more consumer spending, which drives demand for goods and services. Third, when demand outpaces supply, businesses can raise prices, which fuels inflation. Fourth, the Federal Reserve's primary mandate is to keep inflation under control, ideally around 2 percent. When inflation is running above target, as it was at 3.8 percent year-over-year in April 2026, the Fed cannot afford to lower interest rates because that would make borrowing even cheaper and further stimulate spending and inflation. Fifth, instead of cutting rates, the Fed may need to either keep rates elevated for longer or actually raise them further to cool down the economy and bring inflation back toward its target.
The reaction in the interest rate futures market was immediate and dramatic. According to CME's FedWatch tool, the probability of a Federal Reserve rate hike by the December 2026 policy meeting jumped to 68.4 percent, up from just 52 percent the day before the NFP report. For the June meeting, the market still expected the Fed to hold rates steady in the 3.50 to 3.75 percent range, but the December outlook shifted sharply toward tightening. The 10-year Treasury yield surged to 4.52 percent, and the 2-year yield jumped 7 basis points to 4.12 percent. Cleveland Fed President Beth Hammack, considered the most hawkish voting member on the Federal Open Market Committee, stated after the jobs report that it may soon be appropriate to raise rates, given that the labor market appears to be in balance and inflationary pressures remain elevated. Even JPMorgan's chief global strategist David Kelly acknowledged the situation, though he cautioned that it would be dangerous for the Fed to hike rates given the broader context.
The phrase "rekindle" is particularly important because the fear of rate hikes had existed before. In 2023 and early 2024, the Fed had already undertaken a series of rate hikes to combat rising inflation. By 2026, rates had come down from their peak to the 3.50 to 3.75 percent range, and many investors had started to believe the tightening cycle was over. The market had begun to look forward to rate cuts, which would make borrowing cheaper, encourage investment in risk assets like crypto and stocks, and generally create a more favorable environment for growth-oriented investments. But the strong NFP report reminded everyone that the Fed's battle against inflation is not yet won, and that the central bank might need to return to a more aggressive posture.
Now let us discuss what this all means for Bitcoin and the crypto market, step by step, in detail. When the NFP report was released on June 5, Bitcoin was already under pressure from multiple headwinds. The crypto had been declining for about 10 days, losing roughly 19,000 dollars from recent highs. But the NFP data accelerated the sell-off dramatically. Bitcoin dropped approximately 4 percent in the hours immediately following the report. It fell below the critical 60,000 dollar support level, reaching an intraday low of around 59,100 dollars before stabilizing near 59,400 dollars. This marked the weakest price for Bitcoin since October 2024. Over the past week alone, Bitcoin had fallen nearly 20 percent, and from its October peak above 126,000 dollars, it had lost more than 52 percent of its value.
The mechanism through which strong NFP data hits Bitcoin operates through several interconnected channels. The first channel is the interest rate channel. When rate hike expectations increase, borrowing costs rise across the economy. Higher interest rates make it more expensive to finance investments, and they reduce the attractiveness of risk assets like Bitcoin, which do not generate interest or dividends. Investors can earn a safer, guaranteed return by holding Treasury bonds or keeping money in savings accounts, so the relative appeal of risky speculative assets diminishes. The second channel is the dollar strength channel. Strong NFP data typically boosts confidence in the US economy, which strengthens the US dollar. A stronger dollar makes Bitcoin, which is priced in dollars, relatively more expensive for international buyers, reducing global demand. The third channel is the risk appetite channel. When investors fear that monetary policy will tighten, they tend to reduce their exposure to risk assets across the board. This means they pull capital not just from Bitcoin but from stocks, especially high-growth tech stocks, and from other speculative investments. The fourth channel is the liquidity channel. Higher interest rates drain liquidity from the financial system. Less liquidity means less money flowing into markets, which reduces buying pressure and can amplify selling pressure. The fifth channel is the sentiment channel. The psychological impact of rate hike fears creates a negative feedback loop. As prices fall, more investors panic and sell, driving prices even lower, which scares even more investors, and the cycle continues.
The broader crypto market also suffered. Crypto-linked stocks fell sharply after US markets opened on Friday, and the Fear and Greed Index had been sitting at 11, firmly in "Extreme Fear" territory. This reading is significant because it indicates that the market is psychologically positioned at a very pessimistic level, meaning most participants are too fearful to buy. However, historically, such extreme fear readings have sometimes preceded reversals, because once the selling exhausts itself, even a small positive catalyst can spark a rebound.
It is also worth noting that the NFP shock was not the only headwind facing Bitcoin at this time. Multiple negative factors converged simultaneously. Michael Saylor's Strategy, which had been Bitcoin's largest single buyer, had turned seller, removing a major source of demand. Bitcoin ETF investors were heading for the exits, with significant outflows reported. The prospect of interest rate hikes was adding macroeconomic pressure. And speculative capital was increasingly focused on the AI trade rather than crypto, drawing money away from digital assets. The combination of all these factors created what market analysts described as a "good news is bad news" scenario, where strong economic data was actually detrimental to risk assets because it implied tighter monetary policy ahead.
The geopolitical context also matters. The US-Iran conflict had disrupted Strait of Hormuz shipping lanes and pushed oil prices above 100 dollars per barrel at its peak, contributing to CPI inflation running at 3.8 percent year-over-year. This elevated inflation, combined with a resilient labor market, created a difficult situation for the Fed. The central bank was essentially trapped: inflation was above target and being fueled by both domestic demand and geopolitical energy shocks, while the job market showed no signs of weakening that would naturally slow down the economy. This dual pressure meant the Fed had little room to ease policy, which was precisely why rate hike fears were rekindled so strongly.
In summary, the headline "Strong Nonfarm Payrolls Rekindle Rate Hike Fear" captures a critical dynamic. The robust May jobs number of 172,000, double the expected 85,000, forced investors to completely reassess their assumptions about Federal Reserve policy. Where the market had been pricing in gradual rate cuts, it now had to confront the possibility of rate hikes. This shift rippled through every asset class. The dollar strengthened, Treasury yields spiked, gold fell 3.27 percent on the day, equities dropped, and Bitcoin broke below 60,000 dollars to its weakest level since October 2024. The crypto market entered extreme fear territory as multiple headwinds converged. The essential lesson is that in the current macro environment, strong economic data is bad news for risk assets because it implies the Fed will maintain or even increase its restrictive monetary policy stance, keeping the cost of capital high and reducing the attractiveness of speculative investments like Bitcoin.@Gate_Square #ShareYourUSStocksWinNvidia #IranAttacksIsrael #TradeCFDWinGold #Web3SecurityGuide
repost-content-media
  • Reward
  • Comment
  • Repost
  • Share
#BitcoinRalliesOver5Percent
Bitcoin Rallies Over 5 Percent: Is This the Beginning of a Larger Recovery?
Bitcoin has staged an impressive comeback, rallying more than 5 percent after finding strong support near $59,160 and reclaiming the $63,000 level. The recovery has reignited optimism across the cryptocurrency market after weeks of intense selling pressure that pushed Bitcoin to its lowest levels in many months. While the broader market remains cautious due to macroeconomic uncertainty and geopolitical risks, the latest rebound suggests that buyers are once again willing to step into the ma
HighAmbition
#BitcoinRalliesOver5Percent
Bitcoin Rallies Over 5 Percent: Is This the Beginning of a Larger Recovery?
Bitcoin has staged an impressive comeback, rallying more than 5 percent after finding strong support near $59,160 and reclaiming the $63,000 level. The recovery has reignited optimism across the cryptocurrency market after weeks of intense selling pressure that pushed Bitcoin to its lowest levels in many months. While the broader market remains cautious due to macroeconomic uncertainty and geopolitical risks, the latest rebound suggests that buyers are once again willing to step into the market at discounted prices.
The recent correction was driven by a combination of powerful headwinds. Strong US economic data, particularly the Nonfarm Payrolls report, reinforced concerns that the Federal Reserve may keep interest rates elevated for longer than previously expected. At the same time, persistent inflation pressures, rising Treasury yields, and escalating tensions in the Middle East created a risk-off environment that pressured nearly all speculative assets. Bitcoin, which is highly sensitive to global liquidity conditions, became one of the primary casualties of this shift in investor sentiment.
Despite these challenges, the speed and strength of Bitcoin's recovery highlight an important reality about the current market structure. Unlike previous bear markets, institutional participation remains significantly higher than in past cycles. Spot Bitcoin ETFs have introduced a new class of investors into the market, and many of these participants continue to view sharp corrections as strategic buying opportunities rather than reasons to abandon their positions. This institutional presence has helped create stronger demand zones during periods of extreme fear.
Another major factor supporting the rebound is the behavior of long-term holders. On-chain data continues to indicate that a substantial portion of Bitcoin holders have chosen not to sell despite the recent decline. Historically, when long-term investors remain confident during periods of panic, the market often finds a bottom sooner than expected. This reduction in selling pressure allows new buyers to absorb available supply more efficiently, creating the conditions necessary for recovery.
The rally has also been fueled by short-covering activity. During the decline below $60,000, many traders positioned themselves for further downside. When Bitcoin stabilized and began moving higher, these short sellers were forced to close their positions, creating additional buying pressure. This process accelerated the upward move and helped Bitcoin reclaim key technical levels within a relatively short period.
From a technical perspective, the market is now entering a critical phase. The $60,000 zone has become one of the most important support areas on the chart. The fact that Bitcoin quickly recovered after testing this level suggests that institutional and long-term demand remains strong. As long as price action remains above this region, the broader recovery structure remains intact.
The next major obstacle for the bulls lies between $65,000 and $68,000. This area previously acted as support before the recent breakdown and may now serve as resistance. A decisive breakout above this zone would significantly strengthen the bullish case and could trigger a larger move toward $70,000, $75,000, and potentially even $80,000. Market participants should pay close attention to trading volume during any breakout attempt, as strong volume would indicate genuine buying interest rather than a temporary short squeeze.
Macroeconomic conditions remain the most important external factor influencing Bitcoin's direction. The Federal Reserve continues to walk a difficult path between controlling inflation and maintaining economic growth. If future inflation reports show signs of cooling and economic activity begins to moderate, expectations for easier monetary policy could return. Such a scenario would likely benefit Bitcoin and other risk assets by improving liquidity conditions throughout the financial system.
On the other hand, if inflation remains stubbornly high and employment data continues to surprise to the upside, the Fed may be forced to maintain restrictive policies for longer. This would increase borrowing costs, strengthen the US dollar, and potentially limit upside momentum in the cryptocurrency market. For this reason, traders should closely monitor upcoming inflation data, employment reports, and Federal Reserve commentary.
Geopolitical developments also remain a significant source of uncertainty. The ongoing tensions involving Iran and Israel have already impacted commodity markets, energy prices, and investor sentiment. Historically, periods of geopolitical instability can create substantial volatility in Bitcoin. While initial reactions are often negative, prolonged uncertainty can sometimes increase interest in decentralized assets that operate independently of traditional financial systems.
One overlooked factor supporting Bitcoin is the continued reduction in available exchange supply. Over the past several years, a growing amount of Bitcoin has been moved into long-term storage and institutional custody solutions. When fewer coins are available for immediate sale, even moderate increases in demand can produce significant price movements. This supply dynamic could become increasingly important if institutional inflows begin accelerating again.
Another positive development is the gradual recovery of market sentiment. Fear and Greed indicators recently reached extreme fear levels, reflecting widespread pessimism among investors. Historically, such conditions have often appeared near important market bottoms because most potential sellers have already exited their positions. As confidence slowly returns, sidelined capital may begin re-entering the market, providing additional support for prices.
Looking ahead, the bullish scenario remains straightforward. If Bitcoin successfully maintains support above $60,000 and breaks through resistance near $65,000, momentum could quickly carry prices toward $70,000 and beyond. A sustained move above $70,000 would likely attract renewed institutional interest and strengthen confidence that the correction phase is ending.
The bearish scenario cannot be ignored. A failure to hold above $60,000 would expose Bitcoin to another test of the recent low near $59,160. If that support level breaks, the market could revisit lower zones around $57,000 or $55,000 before finding stronger demand. Traders should remain disciplined and avoid becoming overly emotional in either direction.
Trading Strategy
Accumulation remains favorable above the $60,000 support zone for traders with a bullish outlook. Conservative investors may wait for confirmation through a breakout above $65,000 before increasing exposure. Short-term targets remain $65,000, $68,000, $70,000, and $75,000, while longer-term investors may continue focusing on the broader adoption trend and future cycle potential.
Risk management should remain the top priority. Volatility is likely to remain elevated as markets digest economic data, geopolitical developments, and Federal Reserve expectations. Proper position sizing and disciplined stop-loss management remain essential for navigating the current environment.
Bitcoin's rally of more than 5 percent represents more than just a short-term bounce. It reflects renewed buyer confidence, resilient institutional demand, strong long-term holder conviction, and a market that continues to attract capital despite significant macroeconomic challenges. While risks remain and volatility is far from over, the recovery from $59,160 to above $63,000 suggests that Bitcoin may be in the early stages of rebuilding momentum.
The battle between bulls and bears is now centered around the $60,000–$65,000 range. A breakout above resistance could signal the beginning of a broader recovery phase, while a failure to maintain support would increase the risk of another correction. For now, the market appears to be stabilizing, and all eyes are on whether Bitcoin can transform this 5 percent rally into the foundation for its next major upward move.@Gate_Square #ShareYourUSStocksWinNvidia #WinGoldBarsWithGrowthPoints #TradeCFDWinGold
repost-content-media
  • Reward
  • Comment
  • Repost
  • Share
#BitminePlans300MPreferredStockOffering
BitMine Immersion Technologies (BMNR) has announced a major capital raising initiative of approximately $300 million through a Series A Perpetual Preferred Stock issuance. The structure includes 3 million shares priced at $100 each, offering a 9.5% annual cumulative dividend, paid weekly when declared. While this appears to be a conventional financial instrument on the surface, the real market interpretation is far more significant: it is increasingly being viewed as a large-scale institutional liquidity pipeline potentially directed toward cryptocurren
HighAmbition
#BitminePlans300MPreferredStockOffering
BitMine Immersion Technologies (BMNR) has announced a major capital raising initiative of approximately $300 million through a Series A Perpetual Preferred Stock issuance. The structure includes 3 million shares priced at $100 each, offering a 9.5% annual cumulative dividend, paid weekly when declared. While this appears to be a conventional financial instrument on the surface, the real market interpretation is far more significant: it is increasingly being viewed as a large-scale institutional liquidity pipeline potentially directed toward cryptocurrency accumulation.
This development arrives at a critical stage for global markets where Bitcoin, Ethereum, gold, and oil are all reacting to a combination of macroeconomic stress, geopolitical instability, and shifting institutional capital flows. The importance of BitMine’s action is not only in the size of the raise, but in the strategic signal it sends regarding long-term crypto demand from publicly traded companies.
1. Current Market Environment (Macro + Crypto + Commodities)
At the time of analysis, global markets are positioned in a highly sensitive equilibrium:
Bitcoin (BTC): $63,200
Ethereum (ETH): $1,684
Gold (XAU/USD): $4,320
WTI Crude Oil: $94.50
Each of these assets is responding to overlapping macro forces:
Key macro drivers:
Persistent inflation pressure in the US economy
Strong labor market data reducing expectations of near-term rate cuts
Elevated Treasury yields tightening global liquidity
US Federal Reserve maintaining restrictive policy stance
Iran–Israel geopolitical conflict increasing risk premiums
Oil supply disruption fears via the Strait of Hormuz
Mixed institutional flows in crypto ETFs
This environment creates a “dual-pressure market” where:
Risk assets struggle due to liquidity tightening
Safe-haven assets gain from uncertainty
Commodities react to geopolitical disruption
2. BitMine Strategic Positioning (Core Business Shift)
BitMine is no longer functioning as a traditional technology or mining-focused firm in market perception. Instead, it is increasingly classified as a crypto treasury accumulation entity.
Current reported holdings include:
ETH: 4,000,000+ ETH (approx. $6.7B+ value at $1,684)
BTC: ~192 BTC (approx. $12M+)
Total crypto + cash exposure: ~$13.4B
Additional equity exposure in crypto-linked firms
This places BitMine among the largest institutional crypto holders globally, comparable in strategic influence (not structure) to early Bitcoin treasury adopters.
The central strategy is:
Increase crypto holdings per share over time, using capital markets as a funding engine.
This model creates a self-reinforcing structure: capital raise → crypto accumulation → balance sheet expansion → market revaluation → further capital access
3. Structure of the $300M Preferred Offering (Financial Breakdown)
Total raise: $300,000,000
Security type: Series A Perpetual Preferred Stock
Units: 3,000,000 shares
Price per share: $100
Dividend: 9.5% annually (cumulative)
Payment schedule: weekly (conditional on declaration)
This structure is significant because:
9.5% yield implies $28.5M annual dividend obligation
Likely requires yield generation via staking + treasury strategies
Creates incentive for productive capital deployment rather than passive holding
This makes the instrument effectively:
part fixed income product
part crypto-linked yield instrument
part leveraged digital asset accumulation vehicle
4. Bitcoin Market Structure and Price Context
Bitcoin Current Market: $63,200
Recent price structure:
Recent low: $59,160
Recovery zone: $60,000 – $63,500
Previous high cycle: $126,000 (2025 peak)
Market condition:
Approx. -50% from cycle peak
High volatility compression phase
Institutional accumulation zone forming
Key Bitcoin dynamics:
(A) Supply Scarcity Effect
Bitcoin supply is capped at 21 million coins. Institutional treasury accumulation reduces circulating liquidity, especially when assets are moved into long-term custody.
At current price:
$300M = approx. 4,700 BTC
Total circulating supply impact appears small numerically
But liquidity impact is amplified due to OTC accumulation behavior
(B) ETF + Treasury Dual Demand
Market now has two structural demand engines:
Spot ETFs (passive institutional inflow)
Corporate treasuries (active accumulation)
This dual structure creates sustained demand pressure even during corrections.
(C) Liquidity Sensitivity
Bitcoin is highly sensitive to:
US dollar strength
Treasury yields (currently ~4%+ region)
Fed rate expectations
Global liquidity cycles
5. Ethereum Market Structure (Key Focus Asset)
Ethereum Current Price: $1,684
Ethereum is strategically more important in this specific narrative due to BitMine’s accumulation bias.
Ethereum strengths in this context:
Proof-of-stake yield generation (staking rewards)
Reduced supply via locked staking contracts
Increasing institutional infrastructure adoption
Tokenization and real-world asset integration trend
If even a moderate portion of $300M flows into ETH:
potential ETH absorption: ~170,000 ETH to 200,000 ETH equivalent
significant short-term liquidity compression possible
Ethereum market structure:
Major support: $1,600 / $1,550 / $1,450
Resistance: $1,750 / $1,850 / $2,000
ETH tends to outperform BTC in percentage terms during capital inflow phases due to lower market cap elasticity.
6. Gold Market Position (Safe-Haven Dynamics)
Gold Current Price: $4,320
Gold remains structurally strong despite short-term corrections:
Historical peak: ~$5,598 earlier cycle high
Yearly performance: +40% to +41%
Current phase: consolidation after macro-driven rally
Gold is reacting to:
geopolitical tension demand
inflation hedge positioning
central bank accumulation behavior
USD volatility cycles
Key levels:
Support: $4,300 / $4,200 / $4,000
Resistance: $4,500 / $4,600 / $4,800
Gold and Bitcoin currently operate in parallel but different narratives:
Gold = traditional safety hedge
Bitcoin = digital liquidity + speculative hedge
7. Oil Market Shock (Geopolitical Supply Risk)
Oil Current Price: $94.50
Oil is the most directly impacted asset due to the Iran–Israel conflict and Strait of Hormuz disruption risks.
Key structural issue:
~20% of global oil passes through Hormuz
~20% LNG flow affected
Supply stress implications:
global inflation pressure increases
transportation costs rise
manufacturing input costs increase
central bank policy becomes more restrictive
Oil scenarios:
Upside breakout: $100 → $105 → $110
Downside correction: $90 → $85
Oil at elevated levels directly impacts Bitcoin and risk assets through inflation and liquidity tightening channels.
8. Market Interconnection Model (Critical Insight)
All major assets are now interconnected:
If oil rises:
inflation rises
Fed remains hawkish
BTC & ETH face liquidity pressure
If gold rises:
risk-off sentiment increases
capital shifts away from equities/crypto
If BTC rises:
risk-on sentiment returns
ETH typically follows with higher beta movement
If institutional crypto raises increase:
long-term structural bullish cycle strengthens
9. Risk Factors for Crypto Impact
Despite bullish structural signals, key risks remain:
No confirmation that full $300M will go into BTC or ETH
Heavy allocation may go to Ethereum only
ETF outflows remain inconsistent
High interest rate environment suppresses liquidity
Geopolitical escalation can trigger sudden sell-offs
Treasury company valuations already under pressure
Recent data shows:
crypto treasury sector lost significant market value in recent months
market is transitioning from hype phase to consolidation phase
10. Full Trading Structure Summary
Bitcoin (BTC)
Current: $63,200
Bull case: $65,000 → $68,000 → $70,000 → $75,000
Bear case: $60,000 → $59,160 → $57,000 → $55,000
Ethereum (ETH)
Current: $1,684
Bull case: $1,750 → $1,850 → $2,000 → $2,200
Bear case: $1,600 → $1,550 → $1,450
Oil (WTI)
Current: $94.50
Bull case: $100 → $105 → $110
Bear case: $90 → $85
Gold
Current: $4,320
Bull case: $4,500 → $4,600 → $4,800
Bear case: $4,200 → $4,000
11. Final Conclusion (Core Market Message)
BitMine’s $300M preferred stock offering is not an isolated corporate financing event—it is part of a broader structural transformation where institutional capital markets are increasingly being used to fund direct exposure to digital assets.
The key implications are:
Bitcoin gains structural support through treasury accumulation narrative
Ethereum may receive disproportionate benefit due to BitMine’s historical strategy
Liquidity conditions remain the primary macro driver of all crypto assets
Oil-driven inflation risk continues to shape Federal Reserve policy
Gold remains the macro hedge against uncertainty
Ultimately, this development reinforces one central theme:
Crypto markets are increasingly being driven not by retail speculation alone, but by structured institutional capital flows that operate through corporate balance sheets, ETFs, and treasury expansion models.
The next phase of price action across Bitcoin and Ethereum will depend not only on market sentiment—but on how aggressively institutional capital deployment accelerates following this and similar capital raises.@Gate_Square #ShareYourUSStocksWinNvidia #TradeCFDWinGold
repost-content-media
  • Reward
  • Comment
  • Repost
  • Share
#GatePartnersWithAlpacaToBridgeCryptoAndStocks
Gate has officially announced a strategic partnership with Alpaca, a US-regulated self-clearing broker-dealer, marking a significant milestone in the evolution of multi-asset trading platforms. This collaboration is designed to bring real US stock trading directly into the Gate ecosystem, enabling users to access both cryptocurrency markets and traditional financial assets within a single unified platform. It represents a major step in Gate’s long-term strategy to transform from a crypto exchange into a global financial super-app.
At its core, th
HighAmbition
#GatePartnersWithAlpacaToBridgeCryptoAndStocks
Gate has officially announced a strategic partnership with Alpaca, a US-regulated self-clearing broker-dealer, marking a significant milestone in the evolution of multi-asset trading platforms. This collaboration is designed to bring real US stock trading directly into the Gate ecosystem, enabling users to access both cryptocurrency markets and traditional financial assets within a single unified platform. It represents a major step in Gate’s long-term strategy to transform from a crypto exchange into a global financial super-app.
At its core, this partnership is focused on eliminating the long-standing divide between digital assets and traditional equity markets. For years, investors have been forced to operate across separate financial systems. Crypto traders use exchanges for digital assets like Bitcoin and Ethereum, while stock investors rely on traditional brokerage accounts to access equities. This separation creates friction, slows down capital movement, and increases complexity for global investors. Gate and Alpaca aim to solve this problem by merging both ecosystems into a single seamless trading experience.
With this integration, users will be able to trade cryptocurrencies, US stocks, and ETFs side by side without switching platforms, converting funds manually, or dealing with multiple onboarding processes. This creates a unified financial environment where capital can move freely between asset classes in real time.
Alpaca plays a critical role in making this vision possible. As a regulated US broker-dealer, Alpaca provides institutional-grade brokerage infrastructure that powers the entire lifecycle of stock trading. This includes order execution, clearing, settlement, custody of assets, dividend processing, and handling corporate actions. Alpaca’s API-first architecture is already used by fintech platforms globally, supporting millions of brokerage accounts. By integrating this system, Gate can offer full stock trading functionality without building a traditional brokerage infrastructure from the ground up, which would otherwise require years of development and massive regulatory overhead.
Through this partnership, Gate users will gain access to more than 10,000 US-listed stocks and ETFs across major exchanges including NASDAQ, NYSE, NYSE Arca, NYSE American, and BATS. This coverage spans nearly the entire US equity market. It includes globally recognized technology leaders such as Apple, Microsoft, Amazon, Google (Alphabet), Meta, Tesla, and NVIDIA, as well as traditional industrial giants, financial institutions, healthcare companies, and energy firms. In addition, users can invest in major ETFs such as the S&P 500, Nasdaq 100, and sector-based funds that provide diversified exposure to the broader market.
One of the most impactful features of this system is fractional share investing. Gate enables users to invest in US stocks starting from just $1, removing one of the biggest barriers in traditional equity markets. Previously, high stock prices often prevented small retail investors from accessing premium companies. For example, buying a full share of companies like Amazon or NVIDIA could require hundreds or even thousands of dollars. Fractional ownership solves this problem by allowing users to purchase a portion of a share, making investing far more flexible, inclusive, and globally accessible.
Another major innovation is the use of USDT-based trading for stocks. Users can directly deploy stablecoins like USDT to purchase equities without needing to convert funds into fiat currencies through banks or external financial institutions. This significantly reduces friction and improves speed. A user can hold Bitcoin or Ethereum, convert it into USDT within Gate, and immediately invest in Apple or Tesla stocks—all within the same ecosystem. This crypto-native workflow is designed to preserve the efficiency and speed that digital asset users are already familiar with.
A key distinction in Gate’s offering is that it provides real stock ownership, not derivative-based exposure such as CFDs. When users buy a stock on Gate, they are acquiring actual shares of the underlying company. This includes full ownership rights such as dividend eligibility and participation in corporate actions like stock splits or mergers. Unlike CFD products, there are no hidden overnight financing fees or leveraged derivative structures involved. This makes the product more suitable for long-term investors who want genuine exposure to equity markets rather than short-term speculative instruments.
From a portfolio management perspective, this integration offers significant advantages.
Instead of managing separate accounts across crypto exchanges and traditional brokerage platforms, users can now consolidate all their assets into one unified dashboard. This includes cryptocurrencies, US stocks, ETFs, and potentially other financial instruments in the future. The ability to view and manage everything in one place improves transparency, simplifies decision-making, and enhances strategic asset allocation.
For global investors, this unified structure also enables more efficient diversification. A user can balance risk across Bitcoin, Ethereum, technology stocks, and index ETFs without moving between platforms or dealing with settlement delays. This level of integration allows for faster reactions to market movements and more precise portfolio rebalancing.
From a broader industry perspective, the Gate-Alpaca partnership reflects a powerful global trend: the convergence of crypto platforms and traditional financial systems. Exchanges are no longer limited to digital asset trading alone. Instead, they are evolving into comprehensive financial ecosystems that offer access to multiple asset classes under one roof. This shift indicates that the boundary between decentralized finance and traditional finance is gradually dissolving.
As regulatory clarity improves and infrastructure becomes more advanced, more platforms are expected to follow this model. The integration of stocks, crypto, ETFs, commodities, and other financial instruments into a single ecosystem represents the next phase of financial evolution. Gate’s partnership with Alpaca positions it at the forefront of this transformation.
Looking ahead, this model could expand even further. Future developments may include access to bonds, options, mutual funds, commodities, forex, and other global investment instruments. If successfully executed, this would create a truly all-in-one financial platform where users can manage every aspect of their investment portfolio without leaving a single application.
Ultimately, the Gate and Alpaca collaboration represents a foundational shift in how global investing may work in the future. It removes barriers between financial systems, increases accessibility for retail investors, and moves the industry closer to a unified financial infrastructure where crypto and traditional markets operate as one interconnected ecosystem.
@Gate_Square #ShareYourUSStocksWinNvidia #PredictNBAFinalsWin20000U #BitcoinETFSees7272BTCOutflow
repost-content-media
  • Reward
  • Comment
  • Repost
  • Share
#TradeCFDWinGold
CFD stands for Contract for Difference. It is a popular financial instrument that allows traders to speculate on the price movements of various assets without actually owning the underlying asset. When you trade CFDs, you enter into a contract with a broker to exchange the difference in price of an asset from the time the contract is opened to when it is closed. This means you can profit from both rising and falling markets, making CFDs a versatile tool for traders.
CFD trading works on the principle of margin and leverage. Leverage allows you to control a larger position siz
HighAmbition
#TradeCFDWinGold
CFD stands for Contract for Difference. It is a popular financial instrument that allows traders to speculate on the price movements of various assets without actually owning the underlying asset. When you trade CFDs, you enter into a contract with a broker to exchange the difference in price of an asset from the time the contract is opened to when it is closed. This means you can profit from both rising and falling markets, making CFDs a versatile tool for traders.
CFD trading works on the principle of margin and leverage. Leverage allows you to control a larger position size with a relatively small amount of capital. For example, with a leverage of one to twenty, you can control a position worth twenty thousand dollars by depositing just one thousand dollars as margin. This margin is essentially a good faith deposit that secures your position. The margin requirement represents the portion of your capital needed to open and maintain a leveraged position.
One of the primary advantages of CFD trading is flexibility. You can trade various markets including forex pairs, commodities like gold and oil, stock indices, and individual stocks. Gold CFDs are particularly popular among traders because gold serves as both a commodity and a safe haven asset. During times of economic uncertainty and geopolitical tensions, investors flock to gold, often driving its price higher. This makes gold an attractive asset for traders seeking opportunities in volatile markets.
To start trading CFDs, you first need to choose a reliable broker that offers CFD trading services. Once you have an account, you can select the asset you want to trade, decide whether you believe the price will rise or fall, and open a position accordingly. If you expect the price to increase, you open a long position or buy. If you anticipate a price decrease, you open a short position or sell. The profit or loss is determined by the difference between the entry price and the exit price, multiplied by the position size.
Risk management is crucial in CFD trading. Because leverage amplifies both gains and losses, it is essential to use stop loss orders to limit potential losses. A stop loss automatically closes your position when the price reaches a predetermined level, protecting your capital from excessive drawdowns. Similarly, take profit orders can lock in gains when the price reaches your target level. Position sizing is another critical aspect of risk management. Never risk more than a small percentage of your trading capital on a single trade.
Understanding market analysis is fundamental to successful CFD trading. Technical analysis involves studying price charts and using indicators to identify trends and potential entry and exit points. Common technical indicators include moving averages, relative strength index, and support and resistance levels. Fundamental analysis focuses on economic data, news events, and geopolitical developments that can impact asset prices. For gold trading specifically, factors such as interest rates, inflation data, currency movements, and central bank policies play significant roles.
Trading costs in CFD trading typically include spreads, which are the difference between the buy and sell prices, and overnight financing charges if you hold positions beyond the trading day. Some brokers may also charge commissions. It is important to understand these costs as they affect your overall profitability.
Winning Strategies for Gold CFD Trading
Gold trading requires a well defined strategy to achieve consistent profitability. One effective approach is trend following. This strategy involves identifying the direction of the gold price trend and trading in that direction. When gold is in an uptrend, you look for opportunities to buy or go long. When gold is in a downtrend, you look for opportunities to sell or go short. Trend following works because trends tend to persist over time, and riding a trend can generate substantial profits.
Another popular strategy is breakout trading. This involves entering a trade when the price breaks through significant support or resistance levels. Breakouts often signal the beginning of a new trend or the continuation of an existing one with increased momentum. To trade breakouts effectively, you need to identify key levels on the price chart and wait for a confirmed break with strong volume.
Range trading is suitable when gold prices are moving sideways between established support and resistance levels. In this strategy, you buy near support and sell near resistance, profiting from the price oscillations within the range. This approach requires patience and discipline, as you must wait for the price to reach the boundaries of the range before entering trades.
Technical analysis plays a vital role in gold CFD trading. Moving averages help smooth out price data and identify trend direction. The fifty day and two hundred day moving averages are commonly used to determine long term trends. When the shorter term moving average crosses above the longer term moving average, it signals a potential uptrend. When it crosses below, it signals a potential downtrend.
Support and resistance levels are price points where the market has historically reversed or paused. These levels act as barriers that prices struggle to break through. Identifying these levels helps you determine optimal entry and exit points. Round numbers and previous swing highs and lows often serve as significant support and resistance levels.
Risk management separates successful traders from unsuccessful ones. Always use stop loss orders to protect your capital. Determine your stop loss level before entering a trade based on technical levels or a percentage of your account balance. A common rule is to risk no more than one to two percent of your trading capital on any single trade. This ensures that a string of losses will not devastate your account.
Position sizing is equally important. Calculate the appropriate position size based on your stop loss distance and risk percentage. This prevents you from taking excessively large positions that could wipe out your account on a single adverse move. Consistent position sizing helps maintain emotional stability and prevents impulsive decisions.
Understanding market sentiment and economic factors enhances your gold trading decisions. Gold often moves inversely to the US dollar and interest rates. When interest rates are low, gold becomes more attractive as it does not yield interest. During periods of inflation or economic uncertainty, demand for gold as a safe haven increases. Monitoring economic calendars for central bank announcements, inflation reports, and geopolitical events helps you anticipate potential market movements.
Trading psychology is often overlooked but critically important. Fear and greed are the two primary emotions that drive market behavior. Fear can cause you to exit profitable trades too early or hesitate to enter valid setups. Greed can lead to overtrading, ignoring stop losses, or taking excessive risks. Developing emotional discipline through a trading plan and maintaining a trading journal helps you identify and correct psychological weaknesses.
Backtesting your strategies on historical data validates their effectiveness before risking real capital. Keep a detailed trading journal documenting your trades, including entry and exit reasons, position sizes, and emotional state. Regularly reviewing your journal reveals patterns in your trading behavior and areas for improvement.
Patience is essential in gold trading. Not every day presents a high probability trading opportunity. Waiting for the right setup according to your strategy prevents overtrading and preserves capital for better opportunities. Quality trades are more important than quantity.
Continuous learning and adaptation keep you competitive in evolving markets. Stay updated with market news, refine your strategies based on performance, and remain open to new ideas while maintaining the core principles of risk management and discipline. Successful gold CFD trading combines technical skill, psychological control, and consistent execution of a proven strategy.@Gate_Square #PredictWorldCupShare20000U #ShareYourUSStocksWinNvidia #BitcoinRalliesOver5Percent
repost-content-media
  • Reward
  • Comment
  • Repost
  • Share
#PutinVisitsChina
Russian President Vladimir Putin’s state visit to China on May 19–20, 2026, was not a normal diplomatic engagement but a strategically timed geopolitical signal that reflected deeper global realignments already in motion across trade systems, energy markets, and financial power structures. The visit took place during a period of elevated macro uncertainty where global markets were already sensitive to inflation pressures, energy volatility, geopolitical fragmentation, and shifting monetary influence between East and West.
The meeting between Russia and China was widely inter
HighAmbition
#PutinVisitsChina
Russian President Vladimir Putin’s state visit to China on May 19–20, 2026, was not a normal diplomatic engagement but a strategically timed geopolitical signal that reflected deeper global realignments already in motion across trade systems, energy markets, and financial power structures. The visit took place during a period of elevated macro uncertainty where global markets were already sensitive to inflation pressures, energy volatility, geopolitical fragmentation, and shifting monetary influence between East and West.
The meeting between Russia and China was widely interpreted as a reinforcement of a long-term strategic alignment that is gradually reshaping global economic architecture, particularly in areas related to trade settlement systems, energy security, and alternative financial cooperation mechanisms.
2. Strategic Direction: Movement Toward a Multipolar Global Order
A central theme emerging from the summit was the continued strengthening of a multipolar world structure, where global influence is no longer concentrated in a single financial center but distributed across multiple regional power blocs. Both Russia and China emphasized expanded cooperation in trade, infrastructure, energy, and technology, while also highlighting the importance of reducing dependency on traditional Western financial systems.
This shift does not occur abruptly but gradually through repeated agreements, bilateral settlements, and infrastructure alignment, which collectively signal a long-term transition toward diversified global economic influence. Markets interpret this as a structural change rather than a short-term diplomatic event.
3. Economic Cooperation: Deepening Sectoral Integration
During the visit, multiple agreements were discussed across key strategic sectors including energy cooperation, artificial intelligence development, transportation infrastructure, scientific research, defense-related collaboration, and media coordination frameworks.
One of the most significant long-term energy discussions involved pipeline expansion projects such as the Power of Siberia 2 initiative, which, if fully developed, could significantly increase natural gas flow from Russia to China. This reflects a broader shift where Russia increasingly relies on Asian demand while China secures long-term energy supply stability.
These developments indicate not only economic cooperation but also structural reorientation of global trade routes.
4. Energy Markets: Inflation Pressure and Global Pricing Sensitivity
Energy markets responded to the broader geopolitical environment surrounding the summit rather than the event itself. Oil prices remained elevated during this period, with WTI trading near $99–$108 and Brent crude maintaining a higher range around $105–$110+, reflecting persistent supply risk premiums.
Several underlying drivers contributed to this volatility, including geopolitical instability in the Middle East, ongoing disruptions related to the Russia–Ukraine conflict, and structural uncertainty in global supply chains. Higher energy prices continue to play a central role in global inflation dynamics, influencing central bank decisions and risk asset performance across markets.
5. Financial System Shift: Gradual Expansion of Non-Dollar Trade
One of the most structurally important themes reinforced during the summit was the continued expansion of trade settlements outside the U.S. dollar system. Increased use of local currencies such as the Chinese yuan and Russian ruble in bilateral trade reflects a gradual reconfiguration of global settlement networks.
While this transition is not immediate or absolute, the direction is clear: countries are increasingly exploring alternative financial frameworks that reduce reliance on traditional Western banking channels.
From a macro perspective, this trend is significant because it introduces long-term questions about currency dominance, liquidity distribution, and global reserve asset competition.
₿ 6. Bitcoin Market Behavior: Stability Instead of Shock Reaction
Despite strong geopolitical narratives, Bitcoin did not experience a dramatic breakout or collapse during the summit period. Instead, it demonstrated stable and controlled price behavior, trading in a relatively narrow range around $77,000–$78,000 after earlier monthly fluctuations.
This reflects a structural change in Bitcoin market dynamics, where price action is increasingly influenced by institutional flows, macro liquidity conditions, interest rate expectations, and ETF-driven capital movements rather than short-term geopolitical headlines.
Bitcoin’s reaction suggests that it is evolving from a purely sentiment-driven asset into a macro-integrated financial instrument.
7. Institutional vs Retail Interpretation Gap
A clear divergence emerged between retail expectations and institutional positioning. Many retail participants anticipated a strong bullish reaction driven by de-dollarization narratives and geopolitical fragmentation. However, institutional investors remained focused on broader macro indicators such as inflation data, Federal Reserve policy outlook, bond yield behavior, and ETF capital flows.
As a result, the market exhibited strong narrative impact in the long term, while short-term price movement remained relatively muted, highlighting the difference between storytelling-driven expectations and liquidity-driven market behavior.
8. Gold Market Context: Parallel Safe-Haven Dynamics
Gold continued to perform strongly within a broader safe-haven framework, trading in the range of approximately $4,500–$4,700 per ounce during the same period. Its strength was supported by inflation uncertainty, geopolitical risk premiums, and concerns regarding global financial fragmentation.
Interestingly, Bitcoin maintained partial correlation with gold behavior, reinforcing its evolving narrative as a digital counterpart to traditional safe-haven assets, particularly among institutional investors who view it as a hedge against long-term monetary uncertainty.
9. Middle East and Global Risk Expansion
Additional geopolitical pressure from the Middle East contributed to elevated global risk sensitivity. Ongoing tensions created concerns around shipping routes, energy infrastructure security, and potential escalation scenarios that could significantly impact oil supply stability.
Such conditions typically increase inflation expectations while simultaneously reducing investor risk appetite, which affects both traditional and digital asset markets through liquidity tightening and volatility expansion.
10. Russia–Ukraine Conflict: Persistent Macro Influence
The ongoing conflict between Russia and Ukraine continues to act as a structural macro driver affecting energy flows, commodity pricing, and global risk sentiment. Continuous disruptions in infrastructure and supply chains maintain elevated uncertainty levels across global markets.
This sustained instability contributes to persistent inflation concerns and reinforces demand for assets perceived as neutral or decentralized in nature.
11. Crypto Market Structure: Altcoin Stability with Select Strength
While Bitcoin remained relatively stable, major altcoins also reflected macro-driven behavior without extreme volatility. Ethereum traded in the $4,100–$4,300 range, while Solana remained in the mid-$80 zone, showing consolidation rather than breakdown.
The broader crypto market was influenced by AI-related narratives, infrastructure development trends, and increasing institutional participation, which helped maintain structural support across major assets.
12. Key Bitcoin Structural Levels
Market participants closely monitored important psychological and technical levels including $75,000 as a major support zone, $80,000 as a resistance boundary, and $85,000 as a breakout confirmation level, while long-term expectations remained focused on higher macro targets depending on liquidity expansion cycles.
13. Overall Market Interpretation: Structural Change Over Immediate Reaction
The most important conclusion from the summit is that its impact was not reflected in immediate explosive price movements but rather in long-term reinforcement of existing global trends. These include increasing geopolitical fragmentation, gradual expansion of multipolar financial systems, continued discussion around de-dollarization, and strengthening narratives around Bitcoin as a neutral digital asset.
The key takeaway is that modern financial markets no longer react solely to geopolitical events in isolation; instead, they integrate such events into broader macro frameworks where liquidity, institutional positioning, and monetary policy carry significantly more weight in short-term pricing behavior.
The Putin visit china summit represents a significant geopolitical signal that reinforces long-term structural transitions in global trade, energy systems, and financial alignment between major world powers. While immediate market reactions remained controlled, the broader implications strengthen ongoing macro narratives involving de-dollarization, energy-driven inflation cycles, and the evolving role of Bitcoin as a globally neutral asset within a fragmented financial system.
This event does not create a short-term market shock, but it adds another layer to an already shifting global order where economic influence is becoming increasingly distributed and interconnected across multiple power centers.
repost-content-media
  • Reward
  • Comment
  • Repost
  • Share
#PYTHUnlocks2.13BillionTokens
PYTH Network (PYTH) 2.13 Billion Token Unlock — The Biggest Oracle Supply Shock of 2026
A Critical Moment for PYTH and the Entire Altcoin Market
The crypto market is now entering one of the most sensitive supply events of 2026 as PYTH Network prepares to unlock approximately 2.13 billion PYTH tokens between May 19–21. Across the entire digital asset industry, this unlock is being viewed as a major stress test not only for PYTH itself but also for overall market liquidity, investor confidence, and the ability of utility-focused projects to survive massive inflatio
HighAmbition
#PYTHUnlocks2.13BillionTokens
PYTH Network (PYTH) 2.13 Billion Token Unlock — The Biggest Oracle Supply Shock of 2026
A Critical Moment for PYTH and the Entire Altcoin Market
The crypto market is now entering one of the most sensitive supply events of 2026 as PYTH Network prepares to unlock approximately 2.13 billion PYTH tokens between May 19–21. Across the entire digital asset industry, this unlock is being viewed as a major stress test not only for PYTH itself but also for overall market liquidity, investor confidence, and the ability of utility-focused projects to survive massive inflationary phases without losing long-term momentum.
At current market prices fluctuating around $0.038–$0.044, the unlock carries an estimated valuation between $81 million and $94 million. However, beyond the dollar amount, what truly matters is the psychological effect this event is creating inside the market. Traders understand that sudden supply expansion can rapidly weaken price action if demand fails to absorb new circulation fast enough.
This is why PYTH has become one of the most heavily discussed tokens across crypto communities during May 2026.
Unlike smaller unlocks that markets often ignore, this event is large enough to influence sentiment across DeFi infrastructure, oracle projects, Layer-2 ecosystems, and even broader altcoin liquidity conditions. The market is now entering a phase where every major transaction, exchange inflow, whale wallet movement, and staking shift is being monitored aggressively.
Why The 2.13 Billion Unlock Matters So Much
The unlock itself represents nearly 37% of PYTH’s pre-event circulating supply and approximately 21.3% of the total 10 billion token supply. Before the unlock, circulating supply remained near 5.75 billion PYTH, but after the event circulation could expand toward the 7.87–7.9 billion range.
That is an enormous increase within a very short time period.
In crypto markets, price is heavily influenced by the balance between supply and demand. When circulating supply expands aggressively while liquidity conditions remain weak, markets usually struggle to maintain stability. Even if long-term fundamentals remain strong, short-term volatility can still become extremely violent.
Another major factor is trader psychology. In crypto, fear often arrives before actual selling. Many traders begin reducing exposure days or even weeks before major unlocks because they expect others to sell first. This creates pre-event weakness that can sometimes become stronger than the unlock itself.
That behavior is already visible in PYTH’s recent price structure.
Allocation Breakdown — Where The Tokens Are Going
The unlocked PYTH supply is distributed across several categories:
~1.13 Billion PYTH → Ecosystem Growth This allocation supports partnerships, developer expansion, liquidity programs, protocol adoption, grants, and long-term ecosystem growth initiatives.
~537.5 Million PYTH → Publisher Rewards These rewards compensate the oracle publishers and data providers responsible for delivering real-time market information into the PYTH infrastructure.
Remaining Allocation → Team, Contributors, Early Investors & Protocol Operations This section includes operational funding, contributor incentives, strategic holders, private-sale participants, and long-term ecosystem expansion programs.
However, one extremely important detail is often ignored by panic-driven traders:
Not all 2.13 billion tokens instantly become active sell pressure.
A meaningful portion may remain locked inside ecosystem initiatives, staking structures, treasury management systems, governance allocations, or long-term strategic holdings. Because of this, many analysts estimate the real immediate liquid supply entering exchanges could initially remain closer to 8–10% rather than the full 37% headline figure dominating social media.
Still, under fragile market conditions even partial sell pressure can create heavy volatility.
PYTH Is Facing a Liquidity War
This unlock is not simply about “tokens entering circulation.” It is actually a battle between liquidity and confidence.
If demand remains strong enough to absorb new supply, PYTH could stabilize and eventually recover. But if exchange inflows rise aggressively while buy-side liquidity weakens, the market may experience a prolonged downside cycle similar to previous unlock periods.
This is exactly why analysts are calling the event one of the largest “supply absorption tests” of 2026.
Large holders and institutional participants are now expected to play a decisive role. If whales begin aggressively depositing tokens onto exchanges, retail fear could accelerate quickly. On the other hand, if staking participation increases and ecosystem wallets retain holdings instead of selling, the market could absorb pressure far more efficiently than expected.
The next few weeks may determine whether PYTH enters a deeper bearish phase or transforms this period into a major accumulation zone.
Historical Performance & Why Traders Are Nervous
The market’s fear is not random.
Previous PYTH unlock cycles during May 2024 and May 2025 were followed by extended bearish periods where the token suffered drawdowns between approximately 65–72% over subsequent months.
That historical weakness is one of the main reasons traders remain extremely cautious now.
Crypto markets usually move through three stages during large unlock cycles:
Phase One → Pre-Unlock Fear Selling Traders reduce exposure ahead of uncertainty.
Phase Two → Unlock Volatility Large wallet movements and liquidation activity create sharp price swings.
Phase Three → Supply Absorption Markets eventually stabilize once buyers absorb circulating supply.
Right now, PYTH is transitioning between the fear stage and the volatility stage.
Technical Analysis & Important Price Levels
From a technical perspective, PYTH continues trading inside a weak bearish structure around the $0.038–$0.044 range.
Immediate Resistance Levels: $0.044 – $0.045 $0.050 – $0.054
Major Resistance Zones: $0.057 $0.061 $0.065
These areas remain critical because sellers repeatedly regained control near these levels during previous recovery attempts. If PYTH cannot reclaim higher resistance regions, bearish momentum could continue dominating the market for several more weeks.
Key Support Zones: $0.038 – $0.039 $0.035 – $0.036
Critical Breakdown Levels: $0.030 $0.025 $0.020
The $0.038 region has now become one of the most important psychological zones for the entire market structure. A breakdown below $0.035 could trigger aggressive liquidations, stop-loss cascades, and stronger panic across derivatives markets.
Some bearish long-range projections even discuss the possibility of PYTH revisiting the $0.020 region if macro crypto conditions deteriorate further and demand fails to recover.
However, bullish recovery scenarios still remain possible.
If the market absorbs supply efficiently and PYTH reclaims the $0.060–$0.065 region with strong volume support, momentum could shift significantly. Under stronger recovery conditions, traders may begin targeting $0.075, $0.085, and eventually the psychological $0.10 barrier once again.
PYTH’s Real Strength — Why Long-Term Investors Still Believe
Despite heavy unlock fears, PYTH remains one of the most important oracle infrastructures in the crypto ecosystem.
The network powers real-time price feeds across Solana, Sui, Aptos, Ethereum Layer-2 ecosystems, and multiple DeFi applications including lending markets, perpetual exchanges, derivatives platforms, and liquidity systems.
Without reliable oracle infrastructure, decentralized finance cannot function efficiently.
This is the strongest bullish argument supporting PYTH long term.
Unlike speculative meme-driven assets, PYTH provides infrastructure utility that many DeFi systems genuinely depend on. This creates long-term relevance even during periods of severe short-term volatility.
Bullish Arguments Supporting PYTH: Growing oracle demand across DeFi ecosystems. Increasing adoption on Layer-2 networks. Higher staking participation may reduce active circulating supply. Institutional accumulation during panic phases could stabilize valuation. A relief rally may emerge if exchange inflows remain smaller than expected. Long-term ecosystem growth could eventually absorb inflation pressure.
Some investors now believe the unlock could eventually create a major accumulation opportunity if panic becomes excessive.
Major Risks The Market Is Watching Closely
Several important risks still remain:
Large exchange inflows from unlock recipients. Weak altcoin liquidity across the broader market. Heavy derivatives leverage increasing liquidation risks. Simultaneous unlocks involving ZRO and KAITO fragmenting liquidity. Continued bearish sentiment suppressing recovery attempts. Whale-driven volatility causing panic among retail traders.
Another critical factor is Bitcoin dominance. If capital continues rotating toward Bitcoin while altcoins weaken, PYTH and similar infrastructure assets may struggle to recover quickly even if fundamentals remain strong.
Market Sentiment & Trading Strategies
Short-term traders are focusing primarily on volatility opportunities near resistance zones between $0.050 and $0.057 while targeting downside regions near $0.042, $0.038, and $0.035.
Bearish traders are searching for rejection confirmations while bullish participants are waiting for signs that supply absorption is stabilizing.
Long-term investors are approaching the situation more carefully. Many are waiting for post-unlock stabilization before opening larger accumulation positions. Their focus remains on staking growth, ecosystem adoption, on-chain activity, and whether demand can successfully absorb circulating expansion over time.
Institutional participants are expected to remain extremely active during this phase. Large funds often hedge unlock risks through derivatives while simultaneously preparing strategic accumulation during panic-driven weakness.
Final Outlook — A Defining Moment for PYTH
The PYTH 2.13 billion token unlock is not just another token release event. It is one of the biggest liquidity, confidence, and tokenomics tests facing the crypto market in 2026.
If demand successfully absorbs the new supply, PYTH could eventually transform this period into a powerful long-term accumulation zone. But if exchange inflows accelerate while liquidity remains weak, downside pressure could continue dominating price action for months.
The coming weeks will therefore become extremely important for determining PYTH’s future direction.
Traders and investors will closely monitor whale activity, staking participation, exchange reserves, derivatives positioning, ecosystem growth, trading volume, and broader crypto market momentum as the market attempts to absorb one of the largest oracle-sector unlock events in recent years.
repost-content-media
  • Reward
  • Comment
  • Repost
  • Share
#TrumpDelaysIranStrike
Trump Delays Iran Strike
President Donald Trump’s decision on May 19–20, 2026 to delay planned strikes on Iranian energy infrastructure for approximately five days has created a highly sensitive geopolitical pause in global markets. This delay came after diplomatic pressure from Gulf allies including Saudi Arabia, Qatar, and the United Arab Emirates, who warned about potential catastrophic spillover effects in global energy supply chains.
Markets are now operating inside a short-term “uncertainty window” where traders are reacting to every headline rather than fundamen
BTC-2.21%
HighAmbition
#TrumpDelaysIranStrike
Trump Delays Iran Strike
President Donald Trump’s decision on May 19–20, 2026 to delay planned strikes on Iranian energy infrastructure for approximately five days has created a highly sensitive geopolitical pause in global markets. This delay came after diplomatic pressure from Gulf allies including Saudi Arabia, Qatar, and the United Arab Emirates, who warned about potential catastrophic spillover effects in global energy supply chains.
Markets are now operating inside a short-term “uncertainty window” where traders are reacting to every headline rather than fundamentals. This has created a fragile environment across Bitcoin, altcoins, oil, and gold, with liquidity shifting rapidly between risk-on and risk-off positioning.
At the center of this reaction is one key reality:
Markets are not pricing certainty — they are pricing fear of escalation.
1. Bitcoin (BTC) & Crypto Market Reaction
Current Market Structure
BTC Price: ~$76,600
24h High: ~$77,408
24h Low: ~$76,138
Market Behavior: High volatility compression with downside pressure
Sentiment: Fear zone (~27 Fear & Greed Index)
Bitcoin is currently sitting at a technically fragile equilibrium zone where neither buyers nor sellers have full control. The $76K region is acting as a short-term battlefield between dip buyers and macro sellers.
Why BTC Fell From Higher Levels
Bitcoin’s drop from the $77K–$80K region is not caused by a single factor, but a combination of three major pressures:
2. Geopolitical Risk Shock
The initial threat of strikes on Iran triggered immediate risk-off behavior. In such environments:
Traders reduce leverage instantly
Funds move into cash or stable assets
High-beta assets like BTC face liquidity withdrawals
Even though the strike was delayed, the uncertainty remains.
3. ETF Outflows (Major Structural Pressure)
Recent ETF flow data shows strong institutional distribution:
Weekly ETF outflows: ~$981.5M
Total crypto ETP outflows: ~$1.07B
BlackRock: ~$487M outflow
Ark Invest: ~$323M
Fidelity: ~$305M
This is critical because ETF flows now act as the backbone of Bitcoin demand. When inflows reverse:
Spot demand weakens
Market depth reduces
Price becomes more sensitive to news shocks
4. Macro Pressure (Rates + Dollar Strength)
US 10Y Treasury yield: ~4.7% (multi-month high)
Strong USD index pressure
Reduced liquidity in risk assets
Higher yields make risk-free returns more attractive, pulling capital away from speculative markets.
Will BTC Fall Further From $76K?
Bearish Case (Downside Pressure Continuation)
If uncertainty escalates again:
BTC could retest: $74,000
If broken: $72,000 → $70,000 zone
Extreme fear scenario: $68,000 (liquidity flush)
Triggers for downside:
Renewed Iran escalation headlines
ETF outflows continuing
Oil spike causing inflation fear
Equity market weakness spilling into crypto
Bullish Case (Stabilization & Recovery)
If geopolitical pressure cools:
BTC stabilizes above $76K
Recovery target: $78,500 → $82,000
Breakout zone: $84,000
Recovery depends heavily on:
ETF inflows returning
Reduced geopolitical tension
Stable oil prices
Should BTC Be Bought at $76K?
Market is currently in a reaction phase, not a trend phase.
Accumulation Logic:
$74K–$76K = early accumulation zone
Stronger accumulation zone = $70K–$72K
Strategy Interpretation:
Short-term traders: wait for confirmation (do not rush)
Swing traders: partial entries near support only
Long-term investors: gradual accumulation strategy preferred
Key principle:
Liquidity + news volatility = avoid full-size entries
5. Oil Market Impact (Brent $112 / WTI $107)
Current Situation
Brent Crude: ~$108–112/bbl
WTI Crude: ~$103–107/bbl
Oil remains the most sensitive asset in this geopolitical cycle.
Why Oil Reacted Strongly
Before the delay:
Oil surged aggressively toward $111–$112
WTI pushed near $107–$108
Drivers:
Fear of Iranian energy infrastructure disruption
Risk of Strait of Hormuz instability
Supply shock expectations
After delay:
Oil pulled back slightly (~1–2%)
Traders reduced immediate war premium pricing
Can Oil Go Higher Again?
Yes — and aggressively.
Bullish Oil Scenario (Escalation Returns)
If strikes resume or tensions increase:
Brent: $115 → $120 → $125+
WTI: $110 → $115 → $118
Reasons:
Global spare capacity is limited
Shipping routes are highly vulnerable
Risk premium can re-enter instantly
Bearish Oil Scenario (Diplomatic Stability)
If diplomacy holds:
Brent: $95–$100 normalization zone
WTI: $90–$95 range
But downside is limited because:
Global inventories are already tight
Seasonal demand remains strong
Supply chain uncertainty persists
Key Oil Insight
Oil is not reacting to actual damage —
it is reacting to fear of supply interruption
So even without conflict escalation, volatility remains elevated.
6. Gold Market Impact
Current Price Behavior
Gold: ~$4,540 – $4,585/oz
Trend: Strong safe-haven consolidation
Structure: Near historic highs
Why Gold Remains Strong
Gold is benefiting from dual forces:
7. Geopolitical Uncertainty
Even delayed strikes keep uncertainty alive.
8. Inflation Hedge Flow
If oil rises again:
Inflation expectations rise
Gold demand increases further
Gold Scenarios
Bullish Case:
$4,650 → $4,750 → $4,900 possible extension
If full escalation returns: new record highs likely
Bearish Case:
Stabilization could pull gold back to $4,350–$4,300
Only if geopolitical tension fully disappears (low probability short-term)
9. Israel–Iran Risk Factor (Market Sensitivity)
Markets are closely watching whether additional military actions occur involving Israel and Iran.
If escalation happens:
Crypto Impact:
BTC drop: 5%–12% possible short-term
Altcoins: 10%–25% downside pressure
High leverage liquidations increase sharply
Oil Impact:
Immediate spike due to supply fear
$120+ Brent becomes realistic
Gold Impact:
Strong surge toward new highs
Safe-haven capital inflow increases
10. Macro Market Behavior (Why Everything Is Moving Together)
This cycle is not isolated — it is interconnected:
Geopolitics → Oil spike
Oil spike → Inflation fear
Inflation fear → Rate hike expectations
Rate fear → BTC & crypto pressure
Risk-off flow → ETF outflows
This chain reaction explains why markets are highly reactive even without actual conflict escalation.
11. BTC $76K — Buy or Wait?
Current Market Reality
Bitcoin is not in a clean trend — it is in a headline-driven liquidity zone.
Recommended Approach
Aggressive Traders:
Trade volatility only
Buy dips near $74K–$76K
Take profits quickly near resistance ($78K–$82K)
Conservative Traders:
Wait for clarity above $80K
Or wait deeper correction toward $72K
Long-Term Investors:
Gradual accumulation is reasonable
Avoid lump-sum entry in uncertain geopolitical phase
12. Final Outlook — Next 72 Hours Are Critical
The market is currently inside a geopolitical countdown phase:
Key Triggers Ahead:
Any Iran-related military confirmation
Oil movement above $115 Brent
ETF flow reversal signals
Bitcoin $74K support reaction
Final Market Summary
BTC: Weak but stable near $76K
Oil: Elevated with strong upside risk
Gold: Structurally strong safe haven
Crypto: Sensitive to ETF + geopolitical flow
Market Mood: Fear-driven uncertainty phase
Core Conclusion
Trump’s delay has not removed risk — it has only delayed it.
Markets are now pricing a scenario where:
escalation may still happen
oil shock risk remains active
Bitcoin remains liquidity-sensitive
gold remains structurally supported
The next move will be determined not by technicals alone, but by geopolitical confirmation or de-escalation signals.
repost-content-media
  • Reward
  • Comment
  • Repost
  • Share
#GateSquarePizzaDay
Bitcoin is currently trading at $76,780, and the timing couldn’t be more powerful.
We are once again celebrating the most legendary moment in crypto history — the day when 10,000 BTC bought just two pizzas… a transaction that unknowingly defined the future of digital money forever.
Today, that “pizza moment” is no longer just history — it’s a reminder of how far Bitcoin has come, from experimental code to a global financial asset shaping markets, narratives, and portfolios worldwide.
📊 Market Pulse (BTC)
Current Price: $76,780
Market Mood: Cautious but highly active
Struc
BTC-2.21%
HighAmbition
#GateSquarePizzaDay
Bitcoin is currently trading at $76,780, and the timing couldn’t be more powerful.
We are once again celebrating the most legendary moment in crypto history — the day when 10,000 BTC bought just two pizzas… a transaction that unknowingly defined the future of digital money forever.
Today, that “pizza moment” is no longer just history — it’s a reminder of how far Bitcoin has come, from experimental code to a global financial asset shaping markets, narratives, and portfolios worldwide.
📊 Market Pulse (BTC)
Current Price: $76,780
Market Mood: Cautious but highly active
Structure: Consolidation near high-value zone
Narrative: Long-term conviction vs short-term volatility
🍕 Gate Square Pizza Day Vibe
The community event on Gate.io is bringing back the spirit of Bitcoin Pizza Day through creativity, storytelling, and market reflection.
This is not just an event — it’s a reminder that:
Every trade has a story
Every cycle has a lesson
And every “cheap pizza moment” in history becomes a billion-dollar memory later
💭 Thought of the Day
“What feels expensive today… might look unbelievably cheap in the future.”
🚀 Final Take
Bitcoin at $76.7K + Pizza Day energy = a perfect moment to reflect, create, and engage.
Whether you’re a trader, builder, or believer — this is your chance to turn history into content and content into opportunity.
🍕 #GateSquarePizzaDay isn’t just an event… it’s a reminder of where it all started.
repost-content-media
  • Reward
  • Comment
  • Repost
  • Share
#PutinVisitsChina
Russian President Vladimir Putin’s visit to China on May 19–20, 2026 marks a major geopolitical milestone reflecting the ongoing transformation of global economic and political alignment. This visit follows shortly after high-level diplomatic engagement between the United States and China, indicating an active phase of strategic repositioning among the world’s largest economies.
The timing is highly significant as it coincides with the 25th anniversary of the Sino-Russian cooperation framework, reinforcing long-term coordination between Moscow and Beijing in energy, trade, i
BTC-2.21%
ETH-1.32%
XAUUSD0.02%
HighAmbition
#PutinVisitsChina
Russian President Vladimir Putin’s visit to China on May 19–20, 2026 marks a major geopolitical milestone reflecting the ongoing transformation of global economic and political alignment. This visit follows shortly after high-level diplomatic engagement between the United States and China, indicating an active phase of strategic repositioning among the world’s largest economies.
The timing is highly significant as it coincides with the 25th anniversary of the Sino-Russian cooperation framework, reinforcing long-term coordination between Moscow and Beijing in energy, trade, infrastructure, and financial settlement systems.
Global markets are responding with increased volatility, shifting liquidity conditions, and stronger sensitivity to geopolitical developments. The global system is transitioning into a more fragmented and multi-centered economic structure.
2. Global Power Structure Transition
The world economy is gradually moving away from a single-center dominance model toward a distributed power system.
Key developments include:
Expansion of Russia–China strategic cooperation in energy and trade
Strengthening of regional economic alliances across Eurasia
Growth of cross-border settlement mechanisms outside traditional systems
Increasing diversification of global trade routes and financial channels
China continues to position itself as a central economic hub, while Russia is increasingly integrated into Asian energy and commodity supply networks.
This shift is long-term and structural, not temporary or event-driven.
3. Energy Market Dynamics & Inflation Pressure
Energy remains the strongest macro driver of global inflation.
Oil Market Overview
Brent Crude: $104 – $112
WTI Crude: $101 – $108
High volatility expansion zone: $115 – $125
Extreme stress scenario: $130 – $150+
Ongoing geopolitical tension in key maritime shipping routes continues to elevate risk premiums in energy pricing. Supply chain uncertainties are creating structural inflation pressure across global economies.
Russia’s energy exports toward Asia continue expanding, reshaping global supply distribution and increasing price divergence between regions.
Higher energy costs are directly contributing to sustained global inflation, forcing central banks to maintain restrictive monetary policies.
4. Global Interest Rates & Liquidity Conditions
Global financial markets remain under pressure due to elevated interest rates and tighter liquidity.
US 10-Year Yield: ~4.5% – 5.2%
Global credit tightening continues
Reduced liquidity flow into high-risk assets
Increased preference for fixed-income instruments
Higher yields are reducing speculative capital flow and increasing volatility across equities, crypto, and emerging markets.
This liquidity environment remains one of the most important macro drivers in 2026.
5. Bitcoin Market Structure & Behavior
Bitcoin is currently trading within a wide consolidation range:
BTC Price Range: $76,800 – $82,000
Previous cycle high: ~$126,000
Key support zone: $75,000 – $72,000
Resistance zone: $85,000 – $92,000
Market Structure Analysis
Bitcoin is increasingly behaving as a macro liquidity-sensitive asset rather than an independent hedge. Its correlation with global risk markets has strengthened significantly.
Extended Scenario Outlook
Bullish continuation zone: $92,000 – $110,000
Strong expansion cycle: $120,000 – $135,000
Macro correction zone: $70,000 – $72,000
Deep liquidity stress scenario: $62,000 – $68,000
Institutional participation remains active, but market momentum is heavily influenced by liquidity conditions and global risk sentiment.
6. Ethereum Market Outlook
Ethereum is currently trading in the range:
ETH Price: $2,050 – $2,150
Key Market Drivers
Competition with risk-free yield instruments
Slower growth in decentralized finance liquidity
Reduced staking yield attractiveness relative to government bonds
Capital rotation toward lower-risk instruments
Ethereum Price Scenarios
Recovery range: $2,400 – $2,800
Strong bullish breakout: $3,200 – $3,800
Extended bullish cycle: $4,200 – $4,800
Downside pressure zone: $1,800 – $2,000
Deep correction scenario: $1,500 – $1,700
Ethereum remains structurally strong but is sensitive to global liquidity cycles.
7. Gold Market Strength & Safe Haven Demand
Gold continues to be the primary safe-haven asset in the current macro environment.
Gold Price: $4,450 – $4,600
Previous peak levels: near $5,000
Forward Projection Scenarios
Base bullish range: $4,800 – $5,200
Strong geopolitical stress: $5,400 – $5,800
Extreme liquidity crisis scenario: $6,000+
Central bank demand remains a key structural support factor for gold.
8. Oil Market Structural Sensitivity
Oil remains the most geopolitically sensitive asset class.
Price Scenarios
Stable elevated range: $100 – $115
Expansion zone: $120 – $135
High stress environment: $140 – $160
Extreme disruption scenario: $170 – $200
Energy remains the primary transmission mechanism for global inflation trends.
9. Crypto Market Macro Conditions
The crypto ecosystem is operating under tight macro conditions:
Higher interest rates reduce speculative liquidity
Venture capital inflows are slowing
Faster deleveraging during volatility events
Increased correlation with equity markets
Stablecoin System Dynamics
Treasury-linked yield models increasing issuer profitability
Slower retail liquidity expansion
More controlled capital rotation within crypto markets
10. DeFi Ecosystem Pressure
Decentralized finance is facing structural competition from traditional yield instruments:
Reduced attractiveness of high-risk yield strategies
Slower total value locked (TVL) expansion
Capital shifting toward lower-risk financial instruments
Despite this, core DeFi infrastructure remains active and evolving.
11. Market Correlation Evolution
A key structural change in 2026 is the rising correlation between asset classes:
Bitcoin increasingly follows equity market trends
Crypto assets respond strongly to liquidity cycles
Digital assets behave as high-volatility macro instruments
This reduces diversification benefits but increases macro trading opportunities.
12. Long-Term Financial System Evolution
The ongoing geopolitical transition may lead to:
Expansion of regional payment systems
Increased cross-border settlement diversification
Greater use of alternative financial infrastructure
Gradual reshaping of global trade settlement networks
Digital assets may play a growing role in experimental settlement systems, although adoption remains gradual and controlled.
At the same time, regulatory frameworks are becoming more structured globally.
13. Final Macro Conclusion
The Putin–China diplomatic engagement represents part of a broader global transformation rather than an isolated event.
Key Market Summary
Energy markets remain inflation-driven and volatile
Liquidity conditions remain tight due to high interest rates
Gold remains the strongest safe-haven asset
Bitcoin and Ethereum remain macro-sensitive instruments
Crypto markets are highly dependent on global liquidity cycles
Global financial system is moving toward multi-regional structure
Overall Market Environment
Markets are currently in a transition phase where geopolitical developments and macroeconomic conditions dominate price direction across all major asset classes.
repost-content-media
  • Reward
  • 1
  • Repost
  • Share
Yusfirah:
To The Moon 🌕
#30YearTreasuryYieldBreaks5%
The 30-year US Treasury yield holding above the 5% level marks a major macro regime shift that is reshaping global capital allocation. With Bitcoin trading around $76,800 and Ethereum near $2,108, crypto markets are now operating under tighter liquidity conditions, stronger competition from risk-free yields, and a more defensive institutional stance. This is not just a short-term fluctuation—it is a structural repricing of risk across all asset classes.
1. Macro Shift: Risk-Free Yield Becomes a Strong Competitor
When the 30-year Treasury yield sustains above 5%, i
BTC-2.21%
ETH-1.32%
HighAmbition
#30YearTreasuryYieldBreaks5%
The 30-year US Treasury yield holding above the 5% level marks a major macro regime shift that is reshaping global capital allocation. With Bitcoin trading around $76,800 and Ethereum near $2,108, crypto markets are now operating under tighter liquidity conditions, stronger competition from risk-free yields, and a more defensive institutional stance. This is not just a short-term fluctuation—it is a structural repricing of risk across all asset classes.
1. Macro Shift: Risk-Free Yield Becomes a Strong Competitor
When the 30-year Treasury yield sustains above 5%, it fundamentally alters global capital preferences. Investors are now presented with a rare opportunity: a guaranteed ~5% annual return backed by the US government, something that has not been available in decades.
During the ultra-low interest rate era, capital had almost no choice but to move into risk assets like Bitcoin, Ethereum, equities, and venture capital. Now the situation is reversed—capital has a strong, safe alternative again.
For institutional allocators such as pension funds, insurance companies, and sovereign wealth funds, this shift is critical. The decision is no longer “cash vs risk assets,” but “safe 5% yield vs volatile growth assets.”
2. Opportunity Cost Pressure on Crypto Assets
The opportunity cost of holding crypto rises sharply in this environment.
Bitcoin at $76,800 offers no yield
Ethereum at $2,108 offers staking yield, but still volatile and risk-exposed
Treasury bonds offer ~5% guaranteed return
This creates a direct mathematical disadvantage for crypto in traditional portfolio models.
As a result:
Institutional BTC ETF inflows slow down
Profit-taking increases during rallies
Risk exposure is actively reduced across hedge funds
This does not mean capital exits crypto completely, but it becomes selectively deployed rather than aggressively allocated.
3. Bitcoin Price Behavior Under High-Yield Regime
Bitcoin increasingly behaves like a macro-sensitive risk asset, not an independent hedge instrument.
Current Market Context:
BTC: $76,800
Key psychological range under pressure: $75,000–$80,000
Key Impacts:
Strong resistance to upside expansion
Increased sensitivity to bond yield spikes
Faster corrections during liquidity contractions
Bitcoin’s “digital gold” narrative weakens temporarily when 5% risk-free yield competes directly with long-term store-of-value positioning.
However, Bitcoin still maintains long-term structural demand due to:
Fixed supply
Institutional adoption via ETFs
Sovereign debt concerns
4. Ethereum Under Dual Pressure: Yield Competition + Risk Appetite
Ethereum faces a more complex situation than Bitcoin.
Current ETH Price:
ETH: $2,108
Structural Challenge:
Ethereum staking yields (historically ~3–5%) now compete directly with Treasury yields.
This creates a compressed yield premium scenario where:
Treasuries = safe 5%+
ETH staking = similar yield but with volatility risk
Result:
Reduced attractiveness of staking for conservative capital
Lower DeFi participation
Slower liquidity inflows into ETH-based ecosystems
Ethereum remains fundamentally strong, but capital efficiency advantage temporarily weakens.
5. DeFi Ecosystem Liquidity Compression
Decentralized Finance (DeFi) is one of the most affected sectors.
When risk-free yields rise:
Stablecoin deposits shift toward Treasuries
Borrowing demand decreases
Yield spreads compress
Consequences:
Lower TVL (Total Value Locked)
Higher borrowing costs in lending protocols
Increased liquidation cascades during volatility spikes
DeFi thrives in low-rate environments—5% Treasury yields reverse that advantage.
6. Stablecoin System Stress and Capital Migration
Stablecoins such as USDT and USDC are indirectly impacted because reserves are heavily invested in Treasuries.
Key Dynamic:
Issuers earn high yield from reserves
Users earn zero yield on holdings
This creates a hidden arbitrage pressure:
Capital prefers direct Treasury exposure
Stablecoin circulation growth slows
Result:
Reduced stablecoin liquidity expansion
Lower on-chain trading depth during risk-off periods
7. Leverage Reduction and Market Fragility
Higher Treasury yields increase global borrowing costs, which directly impacts crypto leverage markets.
Effects include:
Higher futures funding rates
Reduced margin appetite
Forced deleveraging events
This leads to:
Faster downside moves
Shorter but sharper volatility cycles
Reduced speculative excess
Leverage contraction is one of the strongest short-term bearish forces in crypto.
8. Correlation Increase Across Risk Assets
A key structural change is rising correlation between:
Crypto
Equities
Tech stocks
When yields rise:
All risk assets move in the same direction
Diversification benefits weaken
Macro becomes dominant driver
This reduces Bitcoin’s independence as a portfolio hedge.
9. Venture Capital and Crypto Innovation Slowdown
High risk-free yields increase discount rates, which reduces startup valuations.
Impact:
Lower crypto VC funding
Reduced token launch valuations
Slower ecosystem expansion
Capital prefers:
Guaranteed 5% returns instead of:
High-risk long-duration crypto startups
This shifts the industry from expansion phase to capital efficiency phase.
10. Dollar Strength and Global Liquidity Drain
Rising yields strengthen the US dollar, which creates:
Capital inflows into USD assets
Pressure on emerging markets
Reduced global crypto purchasing power
Since crypto is globally traded in USD terms, this acts as an additional headwind.
11. Historical Context and Market Cycles
In previous cycles:
2020–2021: near-zero yields → crypto bull run
2022: rising yields → deep crypto bear market
Current conditions resemble a late tightening phase, where liquidity is constrained and speculative appetite weakens.
12. Forward Outlook: Key Scenarios
Bearish Scenario:
Yield moves toward 5.3%+
BTC breaks below $75,000
ETH moves toward $1,900–$2,000 range
Neutral Scenario:
Yields stabilize 4.9%–5.1%
Crypto trades in consolidation range
Low volatility accumulation phase
Bullish Relief Scenario:
Yield retreats below 5%
Liquidity returns gradually
BTC reclaims $80K–$85K zone
ETH recovers toward $2,300+
Final Conclusion
The 30-year Treasury yield above 5% is a structural macro headwind for crypto markets. It does not break the long-term thesis of Bitcoin or Ethereum, but it significantly changes short-to-mid term capital flows.
With BTC at $76,800 and ETH at $2,108, the market is currently in a defensive macro phase, where capital prioritizes safety over speculation.
Crypto is no longer operating in isolation—it is now deeply integrated into global macro liquidity cycles. The next major move will depend less on internal crypto catalysts and more on whether Treasury yields continue rising or begin to stabilize.
repost-content-media
  • Reward
  • 1
  • Repost
  • Share
Yusfirah:
To The Moon 🌕
#GtTokenAnalysis.
Current GT Price: ~$7.01
Market Cap: ~$746.52 Million
Market Rank: #66 Global Crypto Asset
GateToken (GT) has evolved from a simple exchange utility token into a major ecosystem asset supporting one of the world’s leading crypto trading platforms, gate.com. Over the years, GT has expanded into a utility-driven and ecosystem-focused digital asset that combines exchange benefits, blockchain infrastructure utility, VIP privileges, launch participation access, staking opportunities, and long-term supply reduction mechanisms.
Today, GT represents not only the growth of Gate.com i
GT-0.15%
HighAmbition
#GtTokenAnalysis.
Current GT Price: ~$7.01
Market Cap: ~$746.52 Million
Market Rank: #66 Global Crypto Asset
GateToken (GT) has evolved from a simple exchange utility token into a major ecosystem asset supporting one of the world’s leading crypto trading platforms, gate.com. Over the years, GT has expanded into a utility-driven and ecosystem-focused digital asset that combines exchange benefits, blockchain infrastructure utility, VIP privileges, launch participation access, staking opportunities, and long-term supply reduction mechanisms.
Today, GT represents not only the growth of Gate.com itself but also the expansion of the broader Gate ecosystem, including GateChain infrastructure, Web3 integrations, launch platforms, on-chain applications, and user reward systems.
🌍 1. What is GateToken (GT)?
GateToken (GT) is the native ecosystem token of Gate.com.
GT supports: • Exchange fee discounts
• VIP tier upgrades
• Launchpad participation
• HODLer rewards
• GateChain gas utility
• Web3 ecosystem integration
• DeFi and staking utilities
GT operates with a long-term ecosystem expansion and supply reduction model designed to strengthen utility across the platform.
📊 2. Current GT Market Snapshot
💰 Current Price: ~$7.01
📈 24-Hour Performance: ~ -0.2%
🏦 Market Capitalization: ~$746.52 Million
🌐 Global Ranking: #66 crypto asset globally
📉 Historical Performance: • Growth from ATL: +1,530%
• Annual growth: +227%
This growth reflects how GT has expanded alongside the development of the Gate ecosystem.
🔥 3. GT Tokenomics — Why GT Is Different
GT uses a strong supply reduction structure.
🟢 Total GT Burned: 187.37 Million GT
This represents: ~60.7% of original supply permanently removed.
🟢 Current Circulating Supply: 106.47 Million GT
This represents: ~34.49% of total historical supply.
🔥 Quarterly Burn Example: Q1 2025 Burn: 1.54 Million GT
Estimated value: ~$33.84 Million
These burns permanently reduce supply over time
⚙️ 4. Core GT Utility Inside Gate Ecosystem
GT is integrated across multiple services inside the Gate ecosystem.
💸 Trading Fee Discounts Users can receive: • Up to 20% fee discounts
• Lower futures and spot trading costs
• Additional VIP reductions
👑 VIP Tier Acceleration GT holdings help users access higher VIP levels with: • Lower fees
• Better liquidity access
• Premium account benefits
• Faster withdrawal limits
🚀 Launchpool Benefits GT holders can: • Stake GT
• Earn new project rewards
• Redeem principal flexibly
• Access ecosystem opportunities
🎁 HODLer Airdrop Program Users holding as little as: • 1 GT
can receive: • Free token airdrops
• Reward distributions
• Promotional ecosystem benefits
Total distributed: • Over 33.2 Million GT-equivalent rewards
🌟 Launchpad Access GT holders receive access to: • Early-stage token sales
• New crypto projects
• Priority participation opportunities
🍬 CandyDrop Rewards Users can complete: • Trading tasks
• Platform activities
• Social engagement
to receive additional ecosystem rewards.
🛠️ 5. GateChain Integration
GT is also the utility token of GateChain.
GT supports: • Transaction fees
• Smart contract operations
• On-chain ecosystem functions
• Validator participation
This gives GT blockchain infrastructure utility beyond exchange services.
🔗 6. Ecosystem Expansion
GT utility continues expanding across multiple services and integrations including: • Web3 applications
• Payment integrations
• Blockchain ecosystems
• Digital asset platforms
This strengthens GT utility outside traditional exchange usage.
📈 7. Staking & Passive Participation
GT holders can participate in: • Staking opportunities
• Ecosystem reward systems
• GateChain validator participation
Approximate participation rewards: ~1%+ depending on structure.
🧠 8. Why GT Value Has Increased Over Time
Several long-term factors support GT growth:
🔥 Continuous Supply Reduction Quarterly burns continue reducing available supply.
🌍 Ecosystem Expansion Gate continues expanding: • Exchange services
• Web3 integrations
• Blockchain infrastructure
• DeFi functionality
• Global ecosystem development
📊 User Growth As user activity grows: • More utility demand appears
• More Launchpool participation occurs
• More GT ecosystem usage develops
🚀 Platform Innovation Gate continues introducing: • New products
• AI tools
• On-chain integrations
• Ecosystem campaigns
• Reward systems
🟢 9. What Gate.com Is Doing to Support GT Ecosystem Growth
🔥 A. Quarterly Supply Reduction Regular GT burns continue reducing supply over time.
🚀 B. Expanding GT Utility Gate continuously adds: • New GT use cases
• Additional ecosystem integrations
• More staking systems
• Participation features
🌐 C. GateChain Development GT powers key GateChain ecosystem functions and network activity.
💰 D. Reward Programs Programs including: • HODLer Airdrop
• Launchpool
• CandyDrop
• VIP ecosystem benefits
encourage long-term ecosystem participation.
📈 E. User Ecosystem Benefits GT acts as an ecosystem participation asset where increased engagement unlocks additional platform advantages.
📊 10. GT Price Outlook & Future Potential
Current Price: ~$7.01
Important resistance levels: • $7.50
• $8.20
• $10 psychological zone
Major support levels: • $6.50
• $6.00
• $5.40
📈 Long-Term Growth Factors: • Ecosystem expansion
• User growth
• Continued burns
• Market conditions
• Broader crypto adoption
🧠 11. GT Market Interpretation
GT currently functions as: • A utility token
• An ecosystem participation token
• A blockchain infrastructure token
• A loyalty-focused ecosystem asset
Its multi-layer utility structure makes GT one of the more ecosystem-integrated exchange-related digital assets in the broader crypto market.
🎯 12. Final Conclusion
GateToken (GT) combines: • Supply reduction mechanisms
• Exchange utility
• Blockchain infrastructure functionality
• Reward systems
• Passive participation opportunities
• VIP ecosystem benefits
With more than 60% of total supply already removed from circulation, expanding ecosystem integration, growing utility demand, and continuous platform innovation from Gate.com, GT continues developing as a long-term ecosystem-focused digital asset connected directly to the growth of the broader Gate ecosystem.
repost-content-media
  • Reward
  • Comment
  • Repost
  • Share
#TradfiTradingChallenge
#BTC
Current BTC Price is trading near $77,555.70 after Bitcoin entered a major consolidation phase of the 2026 cycle following the strong rally toward the $82,000 region, where institutional inflows, ETF demand, macro liquidity expansion, and improving regulatory sentiment pushed the market into temporary overextension before a controlled pullback began shaping the current structure.
Recent geopolitical tensions in the Middle East, including renewed escalation concerns between Israel and regional adversaries and the possibility of further military strikes in the comin
BTC-2.08%
HighAmbition
#TradfiTradingChallenge
#BTC
Current BTC Price is trading near $77,555.70 after Bitcoin entered a major consolidation phase of the 2026 cycle following the strong rally toward the $82,000 region, where institutional inflows, ETF demand, macro liquidity expansion, and improving regulatory sentiment pushed the market into temporary overextension before a controlled pullback began shaping the current structure.
Recent geopolitical tensions in the Middle East, including renewed escalation concerns between Israel and regional adversaries and the possibility of further military strikes in the coming days, have added an additional layer of uncertainty across global risk assets, and Bitcoin—like other high-risk instruments—has been reacting to this uncertainty through short-term volatility and liquidity-driven swings rather than any fundamental breakdown in long-term demand.
At the same time, Bitcoin’s recent downside movement is not being driven by a single event, but rather by a combination of profit-taking from the $81K–$82K region, liquidation of leveraged long positions, strengthening macro caution, and temporary risk-off sentiment across global markets where investors are reducing exposure to volatile assets until geopolitical clarity improves.
📊 1. Current Market Snapshot & Price Action
Bitcoin is currently priced around $77,555.70 after reaching an intraday high near $77,659.90 and a low near $76,138.60, showing that despite short-term volatility, the market is still holding above critical support zones while buyers continue defending the mid-$70K region with consistent liquidity absorption.
Over the past week, Bitcoin moved from approximately $81,089 on May 14 down toward $79,113 on May 15, then further cooling toward $78,146 on May 16 and around $77,458 on May 17, followed by stabilization near $77,003 on May 18 and $76,832 on May 19 before recovering again toward the current $77,555 level, which reflects a structured retracement rather than panic-driven collapse.
This movement from $82,000 highs toward the $76,000–$77,000 range is being interpreted as a healthy reset phase inside a broader bullish cycle, where leverage is being removed and the market is preparing for its next directional expansion.
📈 2. Technical & Structural Analysis
Bitcoin’s technical behavior shows short-term weakness but medium-term structural strength remains intact, as moving averages are being tested while institutional positioning continues to support the broader trend.
🔹 RSI Structure
RSI currently sits near 44.53 after previously reaching almost 59.98 during the rally phase, showing that momentum has cooled from overbought conditions into a neutral zone where neither bulls nor bears have full control, and the market is temporarily balancing before a new directional move develops.
🔹 MACD Structure
MACD remains negative at around -702.21 with a signal gap near -421.01, showing that bearish momentum is still present, but the narrowing gap indicates weakening downside pressure and possible stabilization if buying demand increases near support zones.
🔹 Moving Averages
Bitcoin is currently trading slightly below the 30-day average near $78,670 and also below the 200-day average near $81,298, which confirms short-term weakness, but price proximity to these levels suggests that any breakout above $79K–$81K could quickly restore bullish momentum.
⚖️ 3. Liquidity & Market Structure
Bitcoin remains trapped between two major liquidity zones, creating a compression structure where volatility can expand sharply once a breakout occurs.
Upper liquidity cluster sits around $80,634–$81,654 where billions in short positions are concentrated, meaning that a breakout above this zone could trigger forced liquidations and accelerate price toward higher resistance levels.
Lower liquidity cluster sits around $73,578–$74,607 where long positions are heavily concentrated, meaning that a breakdown below this zone could trigger liquidation-driven downside volatility before larger buyers step in.
This compression between $74K and $81K is creating a coiled market structure waiting for a catalyst, whether macroeconomic, geopolitical, or liquidity-driven.
🏦 4. Institutional Flow & Whale Behavior
Institutional accumulation continues to act as a stabilizing force in the market.
Large financial entities such as Morgan Stanley have expanded exposure by adding over 321 BTC valued near $25.8 million, bringing total holdings above 3,314 BTC worth approximately $266 million, showing continued confidence in Bitcoin as a long-term macro asset.
Similarly, Capital B in France has increased holdings by adding around 192 BTC near the $78,948 level, reinforcing the trend of corporate treasury accumulation even during periods of volatility.
At the same time, whale activity shows selective profit-taking, such as a large holder transferring around 500 BTC to exchanges after accumulating near $67,646, locking in roughly $8.42 million in gains, which reflects strategic distribution rather than panic selling behavior.
📉 5. Why Bitcoin is moving lower right now
The current pullback from $82K toward $77K is primarily driven by three combined forces rather than a single trigger.
First, profit-taking pressure emerged after Bitcoin entered the $81K–$82K resistance zone where many traders locked in gains.
Second, leveraged long positions were liquidated as price volatility increased, especially around support retests near $76K–$77K.
Third, geopolitical uncertainty—especially rising tensions and renewed concerns about potential Israeli military action and broader regional escalation risks—has increased risk aversion across global markets, pushing investors temporarily toward safer assets and reducing exposure to volatile instruments like Bitcoin.
This combination has created short-term downward pressure, but importantly, it has not broken the broader accumulation structure.
📊 6. Funding & Sentiment Conditions
Funding rates remain extremely low, generally below 0.001%, which shows that excessive leverage has been flushed out of the system after the rally toward $82K.
This is typically a constructive condition because it reduces liquidation risk and allows the market to rebuild momentum in a more stable environment.
📌 7. Key Levels to Watch
Resistance zones remain at $78,500, $79,500, $80,600, and $81,300, and a breakout above these levels could rapidly accelerate momentum back toward the upper-$80K region if short liquidation pressure intensifies.
Support zones remain at $76,000, $74,600, and $73,500, and holding above these levels is critical to maintaining the current bullish cycle structure.
🧠 8. Market Psychology
The market is currently in a mid-cycle consolidation phase where volatility is being driven more by liquidity positioning and macro headlines than by structural breakdown.
Retail sentiment has cooled, while institutional accumulation continues, creating a quiet accumulation environment beneath visible price fluctuations.
Historically, this type of structure appears before major continuation moves in strong bullish cycles, especially when leverage resets and liquidity compresses tightly between defined zones.
🎯 9. Final Outlook
Bitcoin near $77,555 remains in a sensitive equilibrium zone where geopolitical uncertainty, liquidity compression, institutional accumulation, and technical consolidation are all interacting simultaneously.
The recent downside movement is being driven more by short-term risk reduction, geopolitical tension concerns, and profit-taking from higher levels rather than any structural weakness in long-term demand.
If Bitcoin stabilizes above $74K–$76K and reclaims $80K–$81K resistance, the next major expansion phase toward new highs could resume as liquidity conditions improve and market confidence returns across global risk assets.
repost-content-media
  • Reward
  • Comment
  • Repost
  • Share
#CLARITYActPassesSenateCommittee
Bitcoin Market Analysis and CLARITY Act Senate Committee Passage
Introduction: Regulatory Breakthrough Meets Market Consolidation
Bitcoin and the broader digital asset market are currently navigating a critical intersection of macroeconomic pressure, technical consolidation, and major regulatory development. The most significant recent catalyst is the advancement of the CLARITY Act (Digital Asset Market Clarity Act) through the U.S. Senate Banking Committee, where it passed with a bipartisan 15–9 vote on May 14, 2026.
At the same time, Bitcoin is trading in a
HighAmbition
#CLARITYActPassesSenateCommittee
Bitcoin Market Analysis and CLARITY Act Senate Committee Passage
Introduction: Regulatory Breakthrough Meets Market Consolidation
Bitcoin and the broader digital asset market are currently navigating a critical intersection of macroeconomic pressure, technical consolidation, and major regulatory development. The most significant recent catalyst is the advancement of the CLARITY Act (Digital Asset Market Clarity Act) through the U.S. Senate Banking Committee, where it passed with a bipartisan 15–9 vote on May 14, 2026.
At the same time, Bitcoin is trading in a tight consolidation range between approximately $79,000 and $81,000, after multiple attempts to break above resistance near $82,000 and repeated defenses of support around $78,000. This combination of regulatory progress and price compression has created a decisive environment for the next major move in the market cycle.
CLARITY Act: What the Senate Committee Passage Means
The CLARITY Act represents one of the most important legislative efforts in U.S. crypto history. Its core objective is to eliminate long-standing regulatory uncertainty by clearly defining how digital assets are classified and supervised.
The Senate Banking Committee’s approval does not make it law yet, but it is a major procedural milestone that signals strong bipartisan willingness to structure the crypto market rather than restrict it outright.
The bill now moves toward full Senate debate, potential amendments, and eventual reconciliation with the House version before reaching the President’s desk.
Core Purpose: Establishing Regulatory Clarity
The primary goal of the CLARITY Act is to resolve the long-standing jurisdictional conflict between two major regulators:
The Securities and Exchange Commission (SEC)
The Commodity Futures Trading Commission (CFTC)
For years, crypto projects have operated under uncertainty regarding whether tokens should be treated as securities or commodities. The CLARITY Act introduces clearer definitions:
Digital commodities (like Bitcoin and sufficiently decentralized assets) fall under CFTC oversight
Investment-contract tokens remain under SEC regulation
This distinction is critical because it removes overlapping enforcement pressure that has historically created legal risk for exchanges, developers, and institutional participants.
Structural Framework of the Bill
The legislation introduces a full market structure for digital assets, covering exchanges, brokers, and token issuers.
Key components include:
Mandatory registration standards for crypto trading platforms
Anti-money laundering (AML) compliance and reporting obligations
Consumer protection rules for retail participants
Defined pathways for token decentralization classification changes
Safe harbor protections for decentralized finance (DeFi) developers who do not control user funds
Stablecoin regulation with restrictions on yield-like rewards tied to passive holding
The stablecoin framework is particularly important because it attempts to balance innovation with financial stability concerns raised by traditional banking institutions.
Market Reaction: Immediate but Controlled Volatility
The immediate market response to the committee vote was cautiously positive but not euphoric. This reflects a key theme: markets are treating this as a long-term structural development rather than an immediate price catalyst.
Following the announcement:
Bitcoin briefly moved toward $82,000
Later retraced back into the $79,000–$81,000 range
Short liquidations exceeding $250 million were reported in leveraged positions
Despite this, Bitcoin did not enter a sustained breakout phase. Instead, price behavior suggests a “buy-the-rumor, moderate-the-news” structure combined with macroeconomic hesitation.
Bitcoin Price Structure: Key Levels and Behavior
Bitcoin remains locked in a defined technical corridor:
Support Zone: $78,000
Resistance Zone: $82,000
Current Trading Range: $79,000–$81,000
Repeated rejection at the upper boundary suggests sellers are active near resistance, while consistent defense of the lower boundary indicates ongoing accumulation interest.
This compression phase is often associated with volatility expansion events, where price eventually breaks sharply in one direction after liquidity builds on both sides.
Broader Market Drivers Beyond Regulation
While the CLARITY Act is a major narrative, Bitcoin’s price action is also shaped by multiple external factors:
ETF inflows and outflows affecting spot demand
Whale accumulation and distribution patterns
Futures market leverage and liquidation cascades
U.S. Federal Reserve interest rate expectations
Inflation data and macroeconomic sentiment
Equity market correlation and risk appetite cycles
These combined forces mean that regulatory optimism alone is not sufficient to trigger a breakout without supportive liquidity conditions
Institutional Impact: Why the Bill Matters Long-Term
One of the most important implications of the CLARITY Act is institutional participation.
If passed into law, it could significantly reduce legal uncertainty for:
Banks
Hedge funds
Pension funds
Asset managers
This would potentially unlock large-scale capital inflows into Bitcoin and other compliant digital assets.
Institutions generally require clear regulatory frameworks before deploying significant capital. The removal of ambiguity around SEC vs CFTC jurisdiction is therefore a major structural shift.
Market Sentiment: Cautious Optimism
Sentiment across the crypto market remains balanced between optimism and caution.
Bullish expectations are driven by:
Regulatory clarity improving legitimacy
Continued ETF demand
Strong on-chain accumulation signals
Long-term supply constraints of Bitcoin
However, caution remains due to:
Macro uncertainty
High leverage in derivatives markets
Possibility of delayed legislative progress
Resistance rejection near $82,000
Market participants are increasingly focused on confirmation rather than speculation.
Bullish Scenario: Potential Expansion Phase
If the CLARITY Act continues advancing through the full Senate with strong bipartisan support, the market could enter a new expansion phase.
In a bullish scenario:
Breakout above $82,000 could trigger momentum continuation
Bitcoin may target $85,000 initially
Extended upside could reach $88,000–$90,000
In strong macro conditions, longer-term projections extend beyond $100,000
This scenario depends heavily on sustained ETF inflows and supportive global liquidity conditions.
Bearish Scenario: Structural Risks Remain
Despite positive legislative progress, downside risks still exist independently of the bill:
Failure to pass full Senate vote due to amendments or political resistance
Macro tightening or delayed interest rate cuts
Equity market corrections triggering risk-off behavior
ETF outflows reducing spot demand
Breakdown of key support near $78,000
In a deeper correction scenario, Bitcoin could revisit:
$75,000 support
Psychological zone near $70,000 in extreme cases
However, many analysts view such pullbacks as cyclical rather than structural breakdowns.
Trading Environment: Strategy Considerations
Current market conditions favor range-based strategies until a confirmed breakout occurs.
Key strategic approaches include:
Accumulation near support zones during dips
Profit-taking near resistance levels
Strict risk management due to leveraged volatility
Avoiding overexposure during consolidation phases
Waiting for volume-confirmed breakout above $82,000
A decisive move outside the current range is likely to define the next major trend phase.
Long-Term Outlook: Structural Market Evolution
The CLARITY Act’s advancement signals a broader transformation of the crypto industry from an uncertain frontier market into a regulated financial asset class.
Over time, this may lead to:
Reduced volatility due to institutional participation
Higher liquidity across exchanges
Stronger integration with traditional financial systems
Increased legitimacy of Bitcoin as a macro asset
This transition mirrors earlier phases in commodities and equity markets where regulatory clarity preceded large-scale adoption.
Conclusion: A Critical Inflection Point
The combination of Bitcoin’s consolidation near $80,000 and the CLARITY Act’s advancement through the Senate Banking Committee represents a significant inflection point for the digital asset market.
In the short term, price action remains range-bound and sensitive to macroeconomic and liquidity conditions. In the long term, regulatory clarity has the potential to reshape the structure of the entire crypto ecosystem by enabling institutional participation at a much larger scale.
The market is now positioned in a compression phase where both regulatory progress and technical structure are building toward a potential expansion. The next decisive move—above resistance or below support—will likely define the next major trend cycle for Bitcoin.
repost-content-media
  • Reward
  • Comment
  • Repost
  • Share
#BitcoinVShapedReversalBack
Bitcoin V-Shaped Reversal Back
Bitcoin is currently in one of the most important recovery structures of this cycle, where price action is showing a potential V-shaped reversal formation after a deep macro correction from the cycle high of approximately $126,000 (Oct 2025) down to a major accumulation low near $60,000 (early 2026).
As of mid-May 2026, Bitcoin trades around $82,000–$84,000, showing strong recovery momentum and re-entry into major liquidity zones.
This structure is important because V-shaped reversals often represent:
Emotional capitulation bottoming
BTC-2.21%
HighAmbition
#BitcoinVShapedReversalBack
Bitcoin V-Shaped Reversal Back
Bitcoin is currently in one of the most important recovery structures of this cycle, where price action is showing a potential V-shaped reversal formation after a deep macro correction from the cycle high of approximately $126,000 (Oct 2025) down to a major accumulation low near $60,000 (early 2026).
As of mid-May 2026, Bitcoin trades around $82,000–$84,000, showing strong recovery momentum and re-entry into major liquidity zones.
This structure is important because V-shaped reversals often represent:
Emotional capitulation bottoming phases
Liquidity re-accumulation zones
Fast trend reversal environments
Institutional re-entry phases
2. What is a V-Shaped Reversal? (Step-by-Step Breakdown)
A V-shaped reversal is a sharp market structure where price falls aggressively and then rebounds equally fast, forming a “V” shape.
Step 1: Sharp Decline Phase
Bitcoin drops from highs near $126,000 → $100,000 → $75,000 → $60,000
Panic selling increases
Liquidity gets cleared below major support zones
Stop-loss cascades trigger accelerated downside
Step 2: Capitulation Bottom Formation
Price stabilizes near $58,000–$62,000
Volatility spikes but downside slows
Buyers begin absorbing supply aggressively
Whale accumulation begins
Step 3: Sharp Recovery Phase
Price rebounds from $60,000 → $70,000 → $80,000 → $83,000
Volume increases on upside candles
Market sentiment shifts from fear → neutral → optimism
Short sellers begin to exit positions
Step 4: Continuation or Failure Zone
Either continuation to $92K–$100K+
Or rejection leading to retest of $70K–$65K
3. Current Bitcoin Market Structure (May 2026)
Bitcoin is currently positioned in a mid-recovery zone after strong rebound.
Key Price Levels:
Major cycle high: $126,000
Breakdown zone: $100,000
Macro support: $75,000
Deep accumulation low: $60,000
Current trading range: $82,000–$84,000
Liquidity Zones:
Upper liquidity: $88,000 → $92,000 → $100,000
Lower liquidity: $78,000 → $70,000 → $65,000
4. Technical Structure Confirmation Factors
1. Trend Reclaim Structure
Bitcoin has reclaimed:
Short-term moving averages
Broken resistance zones near $78K–$80K
Mid-range liquidity bands
2. Volume Expansion Pattern
Volume increased during recovery from $60K
Lower volume during pullbacks indicates absorption
Institutional participation gradually increasing
3. Market Structure Shift
Lower highs broken upward
Higher lows forming from $60K base
Transition from bearish → neutral → bullish structure
5. Fibonacci & Price Expansion Zones
Based on full-cycle movement:
0.236 retracement: ~$70,000
0.382 retracement: ~$78,000
0.5 retracement: ~$83,000 (current zone)
0.618 retracement: ~$92,000
0.786 retracement: ~$105,000
Full extension: $120,000–$135,000
6. Institutional Flow Analysis
ETF & Institutional Behavior:
ETF inflows are stabilizing after volatility phases
Mixed positioning from large funds
Accumulation during dips near $70K–$75K
Profit-taking near $85K–$90K
Whale Behavior:
Accumulation wallets increasing exposure below $80K
Distribution pockets visible near $90K–$100K
7. Polymarket-Style Probability Mapping
Will Bitcoin sustain V-shaped reversal?
Strong bullish continuation: 45–55%
Sideways consolidation: 30–40%
Failed reversal (double dip): 20–30%
Will BTC break $92K resistance?
Yes breakout scenario: 40–50%
Rejection + retrace: 50–60%
Will BTC revisit $70K again?
Yes (liquidity sweep): 35–45%
No (trend continuation): 55–65%
8. Bullish Scenario Breakdown
If V-shaped reversal confirms:
Break above $88K–$92K
Acceleration toward $100K–$110K
Mid-term extension toward $120K–$135K
Supercycle narrative reactivation toward $150K–$180K
9. Bearish Risk Scenario
If reversal fails:
Rejection near $85K–$88K
Drop back to $75K support
Possible liquidity sweep toward $65K–$60K
Formation of broader distribution range
10. Market Sentiment Structure
Current sentiment phases:
Retail: cautiously optimistic
Institutional: neutral accumulation
Derivatives: balanced leverage positioning
Long-term holders: strong holding behavior
Market is not fully bullish yet — it is in transition phase
11. Key Confirmation Signals
V-shaped reversal confirms only if:
Daily close above $92,000
Volume expansion continues
ETF inflows remain positive
No rejection from upper liquidity zones
Failure signals:
Breakdown below $78,000
ETF outflows spike
Low volume rally rejection
Bearish divergence formation
12. Final Conclusion
Bitcoin’s current structure strongly resembles a macro V-shaped recovery phase, transitioning from deep accumulation near $60K toward a potential trend reversal zone.
However, the structure is still incomplete until price confirms breakout above $92K–$100K resistance zone.
Until then, Bitcoin remains in a high-volatility confirmation zone, where both continuation and rejection scenarios remain active.
The next major move will likely be fast, directional, and liquidity-driven.
repost-content-media
  • Reward
  • Comment
  • Repost
  • Share
#GateSquareMayTradingShare
BITCOIN (BTC) NEXT MOVE — ADVANCED PROBABILITY MODEL (MAY 2026)
Current Price: $78,500 — A Critical Liquidity Zone Where Decisions Define Outcomes
This is not just another moment in the market where price randomly fluctuates and traders chase green candles or panic during red ones, this is a structurally important phase where Bitcoin is compressing within a high-stakes zone, and beneath this calm-looking price action, a complex battle is unfolding between institutional positioning, algorithmic execution, and retail psychology, and the outcome of this phase will def
BTC-2.21%
MMT-2.67%
HighAmbition
#GateSquareMayTradingShare
BITCOIN (BTC) NEXT MOVE — ADVANCED PROBABILITY MODEL (MAY 2026)
Current Price: $78,500 — A Critical Liquidity Zone Where Decisions Define Outcomes
This is not just another moment in the market where price randomly fluctuates and traders chase green candles or panic during red ones, this is a structurally important phase where Bitcoin is compressing within a high-stakes zone, and beneath this calm-looking price action, a complex battle is unfolding between institutional positioning, algorithmic execution, and retail psychology, and the outcome of this phase will define the next major directional move that can either reward prepared traders or completely wipe out those who are operating on emotions instead of structured thinking.
Most traders at this level are still stuck in a binary mindset, constantly asking whether Bitcoin will go up or down next, but that approach is fundamentally flawed because the market does not operate on certainty, it operates on probabilities, and the only way to stay consistently profitable in such an environment is to break the market into multiple scenarios, assign realistic percentage expectations, and prepare actionable strategies for each outcome instead of reacting late when the move has already happened
At the current $78,500 level, Bitcoin is sitting at a pivot zone where liquidity is building both above and below the price, meaning the market has incentives in both directions, which increases volatility potential and decreases predictability, and this is exactly why we shift from prediction to probability-based execution models.
SCENARIO 1: BULLISH EXPANSION (+12% to +18%) — MOMENTUM IGNITION PHASE
In this scenario, Bitcoin successfully defends its support structure and begins to attract aggressive buying pressure, not only from retail participants but more importantly from institutional flows that are quietly positioning themselves before a breakout becomes obvious to the majority, and once price starts pushing above key resistance zones, the market transitions from accumulation to expansion, triggering a chain reaction of momentum-driven buying and short liquidations.
From the current $78,500, a +12% to +18% move projects Bitcoin into the range of:
$87,900 → $92,600
This move is not just a simple upward trend, it is typically characterized by acceleration phases, where price moves faster as it rises due to the presence of liquidity clusters above resistance levels, and these clusters act like magnets, pulling price toward them as market makers exploit stop-loss orders and forced exits from short sellers.
However, one of the biggest misconceptions about bullish markets is that they are easy to trade, when in reality, they are filled with manipulative micro pullbacks, sudden volatility spikes, and fake breakdowns designed to remove weak hands before continuation, which means that traders without a clear plan often exit early and miss the majority of the move.
In this environment, patience and structure are more valuable than speed, and traders who scale into positions instead of chasing entries are the ones who extract the most value.
Bullish Strategic Insight:
If Bitcoin breaks above resistance with strong volume and holds above it, the probability of continuation toward $88K–$92K increases significantly, but success depends on disciplined execution rather than emotional reaction.
SCENARIO 2: SIDEWAYS CONSOLIDATION (±5%) — LIQUIDITY ACCUMULATION PHASE
This is the most deceptive phase of the market, where Bitcoin appears stable on the surface but is internally building the conditions necessary for a larger move, and during this time, price oscillates within a relatively tight range, creating multiple false signals that trap traders on both sides.
From $78,500, a ±5% range defines:
👉 Lower Range: ~$74,500
👉 Upper Range: ~$82,400
This phase is often misunderstood as “boring” or “inactive,” but in reality, it is one of the most strategically important zones, because it is where large players accumulate positions without significantly moving the market, while retail traders exhaust themselves through overtrading and inconsistent decision-making
The defining characteristics of this phase include:
Frequent fake breakouts above resistance followed by quick reversals
Sudden dips below support that recover rapidly
Lack of sustained momentum in either direction
Declining emotional conviction among traders
This environment punishes impatience and rewards precision, and traders who understand this phase shift their focus from aggressive trend trading to range-based strategies, smaller position sizes, and strict risk management.
Sideways Strategic Insight:
Bitcoin moving between $74K–$82K is not a signal of weakness, it is a preparation phase, and those who preserve capital here gain a significant advantage when the breakout eventually occurs.
SCENARIO 3: BEARISH CORRECTION (-10% to -15%) — LIQUIDITY RESET PHASE
If Bitcoin fails to maintain its current support structure and selling pressure intensifies, the market can enter a controlled corrective phase where price moves downward with purpose, targeting liquidity zones below and resetting the overall structure
From $78,500, a -10% to -15% move places Bitcoin in the range of:
$70,600 → $66,700
This phase is often perceived as a collapse by inexperienced traders, but in reality, it is a necessary market function, where excess leverage is removed, funding rates normalize, and long positions that were built without proper risk control are forced out of the system
The transition into this phase is typically confirmed by:
Strong breakdown below support with increased volume
Weak recovery attempts that fail to reclaim lost levels
Rapid shift in sentiment from optimism to fear
This is where the majority makes critical mistakes, either by panic selling near the bottom or attempting to catch reversals without confirmation, both of which result in losses, while experienced traders either capitalize on the downside with controlled risk or patiently wait for high-probability re-entry zones.
Bearish Strategic Insight:
A move toward $66K–$70K is not the end of Bitcoin’s structure, it is a recalibration phase that creates future opportunity for those who remain patient and calculated.
DEEP MARKET REALITY — UNDERSTAND THIS OR GET LEFT BEHIND
At $78,500, Bitcoin is not simply choosing a direction, it is building a decision environment, and traders who fail to adapt to this complexity will continue to operate with outdated thinking patterns that no longer work in modern markets.
The truth is harsh but clear:
👉 The market is engineered to exploit emotional behavior
👉 Liquidity exists where traders are most vulnerable
👉 Price moves toward pain, not comfort
And this is why probability-based thinking is not optional, it is essential.
repost-content-media
  • Reward
  • Comment
  • Repost
  • Share
#GateSquareMayTradingShare
WHY YOUR STOP LOSS ALWAYS GETS HIT BEFORE THE MARKET MOVES IN YOUR DIRECTION
This is not bad luck. This is not randomness. This is engineered market structure, smart money psychology, and liquidity mechanics working in perfect harmony to extract value from predictable retail behavior.
In today’s Bitcoin market hovering around $78,500, we are in a classic consolidation zone where both bullish and bearish positions are heavily clustered. Price isn’t wandering aimlessly — it is deliberately probing liquidity pools on both sides before committing to the next major dir
BTC-2.21%
HighAmbition
#GateSquareMayTradingShare
WHY YOUR STOP LOSS ALWAYS GETS HIT BEFORE THE MARKET MOVES IN YOUR DIRECTION
This is not bad luck. This is not randomness. This is engineered market structure, smart money psychology, and liquidity mechanics working in perfect harmony to extract value from predictable retail behavior.
In today’s Bitcoin market hovering around $78,500, we are in a classic consolidation zone where both bullish and bearish positions are heavily clustered. Price isn’t wandering aimlessly — it is deliberately probing liquidity pools on both sides before committing to the next major directional leg. Most traders lose here not because their analysis is wrong, but because they fail to understand that their stop loss is often the very fuel the market needs.
THE CORE TRUTH: STOP LOSSES = LIQUIDITY POOLS
Large institutions, whales, and market makers cannot enter or exit multi-million or billion-dollar positions without sufficient liquidity. They need opposing orders to absorb their size without massive slippage.
Where does this liquidity come from?
Retail stop losses
Panic sells/buys
Overleveraged liquidations
Late breakout entries
Emotional FOMO/FUD reactions
Your stop loss is not hidden. In aggregated order flow data, clustered stops appear as clear liquidity zones. Algorithms and smart money target these zones first because that’s where the easiest order execution happens.
Markets do not move toward “fair value” — they move toward liquidity. Once liquidity is swept (collected), the real directional move often begins.
THE CLASSIC STOP LOSS HUNT MECHANISM — STEP BY STEP
Retail identifies obvious level
Example: Support at $75,000 or Resistance at $80,000.
Predictable placement
Longs put stops 1-2% below support ($74,500–$74,800)
Shorts put stops above resistance
Breakout traders set buy-stops or limit orders at round numbers
The hunt phase
Price is driven toward the cluster with increasing speed. Volume spikes as liquidations cascade and fuel the move.
Liquidity collection
Stops are triggered → large block of orders executed → smart money enters/exits the opposite side.
Reversal & real move
Price reverses sharply. The original directional bias you expected now plays out — but without you in the trade.
This pattern repeats across timeframes: 15-minute wicks, daily fakeouts, and weekly liquidity sweeps.
UPWARD STOP HUNT (BULL TRAP / SHORT SQUEEZE LIQUIDATION)
Scenario at $78,500:
Resistance cluster at $80,000 (psychological round number)
Short sellers’ stops and retail breakout buy orders stacked above
Price raids $81,000–$82,500 on strong volume and green candles
Social media turns euphoric, FOMO buying accelerates
Short liquidations add rocket fuel
Then the trap:
Sharp rejection candle with long upper wick
Price collapses back below $78,500, often targeting the lower liquidity pool
Result:
Late longs trapped at highs
Shorts liquidated at worst possible moment
Smart money distributed into strength
DOWNWARD STOP HUNT (BEAR TRAP / LONG LIQUIDATION)
Opposite scenario:
Support at $75,000 breaks
Panic selling + long liquidations drive price to $74,000 or $72,000–$70,000 zone
Headlines scream “Bitcoin crash”
Weak hands capitulate
Then the reversal:
Aggressive buying appears from lower liquidity pool
Price sweeps lows, reverses, and climbs back through $78,500 toward $80K+
Result:
Cheap accumulation by smart money
Panic sellers miss the rebound
Bears who shorted the low get squeezed
WHY YOUR STOPS ARE “TOO OBVIOUS”
Retail behavior is highly correlated because:
Same YouTube channels, Twitter accounts, and TradingView setups
Same textbook support/resistance rules
Same risk management teachings (tight stops below/above candles)
Emotional clustering around round numbers ($70K, $75K, $80K, $100K)
This creates liquidity symmetry that institutions can map and exploit with high precision.
VOLUME + WICK STRUCTURE — THE TELLTALE SIGNS
During a hunt:
Explosive volume spike
Long wick (upper or lower)
Fast move into obvious level
Immediate reversal on decreasing volume
After liquidity sweep:
Volume dries up
Price consolidates or trends cleanly
Higher probability continuation
Many traders get stopped out, then watch the market move in their original direction with perfect structure — the classic “wrong twice” feeling.
PSYCHOLOGY: THE INVISIBLE FUEL
Greed → Late entries at breakouts
Fear → Premature exits at breakdowns
Hope → Holding through hunts
FOMO → Chasing wicks
Smart money doesn’t fight this psychology — they engineer it.
PROFESSIONAL APPROACH — HOW TO STOP FEEDING LIQUIDITY
Wait for the sweep: Enter after obvious liquidity has been taken, not before.
Wider invalidation: Use structural levels (higher timeframe swing points) instead of tight candle-based stops.
Avoid round numbers for stops — place them in less obvious zones.
Lower leverage in consolidation/uncertain zones.
Think in liquidity terms: Ask “Where will stops be clustered?” instead of “Where will price go?”
Multiple timeframe confirmation: Look for alignment across daily + 4H + 1H.
Position sizing: Risk less when liquidity hunts are probable.
Fakeout trading: Some advanced traders deliberately trade the manipulation phase.
CURRENT BTC LIQUIDITY MAP — MAY 2026 ($78,500)
Upper Liquidity Pool: $80,000 – $83,000+
(Short stops, breakout buys, FOMO targets)
Lower Liquidity Pool: $74,000 – $70,000
(Long stops, panic liquidation clusters, support breaks)
Most probable near-term behavior:
Sweep one side aggressively → trap participants → reverse and target the opposite pool → then expansion into the real trend.
THE HARDEST TRUTH
Your stop loss isn’t being hunted personally. It is simply part of a statistically predictable liquidity map that the market clears before its next major move.
The market is mechanical, not emotional.
If your placement is obvious, your exit was already priced in.
ULTIMATE POWER LINE:
“The market does not punish your stop loss — it collects what was always predictable. Master liquidity, or remain part of the liquidity.”
Trade less. Observe more. Think like the institutions, not like the crowd.
Once you internalize that price is the distraction and liquidity is the truth, your entire trading psychology shifts — and so do your results.
Stay disciplined.#GateSquare #CreatorCarnival #ContentMining
repost-content-media
  • Reward
  • Comment
  • Repost
  • Share
  • Pinned