Bitcoin traded at $70,795 on March 14, 2026, with a market capitalization of $1.41 trillion and 24-hour trading volume of $49.48 billion. The cryptocurrency moved within an intraday range between $70,416 and $73,838 while technical indicators across major timeframes reflected a neutral market structure.
Bitcoin Chart Outlook
On the daily chart, bitcoin continues to trade inside a consolidation range following a rejection near the $74,000 resistance zone. Current price levels around $70,467 on Bitstamp place the asset in the middle of a broader visible trading band between approximately $63,000 and $77,500.
Market structure reflects sideways movement with declining volatility after the rejection near recent highs. Key resistance remains between $73,800 and $74,000, while mid-range resistance sits near $71,200. Support is identified around $69,500, with stronger structural support near $66,000. As long as the price remains above the $69,500 level, the broader bias remains neutral to slightly upward within the existing range.
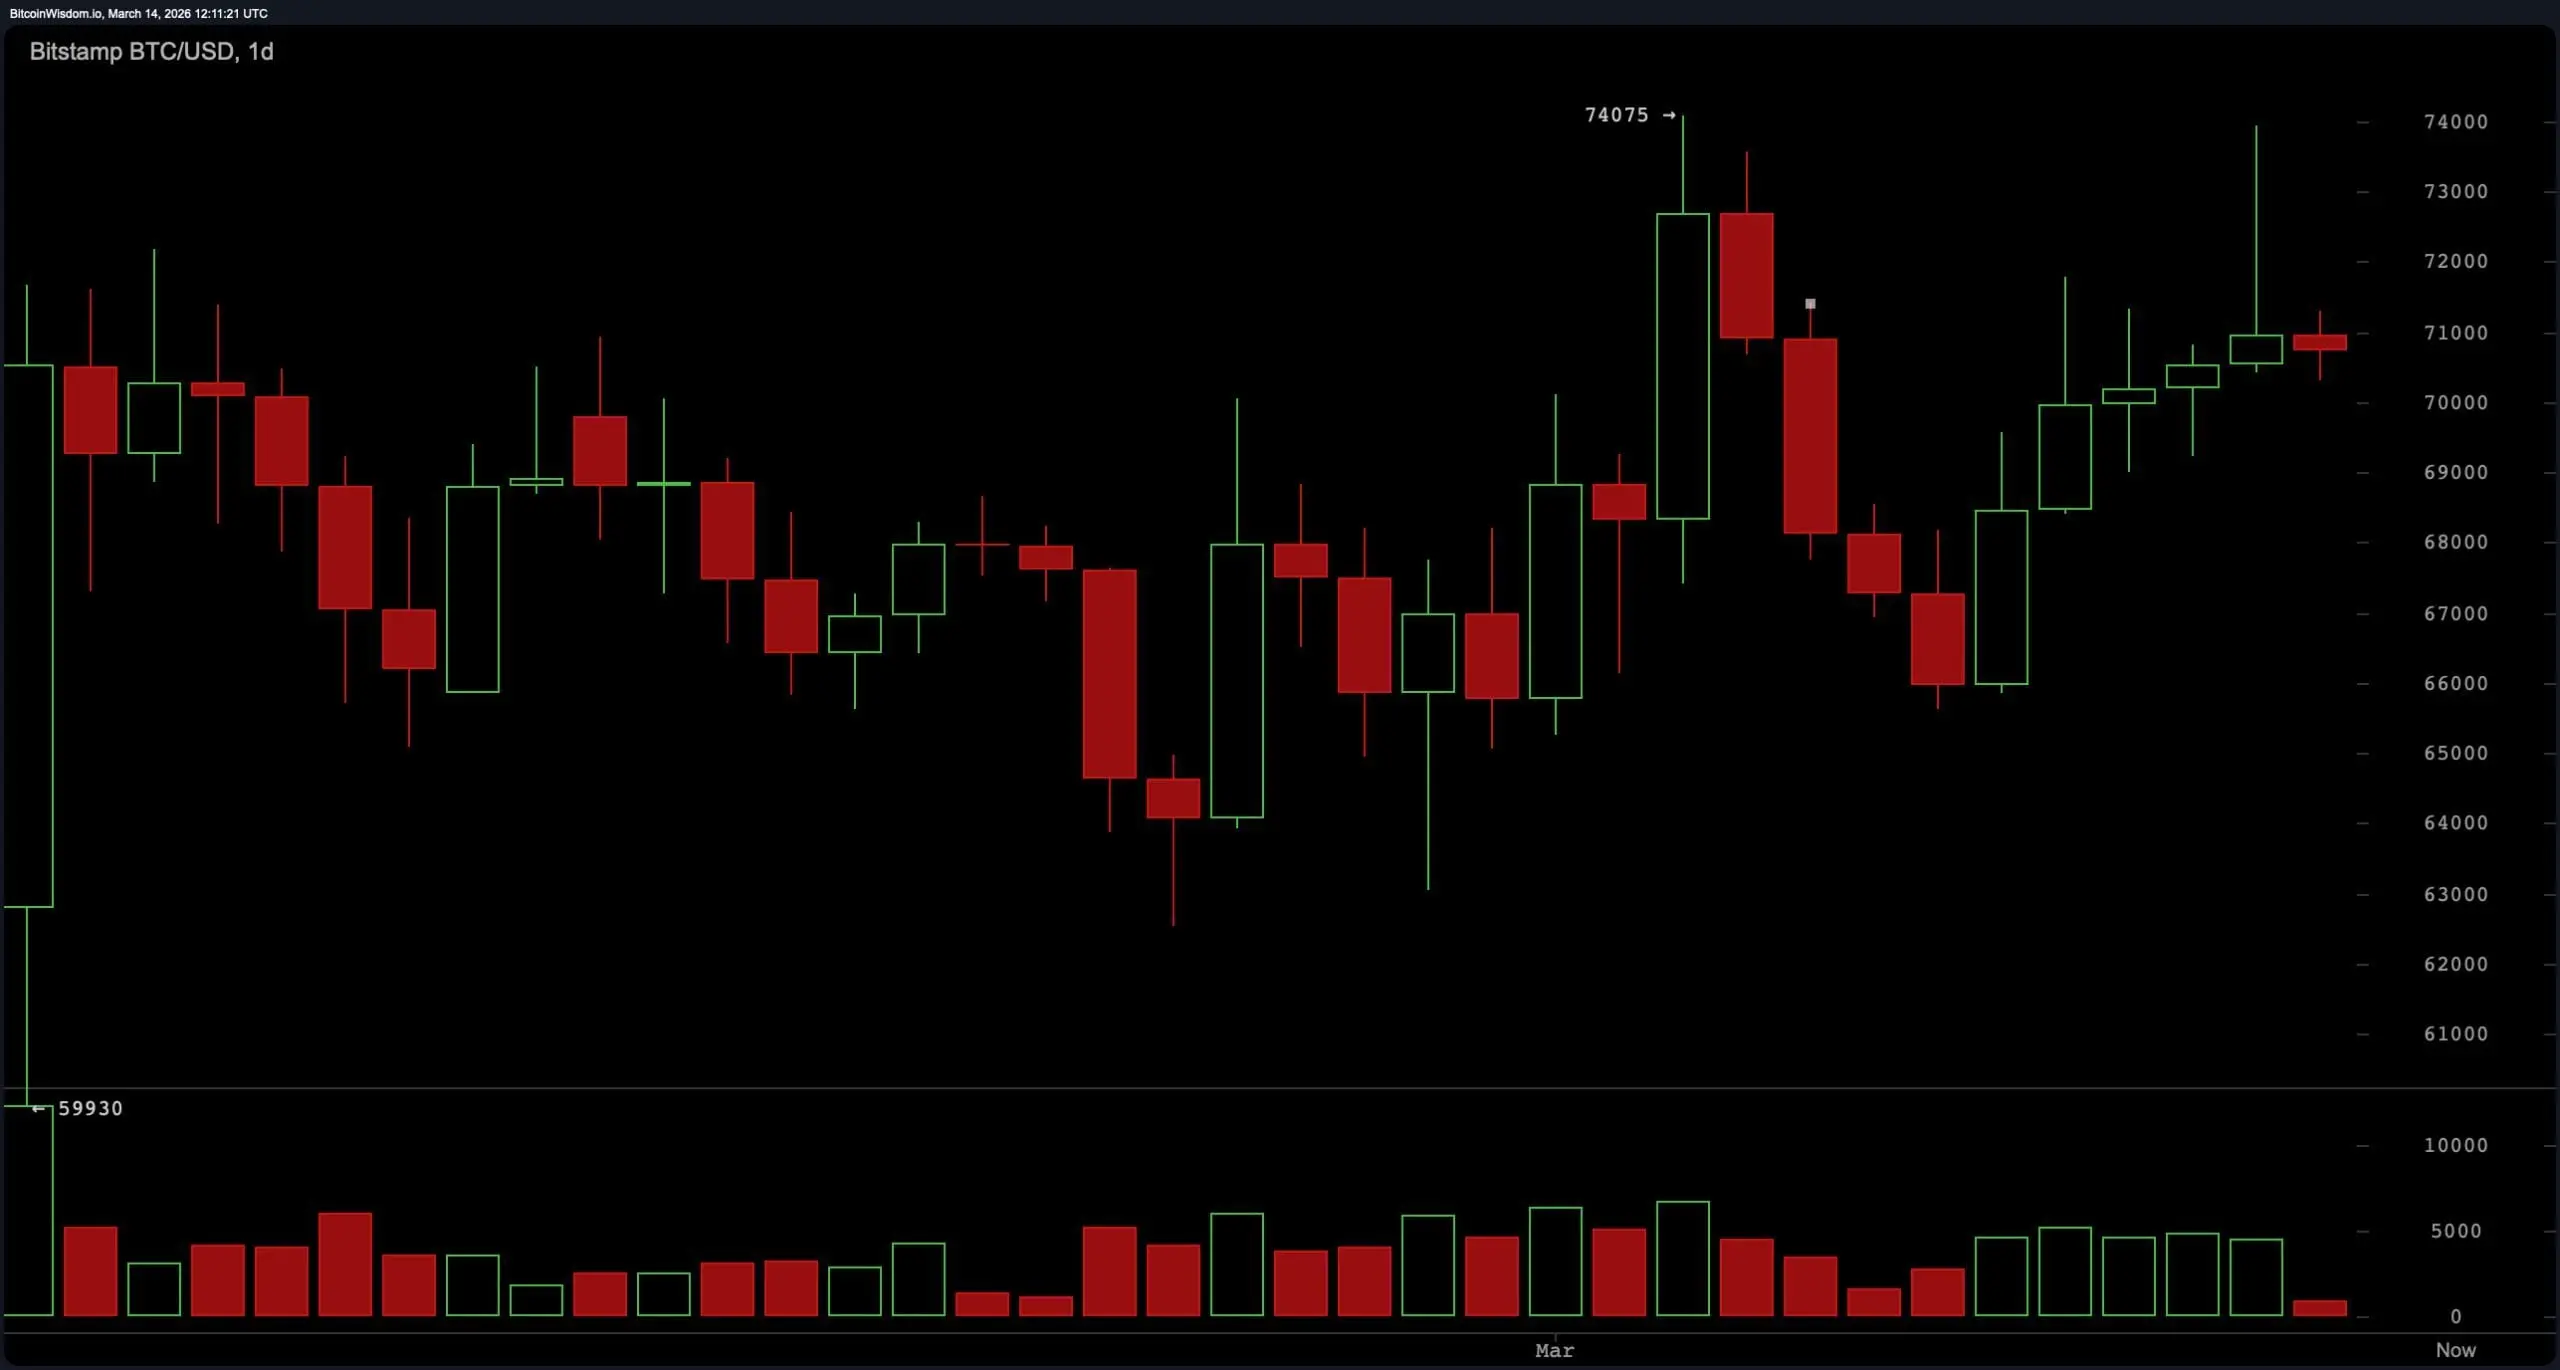 BTC/USD 1-day chart via Bitstamp on March 14, 2026.
The four-hour bitcoin chart shows continued sideways consolidation supported by a sequence of higher lows. Previous swing levels progressed from approximately $65,600 to $69,000 and then to near $70,000, suggesting gradual upward pressure beneath resistance. Price has repeatedly encountered resistance between $71,500 and $72,000, creating a compression pattern as volatility narrows. This type of price structure often precedes expansion once resistance or support is decisively breached. The current compression below resistance indicates that a move beyond this zone could determine the next directional move of roughly $3,000 to $5,000.
BTC/USD 1-day chart via Bitstamp on March 14, 2026.
The four-hour bitcoin chart shows continued sideways consolidation supported by a sequence of higher lows. Previous swing levels progressed from approximately $65,600 to $69,000 and then to near $70,000, suggesting gradual upward pressure beneath resistance. Price has repeatedly encountered resistance between $71,500 and $72,000, creating a compression pattern as volatility narrows. This type of price structure often precedes expansion once resistance or support is decisively breached. The current compression below resistance indicates that a move beyond this zone could determine the next directional move of roughly $3,000 to $5,000.
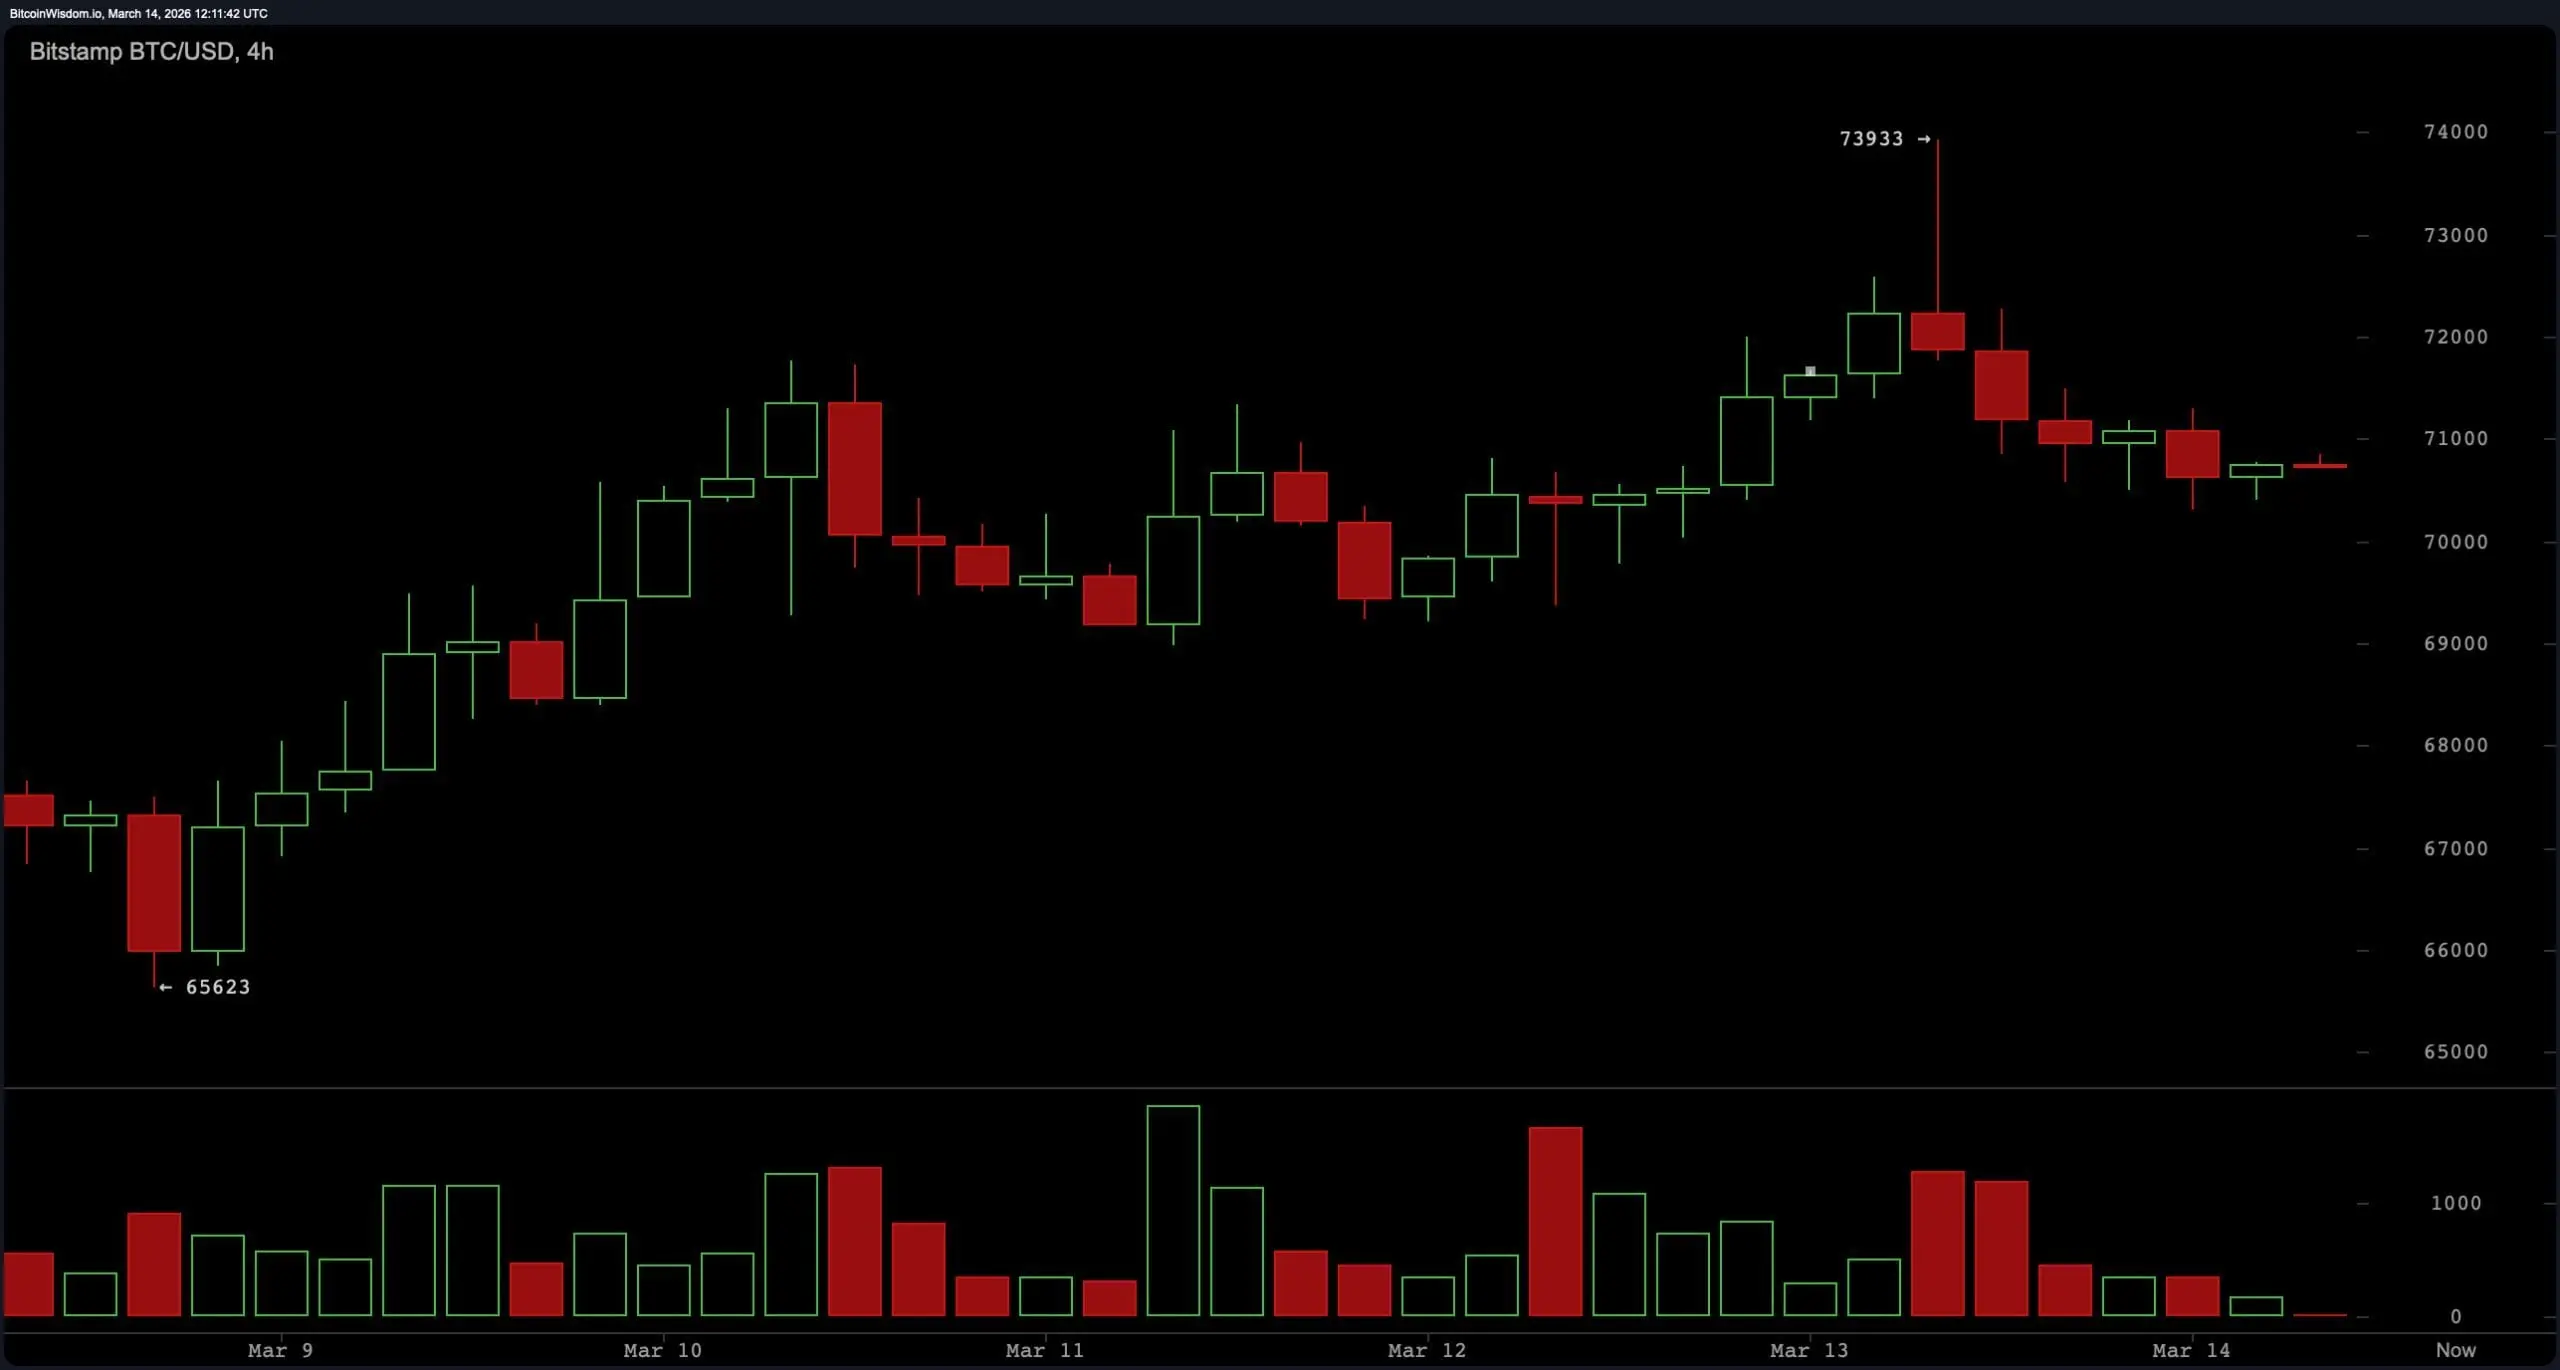 BTC/USD 4-hour chart via Bitstamp on March 14, 2026.
On the one-hour chart, bitcoin is trading within a tight intraday range between $70,300 support and approximately $71,100 resistance. Price movement has remained contained inside this narrow band while trading volume gradually declines, reflecting short-term equilibrium between buyers and sellers. Intraday consolidation within this range suggests the market is awaiting a catalyst for a breakout. Sustained movement above the $71,200 level would place the price near the upper resistance band around $72,800 and $74,000, while a breakdown below $69,500 would expose lower support areas near $67,800 and $66,000.
BTC/USD 4-hour chart via Bitstamp on March 14, 2026.
On the one-hour chart, bitcoin is trading within a tight intraday range between $70,300 support and approximately $71,100 resistance. Price movement has remained contained inside this narrow band while trading volume gradually declines, reflecting short-term equilibrium between buyers and sellers. Intraday consolidation within this range suggests the market is awaiting a catalyst for a breakout. Sustained movement above the $71,200 level would place the price near the upper resistance band around $72,800 and $74,000, while a breakdown below $69,500 would expose lower support areas near $67,800 and $66,000.
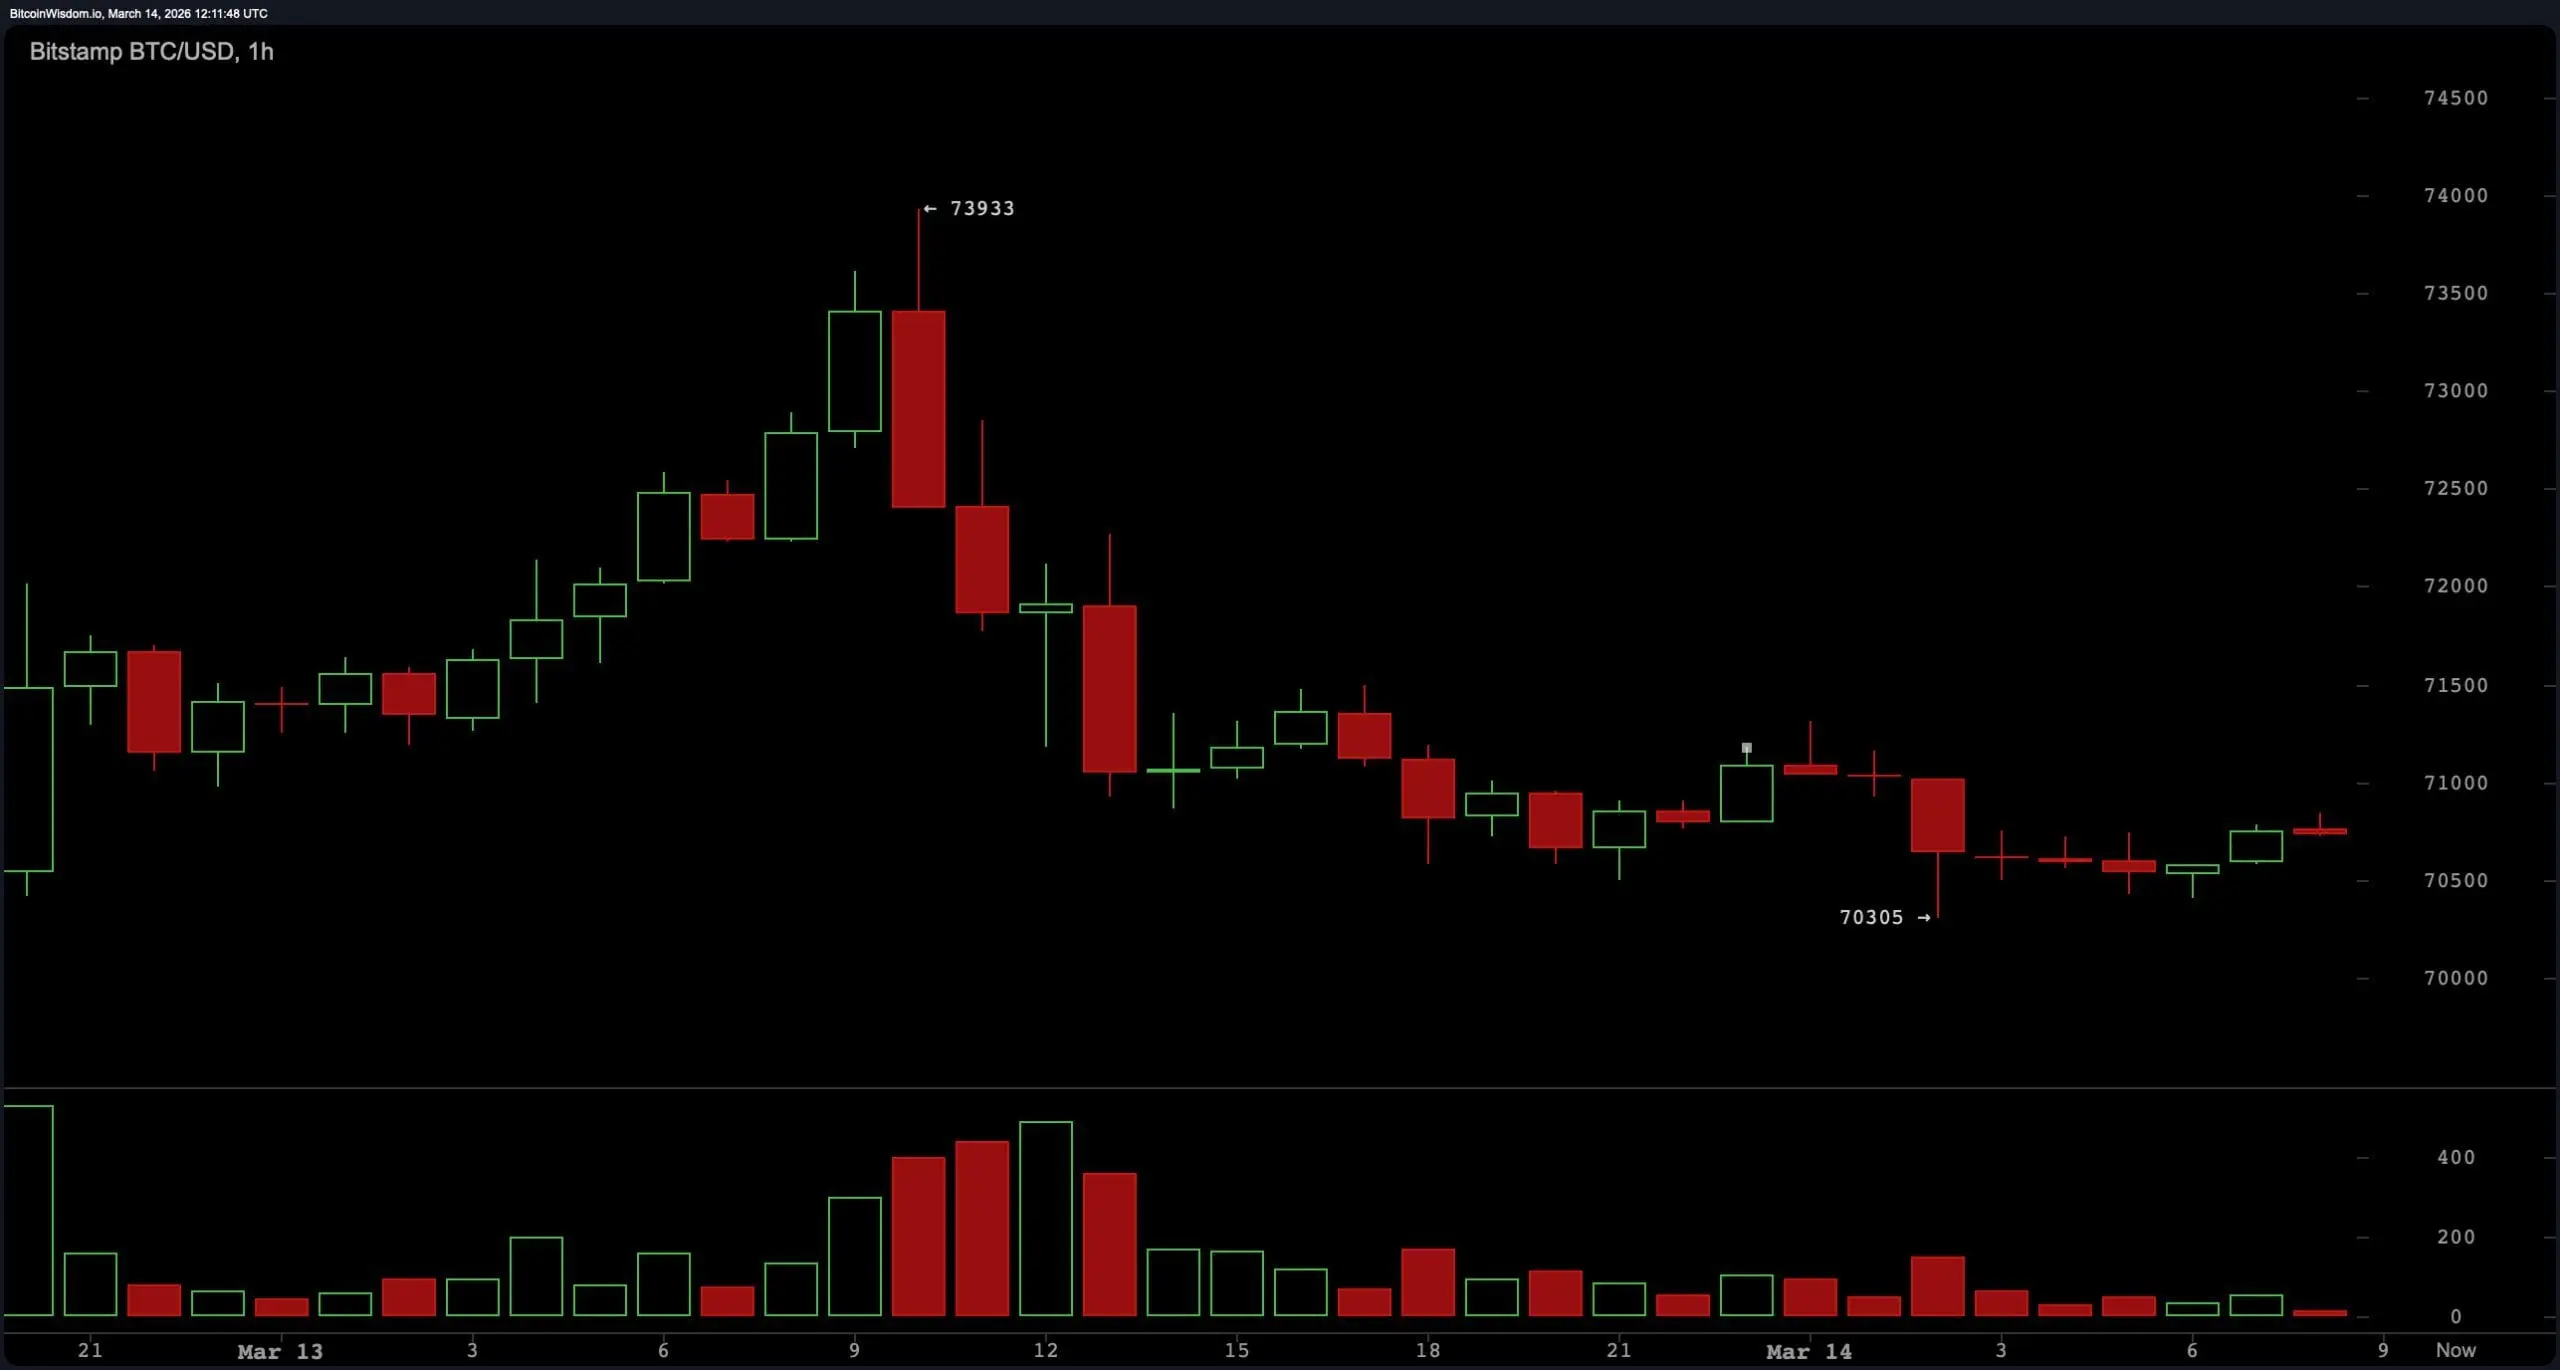 BTC/USD 1-hour chart via Bitstamp on March 14, 2026.
Oscillator readings reflect a neutral technical environment. The relative strength index ( RSI) is positioned at 53, indicating balanced momentum conditions. Stochastic reads 68, while the commodity channel index (CCI) is measured at 89, both also categorized as neutral signals.
BTC/USD 1-hour chart via Bitstamp on March 14, 2026.
Oscillator readings reflect a neutral technical environment. The relative strength index ( RSI) is positioned at 53, indicating balanced momentum conditions. Stochastic reads 68, while the commodity channel index (CCI) is measured at 89, both also categorized as neutral signals.
The average directional index (ADX) stands at 25, showing limited trend strength across the market. The Awesome oscillator records 2,432 and remains neutral. Momentum shows −1,891, signaling short-term downward pressure, while the moving average convergence divergence ( MACD) level registers −186 and signals upward momentum in the indicator summary.
Moving averages (MAs) present a split structure between short-term support and longer-term resistance levels. The exponential moving average (EMA) 10 sits at $69,648 and the simple moving average (SMA) 10 at $69,310, both signaling upward momentum relative to the current price. The EMA 20 at $69,305 and SMA 20 at $68,287 also remain supportive of the current range, along with the EMA 30 at $70,053 and SMA 30 at $68,215.
Longer-term averages reflect downward pressure, with the EMA 50 at $72,764 and the SMA 50 at $71,703 positioned above the price. Higher-period averages remain significantly elevated, including the EMA 100 at $79,665, SMA 100 at $80,935, EMA 200 at $87,978, and SMA 200 at $94,125. This distribution results in an overall neutral technical summary as short-term averages support current levels while longer-term averages remain above the market.
Bull Verdict:
If bitcoin maintains support above $69,500 and breaks decisively above the $71,200 resistance level, the current compression pattern could resolve to the upside. A sustained move through this level would clear short-term resistance and open the path toward $72,800 and a potential retest of the $73,800–$74,000 resistance zone seen on the daily chart. The sequence of higher lows on the four-hour timeframe and supportive short-term moving averages suggests underlying strength remains intact as long as price holds above the mid-range support area.
Bear Verdict:
A breakdown below the $69,500 support level would weaken the current consolidation structure and shift short-term momentum downward. Losing this level would place bitcoin below key range support and expose lower targets around $67,800, with a deeper support zone near $66,000 visible on the daily timeframe. Longer-term moving averages remaining above current price levels continue to signal overhead resistance, meaning sustained weakness below support could accelerate downside pressure if bearish momentum increases.
FAQ 🧭
- What is the bitcoin price on March 14, 2026?
Bitcoin is trading around $70,795, consolidating near the $70,000 level after rejecting resistance near $74,000.
- What are the key bitcoin resistance levels right now?
The main resistance levels for bitcoin are $71,200 in the short term and the major resistance zone between $73,800 and $74,000.
- What are the key bitcoin support levels to watch?
Key bitcoin support sits near $70,300 intraday, with stronger structural support at $69,500 and major support near $66,000.
- Is bitcoin trending up or down right now?
Bitcoin’s current technical trend is neutral as indicators and moving averages show consolidation between roughly $69,500 and $72,000.
Related Articles
BTC em curto prazo sobe 0,63%: Influxo concentrado de fundos em cadeia e posições longas impulsionam alta
2026-03-16 22:00 a 22:15 (UTC), o mercado à vista de BTC apresentou uma movimentação de curto prazo com rendimento de +0,63%, na faixa de preço entre 74.367,7 e 74.902,8 USDT, com uma amplitude de 0,72%. A participação do mercado aumentou significativamente, a volatilidade intensificou-se, e o volume de negociações de curto prazo cresceu 18,2% em relação ao período anterior, atraindo grande atenção.
A principal força motriz dessa movimentação foi o rápido influxo de fundos de grande valor na blockchain para as principais exchanges, com um fluxo líquido de entrada de 1.250 BTC, um aumento considerável em relação ao período anterior. Ao mesmo tempo, a proporção de ordens de compra ativas no mercado à vista subiu para 63%.
GateNews29m atrás
Rally de Bitcoin $71K Tem um Risco Oculto – Será Que Este Popular Crypto DOGEBALL Consegue Superar o $... da Algorand
O mercado de criptomoedas popular está a ganhar novo dinamismo, com a recuperação do Bitcoin em direção aos $71,000 a revelar uma tendência mais profunda que os analistas estão a acompanhar de perto: os traders podem estar a ignorar sinais estruturais que tipicamente precedem rotações significativas de altcoins. Quando o capital se move da dominância do Bitcoin para alternativas
BlockChainReporter31m atrás
Enquanto Ouro e Prata Desabam, Bitcoin Mostra Força – Analista Diz Que Esta É a Maior Rotação de Riqueza da História
O mercado está a enviar sinais mistos que deixam muitos investidores confusos. O ouro está a cair. A prata está a cair. As ações estão a cair. No entanto, a Bitcoin destaca-se, mostrando força relativa e até a aproximar-se de novos máximos.
O especialista em criptomoedas 0xNobler vê algo mais significativo a acontecer sob a superfície.
CaptainAltcoin41m atrás
Michael Saylor Avisa Que Ameaça Quântica Quebraria a Internet - U.Today
Michael Saylor argumenta que a computação quântica representa um risco universal para além do Bitcoin, ameaçando infraestruturas críticas globais. Em resposta aos pontos de vista de Chamath Palihapitiya sobre IA e perturbações de mercado, Saylor insiste que uma transição para Criptografia Pós-Quântica protegerá o Bitcoin e outros sistemas em conjunto, enfatizando a sua resiliência como "Capital Digital".
UToday1h atrás
Homem Alega que Esposa Roubou $172 Milhões em Bitcoin Após 'Gravá-lo Secretamente'
Em síntese
Uma esposa agora afastada é alegadamente suspeita de ter roubado $172 milhões em Bitcoin do seu marido.
Um documento judicial alega que ela utilizou gravações de CCTV para obter a frase-semente de uma carteira de hardware que continha o Bitcoin.
Depois de ser avisado do potencial roubo, o marido configurou
Decrypt1h atrás
IBM Abre Hardware Quântico para Investigadores enquanto Ameaça de Segurança do Bitcoin se Aproxima
Brevemente
IBM expandiu seu programa gratuito de computação quântica, aumentando o tempo de execução e o acesso ao hardware para pesquisadores.
A empresa abriu seu processador Heron R2 para utilizadores que antes estavam limitados a sistemas de nível inicial.
Os avanços na investigação quântica estão a impulsionar os programadores de Bitcoin a preparem-se f
Decrypt1h atrás

