สัญญา
Hundreds of contracts settled in USDT or BTC
TradFi
Gold
Trade global traditional assets with USDT in one place
ออปชั่น
Hot
เทรดออปชัน Vanilla สไตล์ยุโรป
บัญชีครบวงจร
เพิ่มประสิทธิภาพเงินทุนของคุณให้สูงสุด
เทรดเดโม
เริ่มต้นฟิวเจอร์ส
เตรียมพร้อมสำหรับเทรดฟิวเจอร์สของคุณ
กิจกรรมในอนาคต
ร่วมกิจกรรมลุ้นรางวัลสุดคุ้ม
เทรดเดโม
ใช้เงินเสมือนจริงเพื่อสัมผัสประสบการณ์การซื้อขายที่ปราศจากความเสี่ยง
เริ่มต้น
CandyDrop
รวบรวมลูกอมเพื่อรับ Airdrop
Launchpool
Staking อย่างรวดเร็ว
รับโทเค็นใหม่ที่มีศักยภาพ
HODLer Airdrop
ถือ GT ไว้แล้วรับ Airdrop ฟรีจำนวนมาก
Launchpad
รีบเข้าร่วมโครงการโทเค็นใหญ่ๆ ตัวถัดไป
alpha.point.titlenew
alpha.point.subtitlenew
Futures Points
Earn futures points and claim airdrop rewards
การลงทุน
Simple Earn
รับดอกเบี้ยด้วยโทเค็นที่ไม่ได้ใช้งาน
Auto-Invest
Auto-invest on a regular basis
การลงทุนแบบ Dual
ซื้อถูกและขายแพงเพื่อทำกำไรจากความผันผวนของราคา
header.soft_staking
header.soft_staking_desc
กู้ยืมค้ำประกันด้วยคริปโต
0 Fees
จำนำสกุลเงินดิจิทัลหนึ่งเพื่อยืมสกุลเงินดิจิทัลอีกหนึ่ง
header.lend_center
header.lend_center_desc
VIP Wealth Hub
Customized wealth management empowers your assets growth
Private Wealth Management
Customized asset management to grow your digital assets
Quant Fund
ทีมบริหารสินทรัพย์ชั้นนำช่วยให้คุณได้รับผลกำไรแบบไม่มีปัญหา
Staking
สเตกสกุลเงินดิจิทัลพื่อรับรายได้จากผลิตภัณฑ์ที่ใช้ระบบ PoS
Smart Leverage
New
No forced liquidation before maturity, worry-free leveraged gains
header.gusd_minting
header.gusd_minting_desc
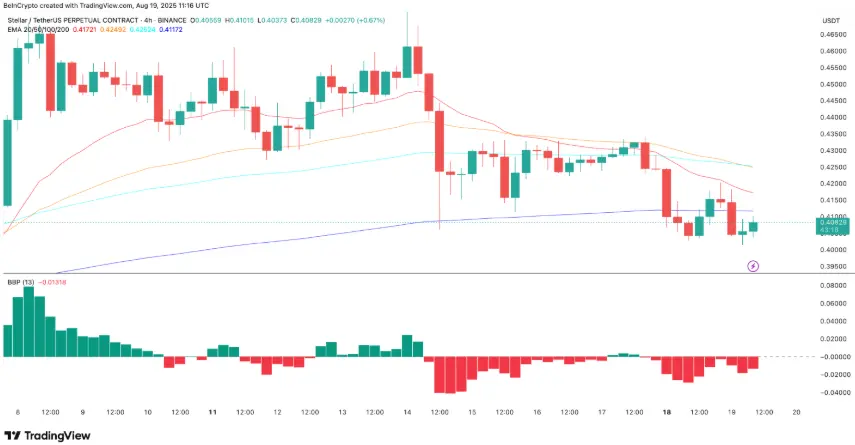 ราคา XLM และการตัดลงของราคา | แหล่งที่มา: TradingViewเส้นค่าเฉลี่ยเคลื่อนที่แบบเอ็กซ์โพเนนเชียล (EMA) มุ่งเน้นไปที่ข้อมูลราคาล่าสุดมากขึ้น เมื่อเส้น EMA ระยะสั้นตัดลงต่ำกว่าเส้น EMA ระยะยาว จะถือว่าเป็นสัญญาณลดลง แสดงให้เห็นว่าราคาในระยะล่าสุดกำลังลดลงเร็วกว่าแนวโน้มระยะยาว.
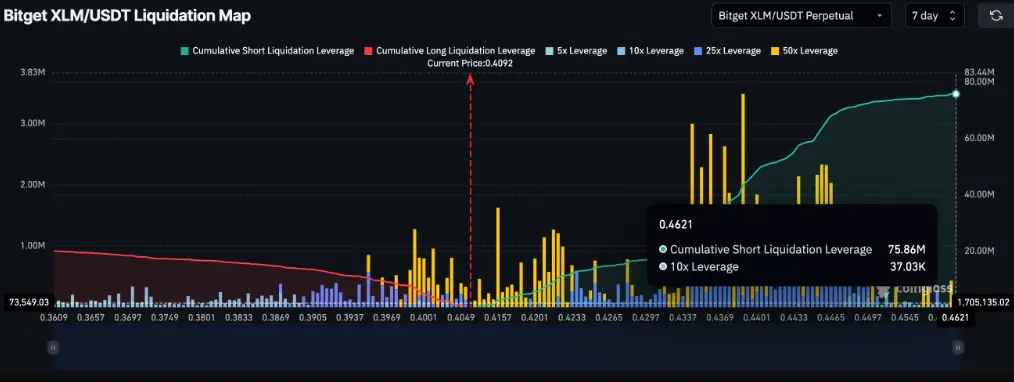 กราฟการชำระบัญชี XLM | แหล่งที่มา: Coinglassการชำระบัญชีแบบสั้นเกิดขึ้นเมื่อมีเทรดเดอร์จำนวนมากเดิมพันว่าราคาจะลดลง (เปิดตำแหน่งสั้น) แต่ในทางกลับกัน ราคากลับเพิ่มขึ้น ทำให้พวกเขาต้องรีบซื้อกลับ การซื้ออย่างตื่นตระหนกนี้ช่วยดันราคาให้สูงขึ้นอย่างกระทันหัน.
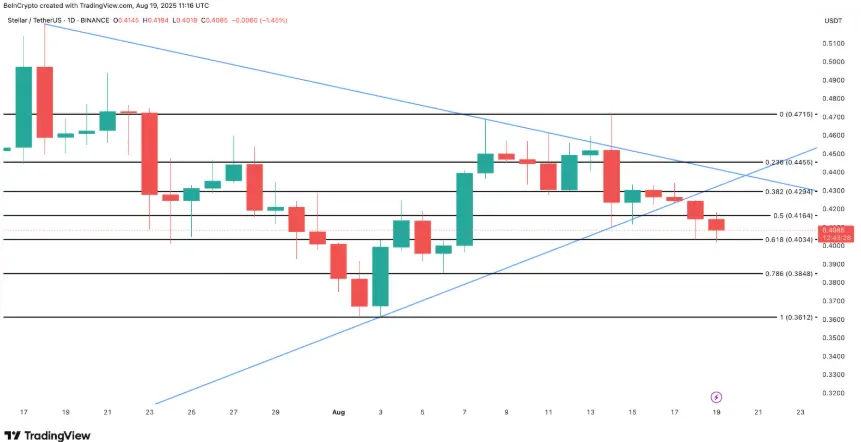 การวิเคราะห์ทางเทคนิค XLM | แหล่งที่มา: TradingViewอย่างไรก็ตาม หากมีการเกิด Short squeeze จริงๆ และ XLM สามารถกลับคืนสู่ช่วง $0.42 ถึง $0.44 ได้ โครงสร้างการลดลงระยะสั้นจะถูกยกเลิก สิ่งนี้จะกลับทิศทางความรู้สึกระยะสั้นและอาจกระตุ้นการซื้ออย่างรุนแรง.