# 2025 LAIR Price Prediction: Expert Analysis and Market Forecast Overview
LAIR Finance operates as a cross-chain liquid restaking gateway enabling yield optimization across Layer 1 blockchains, currently trading at $0.001566 with a $156,286.80 market cap. This comprehensive analysis examines LAIR's price trajectory from 2026-2031 using historical patterns, market dynamics, and ecosystem developments to guide investment decisions. The report addresses critical investor needs: understanding LAIR's market fundamentals, evaluating risk-adjusted entry points, and implementing professional trading strategies on Gate. Structured in six core sections, the analysis progresses from historical price review and current market status through technical indicators and holdings distribution, to detailed forecasts with conservative, neutral, and optimistic scenarios, plus actionable investment methodologies and comprehensive risk management frameworks. Designed for newcomers, experienced traders, and institutional investors
Introduction: LAIR's Market Position and Investment Value
LAIR (LAIR) serves as a cross-chain liquid restaking gateway that enables users to compound yields while moving liquidity across Layer 1 blockchains. As of January 2026, LAIR has established itself as a notable player in the restaking ecosystem with a market capitalization of approximately $156,286.80 USD and a circulating supply of 99.8 million tokens, trading at around $0.001566 per token. This innovative protocol, recognized for its "efficient restaking mechanism," is actively reshaping the decentralized finance landscape by facilitating dApp adoption and network growth across multiple blockchain ecosystems.
With over 3.6 million users and strategic partnerships with leading Web3 brands including Catizen, Avalon, and Line Next, LAIR has already secured 66% of Kaia's total value locked (TVL) while expanding its reach to emerging chains like Berachain. The protocol's ability to deliver optimized restaking solutions tailored to each blockchain's unique structure demonstrates its growing importance in the broader Web3 infrastructure.
This comprehensive analysis will examine LAIR's price trajectory from 2026 through 2031, integrating historical price patterns, market supply and demand dynamics, ecosystem developments, and macroeconomic factors to provide investors with professional price forecasts and actionable investment strategies. Whether trading on Gate.com or conducting long-term portfolio analysis, understanding LAIR's market fundamentals is essential for informed decision-making in the rapidly evolving restaking sector.
I. LAIR Price History Review and Market Status
LAIR Historical Price Evolution
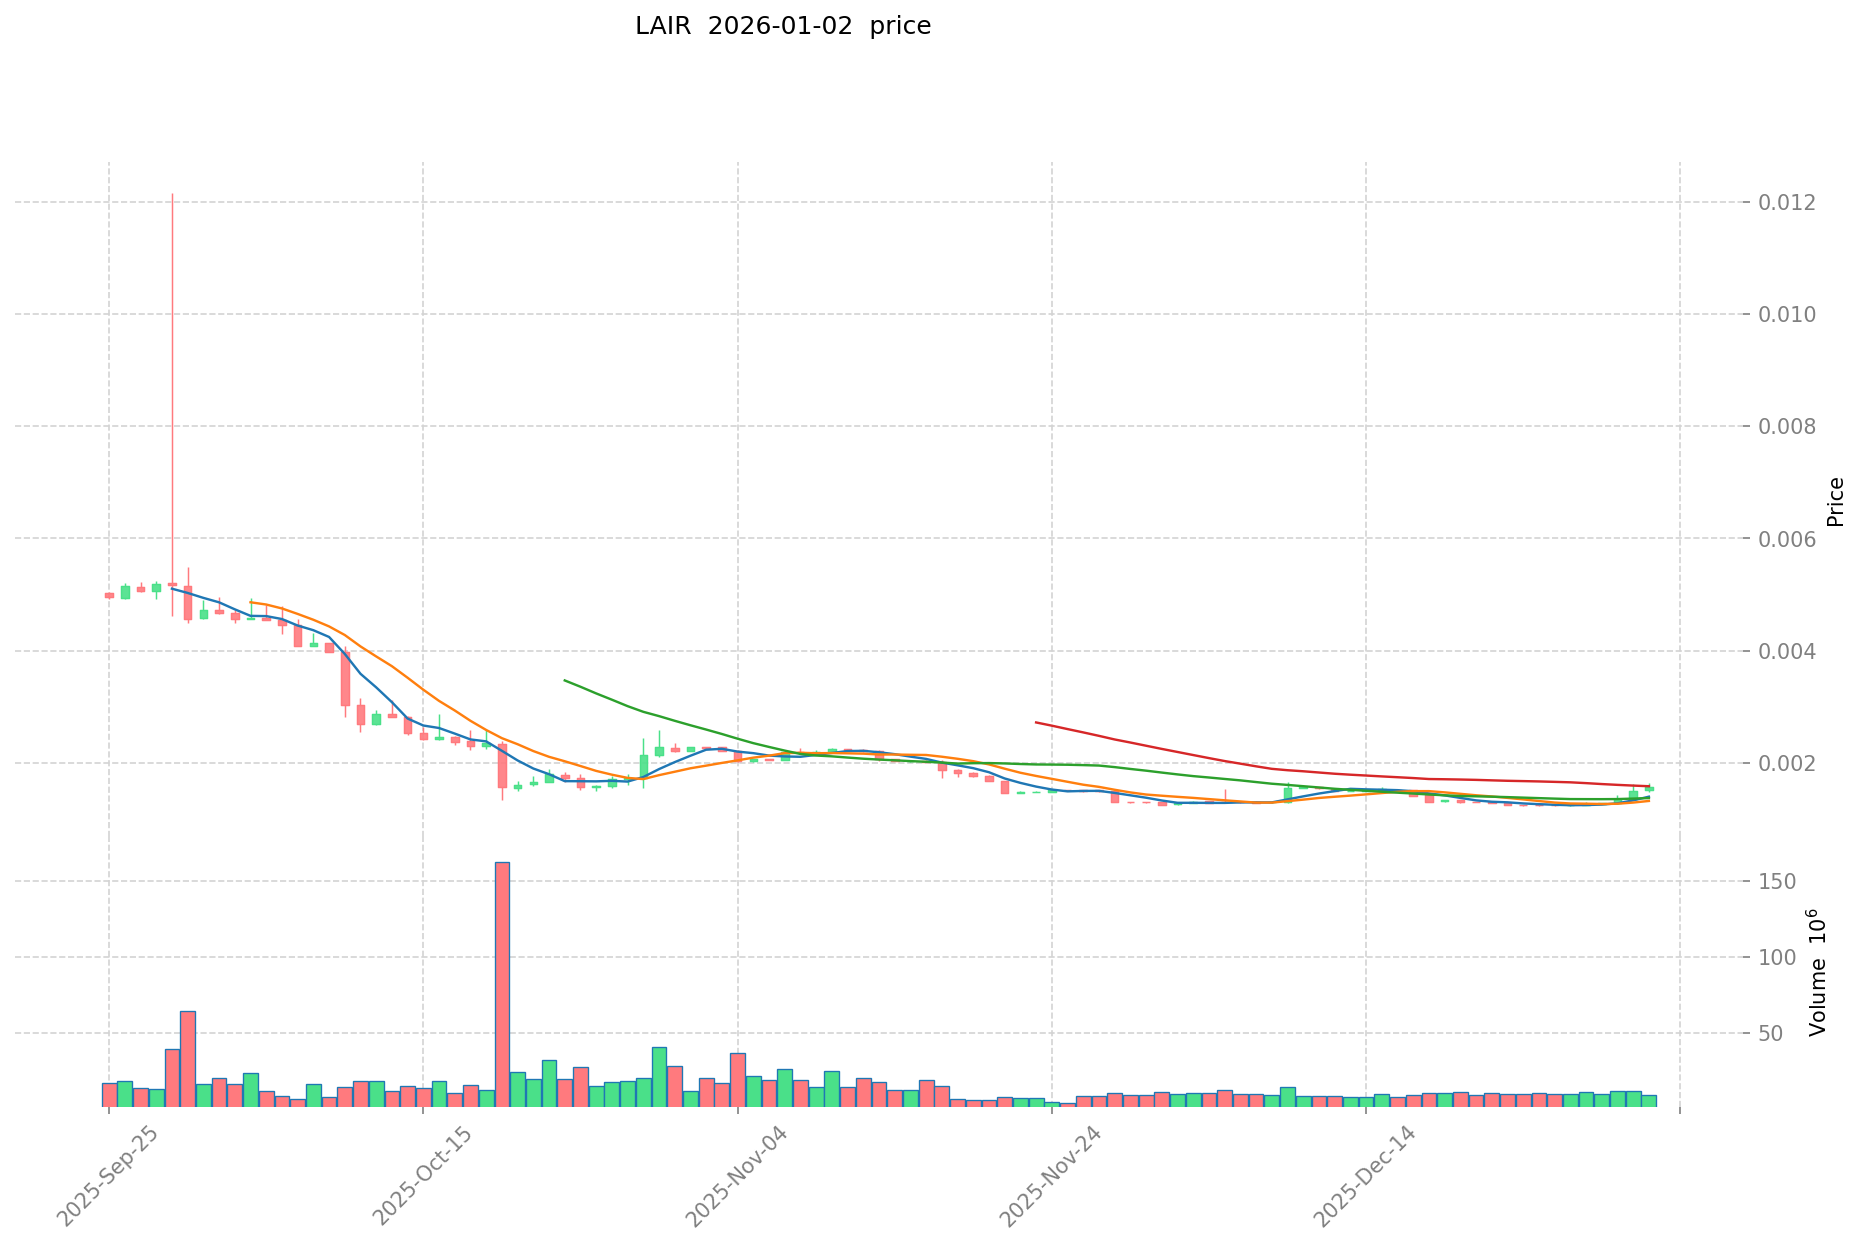
LAIR reached its all-time high (ATH) of $0.08021 on April 25, 2025, marking the peak of investor sentiment during that period. Subsequently, the token experienced a significant correction phase, declining substantially from its peak valuation.
On December 26, 2025, LAIR hit its all-time low (ATL) of $0.00123, representing a decline of approximately 98.5% from its historical peak. This marked the lowest point in the token's trading history to date.
As of January 2, 2026, LAIR is trading at $0.001566, positioned between its ATH and ATL levels, reflecting the current market valuation after the substantial corrections experienced throughout 2025.
LAIR Current Market Status
Price Metrics:
- Current Price: $0.001566
- 24-Hour Range: $0.001472 - $0.001579
- Market Capitalization: $156,286.80
- Fully Diluted Valuation (FDV): $1,566,000.00
- Circulating Supply: 99,800,000 LAIR (9.98% of total supply)
- Total Supply: 1,000,000,000 LAIR
Recent Price Performance:
- 1-Hour Change: +4.42%
- 24-Hour Change: +1.49%
- 7-Day Change: +26.19%
- 30-Day Change: +19.82%
Market Indicators:
- 24-Hour Trading Volume: $14,257.61
- Token Holders: 5,115
- Market Dominance: 0.000048%
- Exchange Listings: 1
The token demonstrates relatively modest trading volume with a concentrated holder base. Recent short-term performance shows positive momentum, with gains across all measured timeframes, particularly notable 7-day and 30-day increases.
Click to view current LAIR market price
LAIR Market Sentiment Index
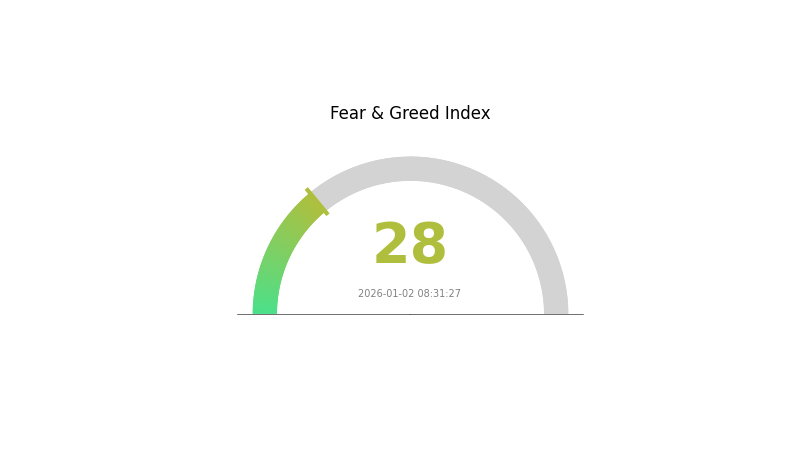
2026-01-02 Fear and Greed Index: 28 (Fear)
Click to view current Fear & Greed Index
The crypto market is currently experiencing a fear sentiment with an index reading of 28, indicating heightened market anxiety. This fear-driven environment typically presents contrarian opportunities for long-term investors. During such periods, market volatility increases, and prices may experience significant fluctuations. Experienced traders often view extreme fear as potential buying opportunities, as market downturns can create favorable entry points for quality assets. Investors should maintain a diversified portfolio and consider their risk tolerance while monitoring market developments closely on Gate.com's market data platform.
LAIR Holdings Distribution
Address holdings distribution refers to the allocation of LAIR tokens across different wallet addresses on the blockchain, providing critical insights into token concentration and the distribution of ownership power within the ecosystem. This metric serves as a fundamental indicator for assessing market structure health and decentralization levels.
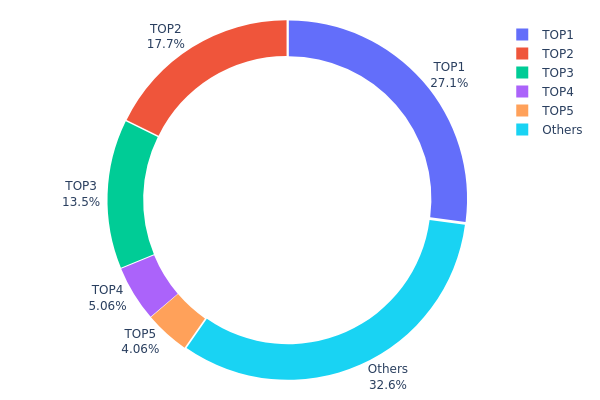
The current LAIR holdings data reveals a moderately concentrated distribution pattern. The top five addresses collectively control approximately 67.38% of total token supply, with the largest holder commanding 27.06% of all tokens. While this concentration level warrants attention, it does not indicate extreme centralization. The top three addresses account for 58.27% of holdings, suggesting that decision-making power is distributed across multiple stakeholders rather than concentrated in a single entity. The remaining 32.62% of tokens held across all other addresses demonstrates a meaningful base of distributed holders, which provides some degree of decentralization resilience.
This distribution structure presents both opportunities and considerations for market dynamics. The presence of several large holders could potentially influence price movements and market sentiment, particularly during periods of low liquidity or significant market activity. However, the substantial minority position held by dispersed addresses indicates that no single actor possesses overwhelming control. The distribution suggests a market structure where institutional or early-stage stakeholders maintain significant positions alongside a broader community base, a pattern commonly observed in established cryptocurrency projects transitioning toward more mature market conditions.
Click to view current LAIR Holdings Distribution
| Top |
Address |
Holding Qty |
Holding (%) |
| 1 |
0x9025...cceb3b |
261000.00K |
27.06% |
| 2 |
0x1b27...32f243 |
171000.00K |
17.73% |
| 3 |
0xdf82...1091ce |
130000.00K |
13.48% |
| 4 |
0xf4df...e51897 |
48774.00K |
5.05% |
| 5 |
0xcef5...31ea4d |
39166.67K |
4.06% |
| - |
Others |
314348.64K |
32.62% |
Core Factors Influencing LAIR's Future Price
Supply Mechanism
- Deflationary Model: LAIR continuously reduces supply through token burns.
- Historical Patterns: Past burn events have been accompanied by short-term price increases.
- Current Impact: Scarcity plays a crucial role in long-term value foundation, with total supply of 1 billion tokens and circulating supply of approximately 99.8 million tokens.
Market Sentiment and Regulatory Dynamics
- Market Sentiment: Investor confidence and sentiment directly impact LAIR price movements. Positive news regarding widespread adoption or major technological breakthroughs can drive price appreciation, while negative sentiment can lead to downward pressure.
- Regulatory Dynamics: Regulatory policies have a significant impact on market performance. Changes in cryptocurrency regulations can substantially affect price volatility and market behavior.
- Supply-Demand Dynamics: The interplay between market supply and demand fundamentally influences price discovery and market direction.
III. 2026-2031 LAIR Price Forecast
2026 Outlook
- Conservative Forecast: $0.00115 - $0.00157
- Neutral Forecast: $0.00157
- Optimistic Forecast: $0.00213 (requires sustained market interest and positive ecosystem developments)
2027-2029 Medium-term Outlook
- Market Stage Expectation: Gradual accumulation phase with steady appreciation as adoption expands
- Price Range Forecast:
- 2027: $0.00161 - $0.00244 (18% potential upside)
- 2028: $0.00176 - $0.00279 (37% potential upside)
- 2029: $0.00185 - $0.00353 (57% potential upside)
- Key Catalysts: Increased protocol adoption, strategic partnerships, ecosystem expansion, and improved market sentiment in the broader digital asset space
2030-2031 Long-term Outlook
- Base Case Scenario: $0.00222 - $0.0036 (91% upside potential by 2030, assuming steady market conditions)
- Optimistic Scenario: $0.00277 - $0.00363 (110% upside potential by 2031, assuming accelerated adoption and positive regulatory environment)
- Transformative Scenario: Price levels supported by mainstream institutional adoption, breakthrough technological innovations, and establishment of LAIR as a key utility token within its ecosystem
- 2026-01-02: LAIR trading at foundational price levels with multi-year accumulation opportunity ahead
| 年份 |
预测最高价 |
预测平均价格 |
预测最低价 |
涨跌幅 |
| 2026 |
0.00213 |
0.00157 |
0.00115 |
0 |
| 2027 |
0.00244 |
0.00185 |
0.00161 |
18 |
| 2028 |
0.00279 |
0.00215 |
0.00176 |
37 |
| 2029 |
0.00353 |
0.00247 |
0.00185 |
57 |
| 2030 |
0.0036 |
0.003 |
0.00222 |
91 |
| 2031 |
0.00363 |
0.0033 |
0.00277 |
110 |
Lair Finance (LAIR) Professional Investment Report
IV. LAIR Professional Investment Strategy and Risk Management
LAIR Investment Methodology
(1) Long-term Holding Strategy
- Suitable For: Risk-averse investors seeking exposure to cross-chain liquid restaking infrastructure
- Operational Recommendations:
- Accumulate LAIR during market consolidations, leveraging the protocol's 3.6 million user base and expanding partnerships with leading Web3 brands like Catizen, Avalon, and Line Next
- Monitor TVL developments on Kaia (currently 66% of protocol TVL) and track expansion progress on Berachain to assess network growth potential
- Establish a regular contribution schedule to dollar-cost average entry prices and reduce timing risk
(2) Active Trading Strategy
- Technical Analysis Tools:
- Volume Analysis: Monitor 24-hour trading volume ($14,257.61) relative to market cap ($156,286.80) to identify liquidity shifts and momentum changes
- Price Action Levels: Track resistance at $0.001579 (24H high) and support at $0.001472 (24H low) for swing trade opportunities
- Wave Trading Key Points:
- Capitalize on the 7-day uptrend of 26.19% and 1-hour momentum of 4.42% to identify potential reversal zones
- Position entries during consolidation phases and exits when volatility metrics indicate overbought conditions relative to the token's market depth
LAIR Risk Management Framework
(1) Asset Allocation Principles
- Conservative Investors: 1-2% of total crypto portfolio
- Active Investors: 3-5% of total crypto portfolio
- Professional Investors: 5-8% of total crypto portfolio
(2) Risk Hedging Solutions
- Cross-chain Protocol Monitoring: Maintain awareness of smart contract audits and security assessments across Kaia and Berachain deployments to mitigate technical failure risks
- Partnership Concentration Risk Management: Diversify exposure across multiple liquid restaking opportunities rather than concentrating solely on LAIR partnerships
(3) Secure Storage Solutions
- Self-Custody Approach: Gate Web3 wallet is recommended for secure LAIR token management with multi-signature support
- Exchange Custody: Maintain trading positions on Gate.com for active traders requiring immediate liquidity access
- Security Considerations: Enable withdrawal whitelisting, use hardware-backed authentication, and verify contract addresses against official channels before transfers
V. LAIR Potential Risks and Challenges
LAIR Market Risk
- Liquidity Risk: With only $14,257.61 in 24-hour volume and 5,115 token holders, the market lacks sufficient depth for large-scale institutional entries, potentially leading to significant price slippage
- Extreme Price Volatility: Historical price ranges from $0.00123 (ATL on December 26, 2025) to $0.08021 (ATH on April 25, 2025) demonstrate 65x volatility, exposing investors to substantial drawdown scenarios
- Market Sentiment Dependency: The protocol's value is heavily influenced by adoption metrics across multiple blockchain ecosystems, making it vulnerable to multi-chain market downturns
LAIR Regulatory Risk
- Cross-Chain Compliance Complexity: Operating restaking services across Kaia, Berachain, and potential future blockchains introduces fragmented regulatory landscapes and potential compliance inconsistencies
- Staking Protocol Classification Uncertainty: Regulatory authorities may reclassify restaking mechanisms as securities or derivatives, triggering restrictions on service offerings or token trading
LAIR Technical Risk
- Smart Contract Vulnerability: As a cross-chain protocol managing user-deposited assets, any exploit or vulnerability in deployed contracts could result in significant capital losses
- Cross-Chain Bridge Risk: Expanding operations to Berachain requires secure inter-blockchain messaging; failures or exploits in bridge infrastructure could compromise fund security
- Ecosystem Dependency: Heavy reliance on Kaia TVL (66%) creates concentration risk; if Kaia experiences technical issues or decreased adoption, protocol revenues could decline substantially
VI. Conclusion and Action Recommendations
LAIR Investment Value Assessment
Lair Finance presents a specialized investment opportunity within the cross-chain liquid restaking sector. The protocol demonstrates strong market positioning with 3.6 million users and strategic partnerships with established Web3 projects. However, the extremely limited market liquidity ($14,257.61 daily volume) and modest market cap ($156,286.80) indicate this is an early-stage, illiquid asset suitable only for risk-tolerant investors. The significant price volatility (65x range) and concentration on Kaia (66% TVL) present both growth opportunities and substantial downside risks. Long-term value depends critically on successful expansion to Berachain and sustained dApp adoption across supported ecosystems.
LAIR Investment Recommendations
✅ Newcomers: Begin with minimal position sizing (0.5-1% of crypto allocation) through Gate.com; use limit orders to minimize slippage; educate yourself on restaking mechanics and cross-chain protocols before increasing exposure
✅ Experienced Investors: Implement disciplined position management with clear stop-loss levels at 20-30% below entry; monitor TVL metrics and partnership announcements; consider tactical accumulation during 30% pullbacks given the strong 7-day trend
✅ Institutional Investors: Conduct comprehensive technical audits of smart contracts across all deployment chains; establish relationships with Lair Finance team to assess governance participation and protocol roadmap; structure positions with appropriate hedging strategies given illiquidity constraints
LAIR Trading Participation Methods
- Spot Trading on Gate.com: Purchase and hold LAIR directly for exposure to protocol growth and network expansion
- Liquidity Pool Participation: Engage with LAIR pools on Kaia to earn yield while providing market liquidity
- staking and Restaking: Utilize LAIR's core offering to compound yields across supported blockchains while supporting network security
Cryptocurrency investments carry extreme risk. This report does not constitute investment advice. Investors should make decisions based on their individual risk tolerance and consult professional financial advisors. Never invest more capital than you can afford to lose completely.
FAQ
What is LAIR token? What are its main use cases and value propositions?
LAIR is the token of Lair Finance, a cross-chain liquidity restaking gateway. It solves compounding yield challenges between Layer 1 blockchains. LAIR's value lies in enhancing cross-chain liquidity efficiency and enabling optimized restaking opportunities.
What will LAIR price prediction develop like in 2024-2025?
LAIR price is expected to remain stable during 2024-2025, maintaining around 1.5-2 times its initial cost. While increased market supply may cause short-term fluctuations, the long-term trend continues upward with steady growth momentum.
What are the main factors affecting LAIR price?
LAIR price is influenced by market sentiment, trading volume, technological developments, user adoption trends, macroeconomic conditions including interest rate changes, liquidity cycles, and regulatory policies.
What are the advantages and disadvantages of LAIR compared to similar tokens?
LAIR excels in liquidity staking and decentralized trading with substantial transaction volume. However, it faces lower market competitiveness and less mature ecosystem compared to rivals. Technical innovation remains limited, potentially affecting long-term growth prospects.
What are the main risks to consider when investing in LAIR?
Main risks include market volatility, price manipulation, regulatory uncertainty, and technical security vulnerabilities. LAIR's value depends on market conditions and protocol performance.
LAIR的历史价格表现如何?
LAIR历史最低价为¥0.00868,最高价为¥0.3037。从低点到高点展现了显著的增长潜力,当前价格为¥0.00878,处于相对低位。
What is the technical team and development roadmap of the LAIR project?
LAIR's technical team focuses on lidar technology development. The roadmap progresses from mechanical rotating scanning to solid-state scanning, with current emphasis on solid-state direction as the industry trend.
LAIR is listed on which exchanges? How is the liquidity?
LAIR is listed on Gate.com and MEXC exchanges, maintaining good liquidity with solid trading volume. The token offers DeFi benefits and continues to support active market participation.
* The information is not intended to be and does not constitute financial advice or any other recommendation of any sort offered or endorsed by Gate.