# 2025 NETT Price Prediction: Expert Analysis and Market Forecast for the Coming Year
Netswap (NETT) is a leading decentralized trading platform on Metis Andromeda Layer 2, currently trading at $0.01632 with a fully diluted valuation of $1.56 million. This comprehensive analysis examines NETT's historical price performance, current market dynamics, and multi-year price forecasts through 2031, integrating macroeconomic factors, tokenomics, and ecosystem developments. The article provides professional investment strategies across conservative, active, and long-term holding approaches while emphasizing critical risk management frameworks including position sizing, dollar-cost averaging, and secure storage solutions on Gate. Designed for DeFi enthusiasts, Layer 2 believers, and risk-aware investors, this guide addresses extreme price volatility (-90.11% YoY), liquidity constraints, and holder concentration risks through actionable recommendations. Readers will discover technical analysis tools, regulatory consid
Introduction: Market Position and Investment Value of NETT
Netswap (NETT) operates as a leading multi-functional decentralized trading platform built on the frontier of DeFi, providing users with seamless, accessible, and empowering trading experiences exclusive to the Metis Andromeda Layer 2 network. Since its launch in December 2021, the project has established itself as a prominent yield-generating platform in the decentralized finance ecosystem. As of January 2, 2026, NETT has a fully diluted valuation of $1,556,436.44, with a circulating supply of approximately 10,999,414 tokens, currently trading at $0.01632. This innovative DeFi protocol is playing an increasingly critical role in optimizing yield generation activities on the Metis ecosystem.
This article will comprehensively analyze NETT's price trends from 2026 to 2031, integrating historical patterns, market supply and demand dynamics, ecosystem development, and macroeconomic factors to provide investors with professional price forecasts and actionable investment strategies.
I. NETT Price History Review and Current Market Status
NETT Historical Price Evolution Trajectory
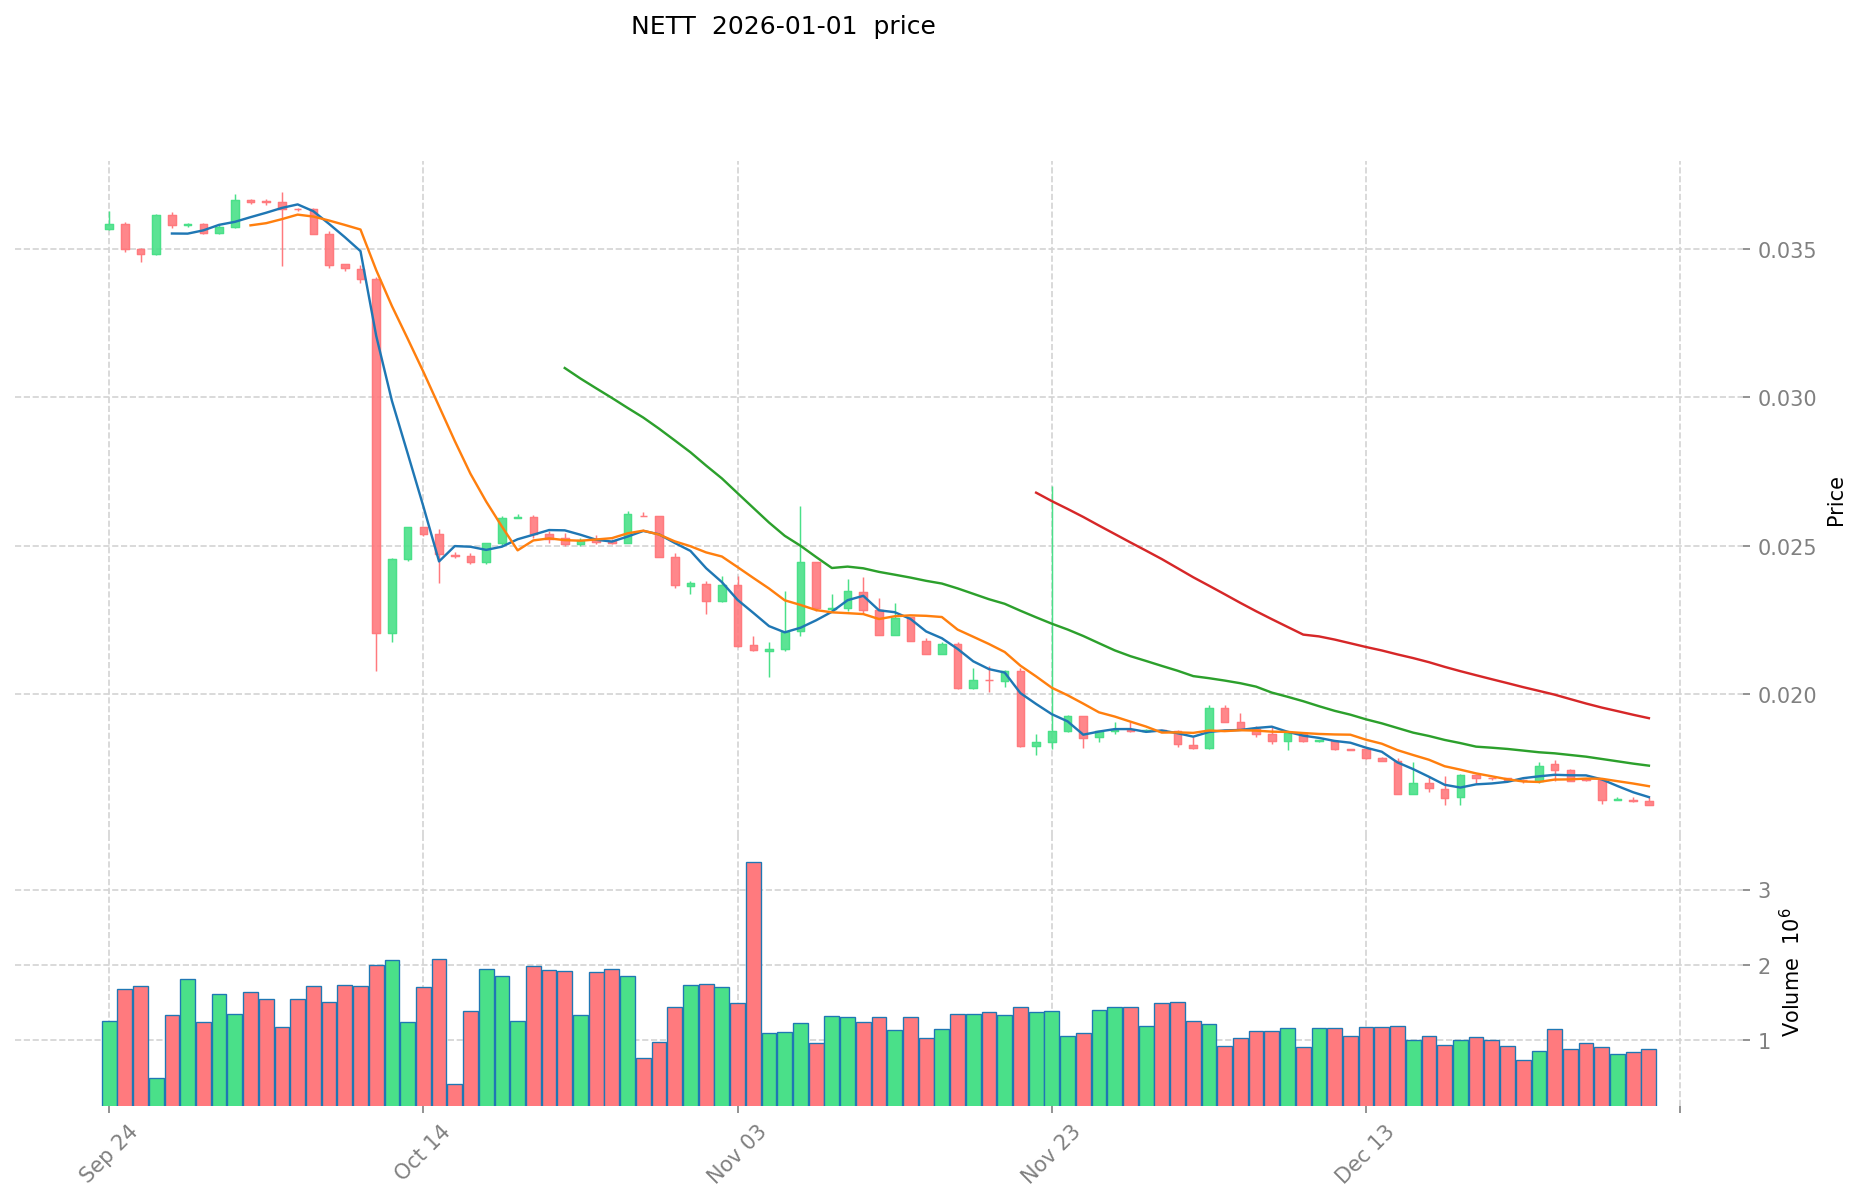
- January 2024: NETT reached its all-time high of $3.50, marking the peak valuation in the token's trading history.
- 2025: The token experienced significant downward pressure throughout the year, with a decline of 90.11% over the 12-month period.
- December 2025: NETT touched its all-time low of $0.01626, reflecting substantial depreciation from previous peaks.
As of January 2, 2026, NETT is trading at $0.01632, reflecting minimal volatility in the short-term perspective with a 1-hour change of +0.25%, while demonstrating weakness across longer timeframes. The 24-hour price action shows a slight decline of -0.24%, indicating consolidation near support levels. Over the extended period, the token has experienced considerable bearish momentum, declining 6.1% in the 7-day window and 10.37% over the past 30 days.
NETT maintains a circulating supply of approximately 10,999,414 tokens out of a total supply of 95,369,880, with a maximum supply capped at 16,666,667 tokens. The current market capitalization stands at $179,510.44, while the fully diluted valuation is valued at $1,556,436.44. With a market dominance of 0.000049%, NETT represents a micro-cap asset within the broader cryptocurrency ecosystem.
The token operates on the Metis blockchain as an exclusive decentralized trading platform, serving as the market-leading multi-functional DEX within the Metis Andromeda Layer 2 ecosystem. Trading volume over the past 24 hours totals $13,265.21, indicating relatively light activity levels. The token maintains a holder base of 21,147 addresses.
Click to view current NETT market price
NETT Market Sentiment Index
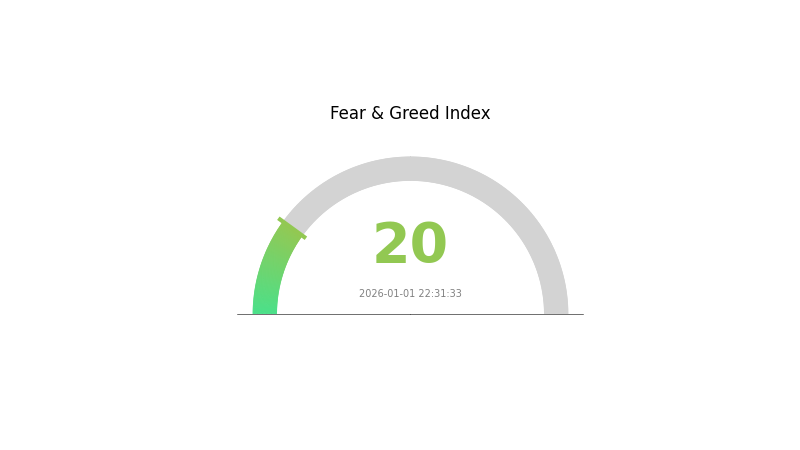
2026-01-01 Fear and Greed Index: 20 (Extreme Fear)
Click to view the current Fear & Greed Index
The crypto market is currently experiencing extreme fear, with the Fear and Greed Index plummeting to 20. This indicates widespread investor panic and significant risk aversion across digital asset markets. Such extreme fear conditions often create contrarian opportunities, as market pessimism may be overshooting fundamentals. Investors should exercise caution during this volatile period while considering long-term investment strategies. Monitor market developments closely on Gate.com for real-time data and insights to make informed trading decisions.
NETT Holdings Distribution
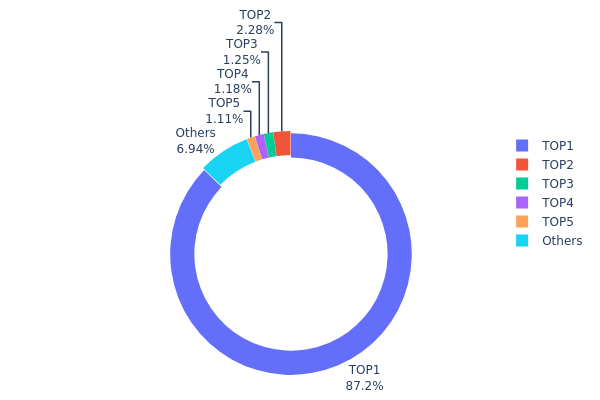
The address holdings distribution chart illustrates the concentration of token ownership across blockchain addresses, revealing the degree of centralization within the NETT ecosystem. This metric is critical for assessing market structure, identifying potential concentration risks, and evaluating the token's decentralization status. By examining the distribution of holdings across the top addresses and remaining holders, investors can gauge liquidity conditions, potential market manipulation risks, and the overall health of the token's ownership structure.
NETT demonstrates significant concentration concerns, with the top address commanding 87.23% of total holdings, representing an extremely skewed distribution pattern. The combined holdings of the top five addresses account for 92.03% of all tokens in circulation, while the remaining addresses collectively hold merely 6.97%. This level of concentration is indicative of a highly centralized token structure, where a small number of large stakeholders possess overwhelming control over supply dynamics. Such extreme concentration creates a potential single point of failure and raises concerns about market stability and fairness.
The pronounced holder concentration observed in NETT's address distribution presents notable implications for market structure and price dynamics. With the majority of tokens controlled by a handful of addresses, there exists heightened vulnerability to large-scale liquidations or coordinated selling events that could trigger significant price volatility. Furthermore, the minimal participation from smaller token holders suggests limited decentralization and retail adoption, potentially constraining organic market development and limiting the token's utility as a truly distributed asset within its ecosystem.
Click to view current NETT Holdings Distribution
| Top |
Address |
Holding Qty |
Holding (%) |
| 1 |
0x1B3D...14DF3b |
83333.33K |
87.23% |
| 2 |
0x4d2F...9C9C27 |
2176.09K |
2.27% |
| 3 |
0x9d1d...0CB052 |
1190.18K |
1.24% |
| 4 |
0x6031...931Cbd |
1131.81K |
1.18% |
| 5 |
0x0D07...b492Fe |
1064.84K |
1.11% |
| - |
Others |
6629.22K |
6.97% |
Analysis of Core Factors Affecting NETT Future Price
II. Core Factors Influencing NETT Future Price
Macroeconomic Environment
-
Monetary Policy Impact: Loose monetary policy may promote asset price increases, while tightening policy could suppress market prices. Central bank policy adjustments directly affect market liquidity and investor risk appetite, thereby influencing NETT price movements.
-
Global Supply and Demand Dynamics: Market prices are significantly affected by global supply and demand. Sudden events such as international disputes or natural disasters may create short-term shocks to market supply and demand, subsequently impacting price volatility.
-
Market Sentiment and Capital Flows: When substantial capital inflows occur in the market, prices may rise rapidly, whereas capital outflows driven by risk-aversion sentiment could trigger significant price declines. The direction and magnitude of capital flows serve as critical indicators of short-term price trends.
III. NETT Price Forecast for 2026-2031
2026 Outlook
- Conservative Forecast: $0.01172 - $0.01400
- Neutral Forecast: $0.01400 - $0.01628
- Optimistic Forecast: $0.01628 - $0.01726 (requires sustained market stability and positive ecosystem developments)
2027-2029 Medium-term Outlook
- Market Stage Expectations: Gradual accumulation phase with modest growth trajectory, characterized by consolidation patterns and incremental value appreciation as the project establishes stronger market presence.
- Price Range Predictions:
- 2027: $0.01325 - $0.01761
- 2028: $0.01461 - $0.02252
- 2029: $0.01608 - $0.02204
- Key Catalysts: Enhanced protocol functionality, increased user adoption, strategic partnerships, and improving market sentiment in the broader cryptocurrency sector.
2030-2031 Long-term Outlook
- Base Case Scenario: $0.01655 - $0.03121 (assuming moderate market growth and steady implementation of planned upgrades)
- Optimistic Scenario: $0.02321 - $0.03677 (assuming accelerated adoption, successful product launches, and favorable macroeconomic conditions)
- Transformation Scenario: Above $0.03677 (contingent upon breakthrough technological achievements, mainstream institutional adoption, and significant expansion of use cases)
- Jan 02, 2026: NETT trades at approximately $0.01628 (baseline reference point for multi-year forecast analysis)
| 年份 |
预测最高价 |
预测平均价格 |
预测最低价 |
涨跌幅 |
| 2026 |
0.01726 |
0.01628 |
0.01172 |
0 |
| 2027 |
0.01761 |
0.01677 |
0.01325 |
2 |
| 2028 |
0.02252 |
0.01719 |
0.01461 |
5 |
| 2029 |
0.02204 |
0.01985 |
0.01608 |
21 |
| 2030 |
0.03121 |
0.02094 |
0.01655 |
28 |
| 2031 |
0.03677 |
0.02607 |
0.02321 |
59 |
Netswap (NETT) Professional Investment Strategy and Risk Management Report
IV. NETT Professional Investment Strategy and Risk Management
NETT Investment Methodology
(1) Long-term Holding Strategy
- Target Investors: DeFi enthusiasts and Layer 2 believers with medium to long-term investment horizons
- Operation Recommendations:
- Accumulate NETT during market downturns, particularly given the -90.11% year-over-year decline, which may represent oversold conditions
- Hold positions through Metis Andromeda ecosystem development cycles and Netswap platform upgrades
- Reinvest any yield-generating activities back into the position to compound returns
(2) Active Trading Strategy
- Technical Analysis Tools:
- Support and Resistance Levels: Monitor the all-time low of $0.01626 (set 2025-12-19) as critical support and historical resistance at $3.5 (set 2024-01-15)
- Volume Analysis: Track the 24-hour trading volume of $13,265 to identify liquidity entry and exit points
- Swing Trading Key Points:
- Execute buy orders near identified support zones when volume increases
- Take profit targets at resistance levels or during positive momentum periods (note: 1-hour change shows +0.25%)
NETT Risk Management Framework
(1) Asset Allocation Principles
- Conservative Investors: 1-2% of portfolio allocation
- Aggressive Investors: 3-5% of portfolio allocation
- Professional Investors: 2-4% with hedging instruments
(2) Risk Hedging Solutions
- Position Sizing: Never exceed 5% of total portfolio in a single Layer 2 token position
- Dollar-Cost Averaging (DCA): Implement systematic purchases over extended periods to reduce timing risk and mitigate extreme price volatility
(3) Secure Storage Solutions
- Hot Wallet Option: Gate.com Web3 wallet for active trading and staking participation on Metis Andromeda
- Self-Custody Approach: Transfer long-term holdings to secure storage solutions for assets you do not plan to actively trade
- Security Considerations: Enable two-factor authentication on all exchange accounts, never share private keys or seed phrases, verify all contract addresses before transfers to prevent phishing attacks
V. NETT Potential Risks and Challenges
NETT Market Risks
- Extreme Price Volatility: NETT has declined 90.11% over the past year, with a current price of $0.01632 compared to its all-time high of $3.5, indicating significant market concentration risk and potential further downside
- Low Trading Liquidity: 24-hour volume of only $13,265 suggests limited liquidity and potential slippage during large trades
- Market Capitalization Concentration: With a fully diluted valuation of $1.56 million and only 21,147 token holders, the asset remains highly susceptible to whale manipulation and sudden exit events
NETT Regulatory Risks
- Layer 2 Protocol Status: Regulatory clarity around Metis Andromeda and Layer 2 solutions remains uncertain across major jurisdictions
- DeFi Compliance Evolution: Ongoing regulatory developments may impact decentralized trading platform operations and token utility
- Jurisdictional Restrictions: Certain regions may limit or prohibit access to Netswap or restrict trading of NETT tokens
NETT Technical Risks
- Smart Contract Vulnerabilities: As an ERC20 token on Metis Andromeda, smart contract bugs or exploits could result in permanent token loss
- Layer 2 Infrastructure Dependency: Netswap's exclusive operation on Metis Andromeda creates single-point-of-failure risk if the Layer 2 solution experiences technical issues
- Ecosystem Adoption Risk: Limited mainstream adoption of Metis Andromeda reduces Netswap's potential user base and platform utility
VI. Conclusions and Action Recommendations
NETT Investment Value Assessment
Netswap represents a niche DeFi offering exclusively on the Metis Andromeda Layer 2 network. While the project provides innovative decentralized trading infrastructure, it faces substantial challenges including extreme price depreciation (-90.11% YoY), minimal trading liquidity, and concentrated holder distribution. The token's fundamental utility depends heavily on Metis Andromeda ecosystem growth and DeFi market recovery. Current valuations may present opportunities for high-risk, high-reward investors, but the asset should be considered highly speculative.
NETT Investment Recommendations
✅ Beginners: Start with minimal allocations (0.5-1%) only if you understand Layer 2 protocols and can afford total loss; focus on learning the Netswap platform before capital deployment
✅ Experienced Investors: Consider 2-4% allocations with strict stop-loss orders at -20% from entry; use technical analysis to identify accumulation zones near support levels
✅ Institutional Investors: Evaluate NETT only as part of broader Layer 2 and DeFi infrastructure exposure; implement robust due diligence on Metis Andromeda technical security and governance
NETT Trading Participation Methods
- Gate.com Spot Trading: Purchase and sell NETT directly on Gate.com's spot trading markets with competitive fees and reliable liquidity aggregation
- Direct Blockchain Transactions: Interact directly with Netswap smart contracts on Metis Andromeda through the official website at https://netswap.io/ for yield farming and liquidity provision activities
- Long-term Portfolio Holdings: Accumulate positions over extended periods through Gate.com to benefit from potential ecosystem recovery and Metis Andromeda adoption growth
Cryptocurrency investment carries extreme risk. This report does not constitute investment advice. Investors should make decisions based on individual risk tolerance and consider consulting professional financial advisors. Never invest more than you can afford to lose.
FAQ
What are the main methods and tools for NETT price prediction?
Main methods include technical analysis, on-chain metrics analysis, and machine learning models. Key tools encompass price chart analysis platforms, trading volume tracking systems, sentiment analysis tools, and predictive algorithms based on historical data patterns and market indicators.
What are the core factors affecting NETT token price?
NETT token price is primarily influenced by market demand, token supply, network activity levels, and project development progress. Investor sentiment and overall market trends also play significant roles in price movements.
NETT has demonstrated strong market momentum with significant trading volume growth. The token shows promising fundamentals and adoption trends. Market analysts project substantial appreciation potential through 2026-2027, with long-term bullish sentiment supporting continued growth trajectory and increased ecosystem utility.
How to conduct technical and fundamental analysis of NETT price?
Technical analysis examines price charts, trading volume, and moving averages to identify trends. Fundamental analysis reviews NETT's project development, tokenomics, team strength, and market adoption. Combine both approaches for comprehensive price assessment.
What are the risks of NETT price prediction and what should investors pay attention to?
NETT price prediction involves high valuation and market sensitivity risks. High valuations leave little room for disappointment, while high market sensitivity means overall market downturns significantly impact prices. Investors should carefully assess individual risk tolerance before participating.
What are the price volatility characteristics of NETT compared to other cryptocurrencies?
NETT exhibits moderate volatility, lower than Bitcoin and Ethereum but higher than stablecoins. Its price movements are driven by market speculation and adoption rates, showing distinct fluctuation patterns within the broader crypto market landscape.
* The information is not intended to be and does not constitute financial advice or any other recommendation of any sort offered or endorsed by Gate.