# 2025 NUX Price Prediction: Expert Analysis and Market Forecast for the Coming Year
## Article Overview
This comprehensive analysis examines NUX (Peanut) token's price trajectory from 2026-2031, providing detailed forecasts for DeFi investors and protocol participants. The report evaluates NUX's market position, historical performance decline from $31 ATH to $0.002428, and projects base-case valuations reaching $0.00614 by 2031. Designed for beginners through institutional investors, this guide addresses liquidity constraints, regulatory uncertainties, and smart contract risks while offering actionable investment strategies through Gate's trading platform and the Peanut protocol's automated price-balancing mechanism for liquidity providers seeking impermanent loss protection.
Introduction: Market Position and Investment Value of NUX
Peanut (NUX) is an ERC20 token that powers the Peanut protocol, a DeFi price balancer designed to protect liquidity providers from impermanent losses while reducing slippage and enhancing profitability. Since its launch in 2021, NUX has established itself as a key utility token within the decentralized finance ecosystem. As of January 2026, NUX maintains a market capitalization of approximately $121,400 with a circulating supply of 50 million tokens, currently trading at $0.002428 per token.
The Peanut protocol represents an innovative approach to liquidity management, having been integrated into the Curve platform and operating across multiple DeFi platforms including Uniswap. By allocating 90% of liquidity provider assets to DEX positions and 10% to automated multi-level price balancing between DEX and CEX platforms, NUX has positioned itself as a practical solution for optimizing yield in decentralized finance.
This article will provide a comprehensive analysis of NUX's price trajectory from 2026 to 2031, examining historical price movements, market dynamics, ecosystem development, and broader macroeconomic factors to deliver professional price forecasts and actionable investment guidance for market participants interested in this emerging DeFi asset.
Peanut (NUX) Market Analysis Report
I. NUX Price History Review and Current Market Status
NUX Historical Price Evolution
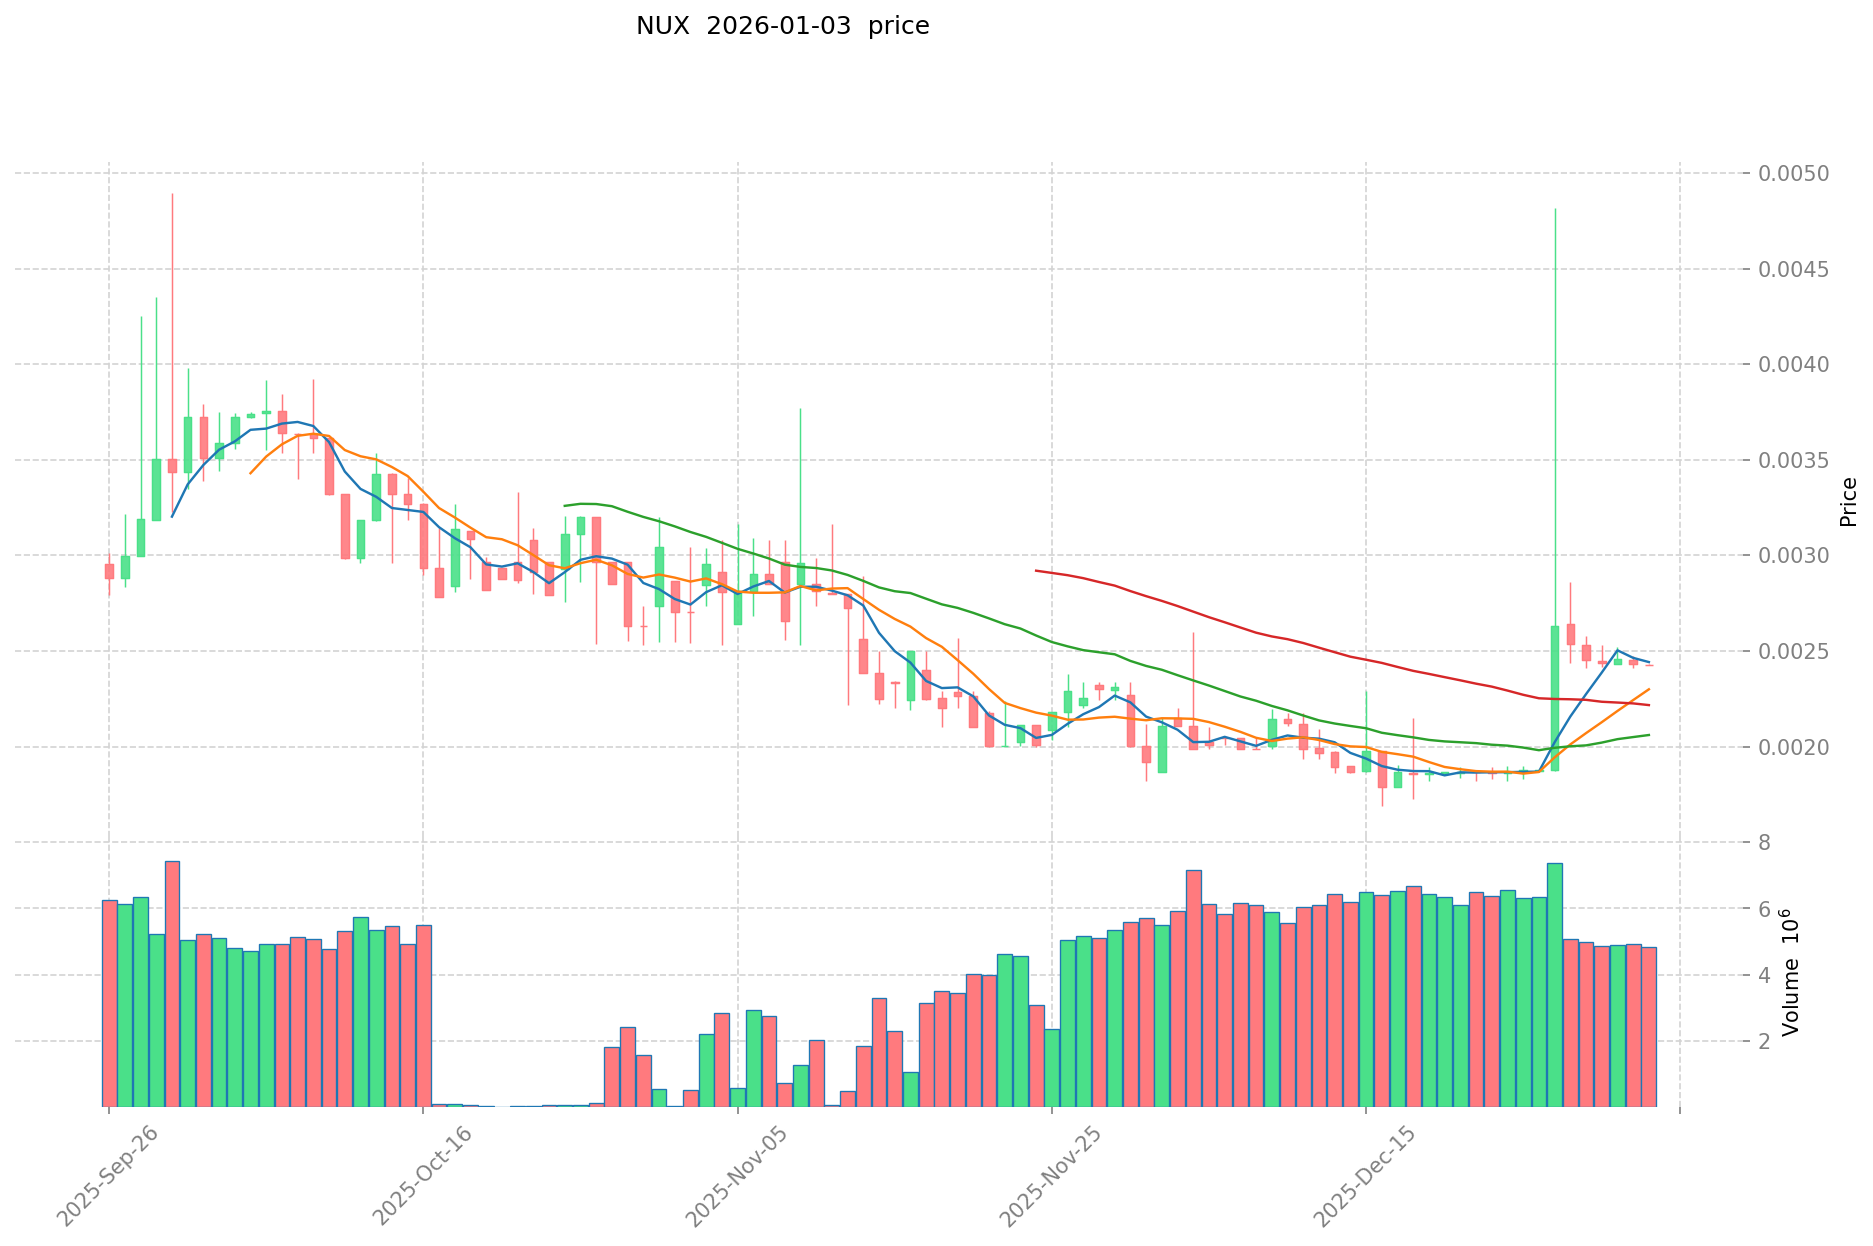
- February 2021: Project launch on Ethereum, NUX reached its all-time high of $31.00, marking the peak valuation period for the token.
- 2021-2025: Extended market contraction phase, with the token experiencing significant depreciation over the multi-year period, declining approximately 46.79% over the past year.
- December 2025: NUX reached its all-time low of $0.00172027, representing the lowest trading point in the token's history.
NUX Current Market Position
As of January 3, 2026, NUX is trading at $0.002428, with a 24-hour trading volume of $11,814.99. The token exhibits modest price movement over the past day with a 0% change. However, short-term momentum shows positive indicators: the token has gained 0.25% in the past hour and 29.49% over the past seven days, suggesting recent recovery momentum from its December lows.
The market capitalization stands at $121,400.00 with a fully diluted valuation matching this figure, as the circulating supply of 50,000,000 tokens equals the maximum supply, indicating complete token distribution. With 2,005 token holders and a dominance ratio of 0.0000037%, NUX maintains a minimal presence in the broader cryptocurrency market, ranking #4,686 by market capitalization. The token currently trades on a single exchange platform and maintains stability with minimal volatility between its 24-hour high of $0.002434 and low of $0.002428.
For current NUX market pricing, visit Gate.com
NUX Market Sentiment Index
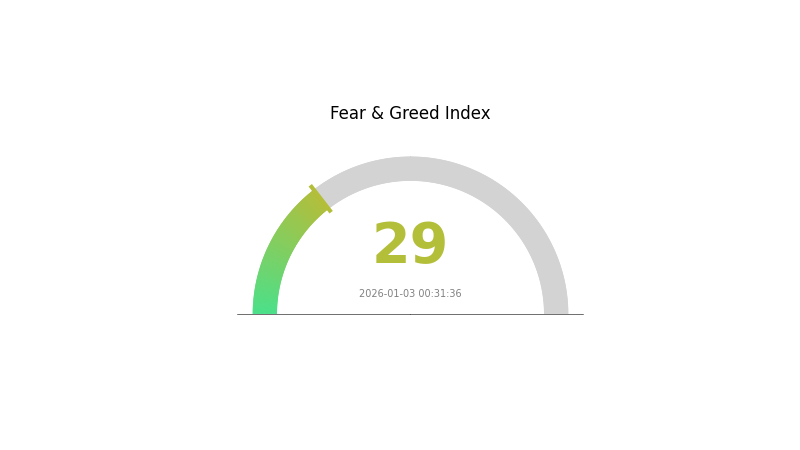
2026-01-03 Fear and Greed Index: 29 (Fear)
Click to view current Fear & Greed Index
The cryptocurrency market is currently experiencing a fear sentiment with an index reading of 29. This indicates heightened market anxiety and risk aversion among investors. During such periods, extreme fear often signals potential buying opportunities for long-term investors, as assets may be undervalued. However, traders should exercise caution and implement proper risk management strategies. Monitor market developments closely on Gate.com to identify optimal entry points and stay informed about cryptocurrency market trends during this volatile phase.
NUX Holdings Distribution
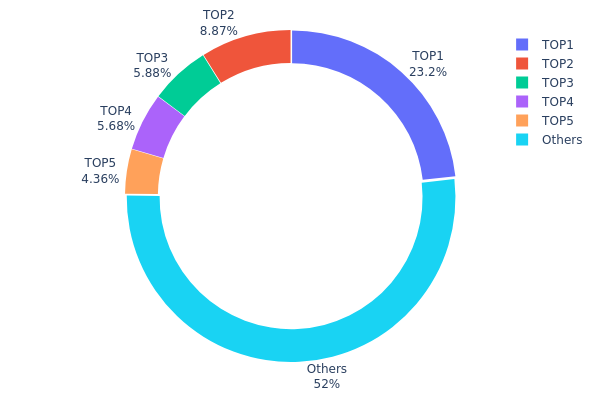
The address holdings distribution map represents the concentration of NUX tokens across the blockchain network, showing how token supply is distributed among different wallet addresses. This metric serves as a critical indicator for assessing the decentralization level, market structure, and potential vulnerability to price manipulation within the NUX ecosystem.
The current holdings data reveals a moderate concentration pattern with notable accumulation among the top addresses. The leading address (0x0d07...b492fe) commands 23.19% of total supply, while the top five addresses collectively hold 48.96% of all NUX tokens in circulation. This concentration level suggests that a relatively small number of stakeholders maintain significant control over token supply, which warrants attention regarding potential market influence. However, the fact that the remaining addresses account for 52.04% of holdings indicates that the majority of tokens are distributed across a broader network of participants, providing some counterbalance to top-holder concentration.
This distribution pattern reflects a market structure with meaningful decentralization but with identifiable key stakeholders. While the top-5 holders represent a substantial portion of the network's token supply, the majority stake remaining in dispersed hands reduces the likelihood of coordinated price manipulation by a single entity. The presence of multiple significant holders rather than extreme concentration in one or two addresses suggests a relatively stable on-chain structure, though continued monitoring of accumulation patterns among top addresses remains important for long-term market assessment.
Click to view current NUX holdings distribution
| Top |
Address |
Holding Qty |
Holding (%) |
| 1 |
0x0d07...b492fe |
11595.23K |
23.19% |
| 2 |
0x8305...358d52 |
4436.38K |
8.87% |
| 3 |
0x1b29...6e81c8 |
2942.46K |
5.88% |
| 4 |
0x948d...feca23 |
2838.74K |
5.67% |
| 5 |
0x84e0...d94e53 |
2179.49K |
4.35% |
| - |
Others |
26007.69K |
52.04% |
II. Core Factors Affecting NUX's Future Price
Supply Mechanism
-
Token Supply Cap: NUX's price will be influenced by market liquidity and on-chain activity levels. Supply constraints play a foundational role in price dynamics.
-
Current Impact: As an emerging DeFi protocol token, supply availability and distribution mechanisms directly affect market accessibility and valuation metrics.
Macroeconomic Environment
-
Monetary Policy Impact: Federal Reserve policy stance—whether accommodative or restrictive—directly influences global capital flow liquidity. Expansionary monetary conditions typically facilitate asset appreciation for cryptocurrencies and risk assets.
-
Market Sentiment: Price movements themselves drive market psychology. Broader cryptocurrency market downturns can suppress individual token valuations regardless of project fundamentals, while periods of renewed risk appetite can create favorable conditions for upside movement.
-
Global Capital Rotation: Cryptocurrency valuations respond to shifts in relative asset attractiveness. During periods of capital scarcity, investment concentrates in established assets; during liquidity expansion, capital disperses across emerging opportunities. Understanding these macroeconomic rotations is essential for predicting NUX price trajectories.
III. 2026-2031 NUX Price Forecast
2026 Outlook
- Conservative Forecast: $0.00146 - $0.00243
- Base Case Forecast: $0.00243
- Optimistic Forecast: $0.00348 (requiring sustained market interest and positive ecosystem developments)
2027-2029 Medium-term Outlook
- Market Stage Expectation: Gradual accumulation phase with increasing institutional participation and ecosystem expansion driving modest price appreciation.
- Price Range Forecast:
- 2027: $0.00183 - $0.00426 (21% upside potential)
- 2028: $0.00271 - $0.00451 (48% cumulative gains)
- 2029: $0.00349 - $0.00434 (67% cumulative gains)
- Key Catalysts: Protocol upgrades, increased adoption on Gate.com and other trading venues, strategic partnerships, and improved liquidity conditions driving stronger price discovery mechanisms.
2030-2031 Long-term Outlook
- Base Case Scenario: $0.00374 - $0.00563 (73% growth by 2030), representing sustained adoption and mainstream recognition within the digital asset market.
- Optimistic Scenario: $0.00452 - $0.00614 (102% growth by 2031), contingent upon breakthrough developments in technology integration and substantial expansion of use cases.
- Transformative Scenario: $0.00614+ (extreme favorable conditions), requiring fundamental shifts in market structure, regulatory clarity, and widespread institutional adoption across major platforms.
- 2031-12-31: NUX at $0.00614 (potential peak valuation), representing maturation of the project with significant market penetration and established utility.
| 年份 |
预测最高价 |
预测平均价格 |
预测最低价 |
涨跌幅 |
| 2026 |
0.00348 |
0.00243 |
0.00146 |
0 |
| 2027 |
0.00426 |
0.00296 |
0.00183 |
21 |
| 2028 |
0.00451 |
0.00361 |
0.00271 |
48 |
| 2029 |
0.00434 |
0.00406 |
0.00349 |
67 |
| 2030 |
0.00563 |
0.0042 |
0.00374 |
73 |
| 2031 |
0.00614 |
0.00492 |
0.00452 |
102 |
NUX (Peanut) Professional Investment Analysis Report
IV. NUX Professional Investment Strategy and Risk Management
NUX Investment Methodology
(1) Long-term Holding Strategy
- Suitable Investors: DeFi protocol participants and liquidity providers seeking consistent passive income through price balancing mechanisms
- Operation Recommendations:
- Accumulate NUX tokens during periods of price consolidation to participate in the Peanut protocol's liquidity provision ecosystem
- Stake NUX tokens in the protocol to enable the automated multi-level price balancing mechanism across DEX and CEX platforms
- Monitor fee accumulation from the 10% profit-taking mechanism to maximize compounding returns
(2) Active Trading Strategy
- Market Analysis Focus:
- Volume Analysis: Track the 24-hour trading volume ($11,814.99) to identify liquidity windows and optimal entry/exit points
- Price Action Monitoring: Observe support/resistance levels against the all-time low ($0.00172027) and recent consolidation ranges
- Wave Trading Key Points:
- Execute trades during high volatility periods, leveraging the token's 29.49% seven-day performance and 1-hour uptrend of 0.25%
- Implement dollar-cost averaging when price approaches historical support levels to reduce average acquisition cost
NUX Risk Management Framework
(1) Asset Allocation Principles
- Conservative Investors: 2-5% allocation maximum
- Active Investors: 5-10% allocation
- Professional Investors: 10-15% allocation with active rebalancing
(2) Risk Hedging Strategies
- Portfolio Diversification: Balance NUX holdings with other DeFi protocol tokens to reduce single-protocol risk exposure
- Position Sizing: Never allocate more than 15% of total crypto holdings to any single emerging protocol token
(3) Secure Storage Solutions
- Hot Wallet Option: Use Gate.com's Web3 wallet for active trading and protocol interaction with NUX tokens
- Cold Storage Approach: Store long-term NUX holdings in secure hardware-based solutions with multi-signature authorization
- Security Considerations: Enable two-factor authentication on all exchange accounts, regularly audit smart contract interactions, and maintain backup recovery phrases in secure offline locations
V. NUX Potential Risks and Challenges
NUX Market Risks
- Low Liquidity Risk: With only $11,814.99 in 24-hour volume and ranking 4686 by market cap, NUX faces significant liquidity constraints that could result in extreme slippage during large transactions
- High Volatility Exposure: The token has declined 46.79% over the past year and trades 99.99% below its all-time high of $31, indicating extreme price instability and potential capital erosion risk
- Limited Exchange Support: Trading on only one exchange restricts accessibility and increases counterparty risk concentration
NUX Regulatory Risks
- DeFi Protocol Uncertainty: Regulatory frameworks for price-balancing protocols remain unclear across major jurisdictions, potentially subjecting Peanut to future compliance requirements
- Token Classification Ambiguity: Regulatory authorities may classify NUX as a security, triggering compliance obligations that could impair protocol functionality
- Cross-Border Compliance: Operations bridging CEX and DEX platforms may face evolving regulatory scrutiny from financial authorities monitoring decentralized finance activities
NUX Technical Risks
- Algorithm Dependency: The entire protocol relies on the effectiveness of its automated price-balancing algorithm; algorithmic failures could result in significant losses for liquidity providers
- Smart Contract Vulnerability: As an ERC-20 token on Ethereum, NUX faces potential exposure to smart contract exploits and security vulnerabilities
- Integration Risk: Dependency on Curve and Uniswap integrations creates operational risks if these platforms experience technical issues or implement breaking changes
VI. Conclusion and Action Recommendations
NUX Investment Value Assessment
NUX represents a specialized DeFi utility token designed to facilitate Peanut's price-balancing protocol. While the underlying mechanism addresses legitimate issues in liquidity provision—specifically impermanent loss mitigation and slippage reduction—the token faces significant headwinds including extreme illiquidity, minimal trading volume, concentrated market-cap deployment, and severe year-over-year underperformance (-46.79%). The token's current valuation of $0.002428, representing a 99.99% decline from its $31 all-time high, indicates either fundamental protocol challenges or severe market adoption failures. Prospective investors should view NUX as a high-risk, speculative venture token rather than a stable protocol utility asset.
NUX Investment Recommendations
✅ Beginners: Avoid direct NUX investment; instead, gain DeFi exposure through established protocols with larger liquidity pools and clearer use cases before considering emerging solutions like Peanut.
✅ Experienced Investors: Limit NUX allocation to 2-5% of DeFi-focused portfolios only if fundamentally aligned with Peanut's protocol mission; conduct thorough due diligence on algorithm effectiveness and protocol security audits before commitment.
✅ Institutional Investors: Conduct comprehensive smart contract audits, verify regulatory compliance across target jurisdictions, and establish clear exit strategies given the token's illiquidity profile before any institutional deployment.
NUX Trading Participation Methods
- Gate.com Trading: Access NUX trading directly through Gate.com's spot trading interface to execute market orders, limit orders, and monitor real-time price movements
- Protocol Interaction: Deposit NUX tokens directly into the Peanut protocol to participate in liquidity provision and earn passive income from the 10% profit-fee mechanism
- Liquidity Mining: Consider contributing NUX alongside other assets to liquidity pools on supported platforms, though evaluate yield sustainability against impermanent loss exposure
Cryptocurrency investment carries extreme risk and potential for total capital loss. This report is provided for informational purposes only and does not constitute financial advice. Investors must independently evaluate NUX based on their personal risk tolerance, investment objectives, and financial circumstances. Always consult with qualified financial advisors before making investment decisions. Never invest more capital than you can afford to lose completely.
FAQ
What is the NUX token price prediction for 2024?
Based on historical trends and market analysis, NUX token was projected to range between $0.0020-$0.0035 in 2024. However, actual performance depends on market conditions, adoption rates, and overall crypto market sentiment.
What are the main factors affecting NUX price?
NUX price is primarily influenced by market demand, trading volume, tokenomics supply dynamics, broader crypto market sentiment, and platform adoption rates. Increased demand and reduced supply typically drive price appreciation.
NUX项目的基本面和发展前景如何?
NUX is a blockchain-based digital currency with secure and transparent transaction records. The project demonstrates strong fundamentals with increasing market demand. NUX's future outlook is positive, with potential for enhanced technology adoption and expanding use cases in the decentralized ecosystem.
How to conduct NUX price technical analysis and trend prediction?
Analyze NUX using chart patterns and technical indicators like moving averages and RSI. 4-hour signals suggest buying opportunity, while weekly shows selling pressure. Monitor trading volume and support/resistance levels for trend confirmation. Current price at $0.002468 with market cap of $123,375.77.
What are NUX's advantages and disadvantages compared to other similar tokens?
NUX offers strong decentralization and oracle integration capabilities. Advantages include innovative data solutions and community governance. Disadvantages are relatively lower trading volume and newer market presence compared to established alternatives, requiring time to build broader adoption.
What risks should I consider when investing in NUX tokens?
NUX token investments involve market volatility, platform security risks, and regulatory uncertainty. As an emerging DeFi protocol, prices fluctuate significantly. Ensure you understand smart contract risks and only invest what you can afford to lose.
* The information is not intended to be and does not constitute financial advice or any other recommendation of any sort offered or endorsed by Gate.