KYO vs ARB: A Comprehensive Comparison of Two Leading Cryptocurrency Tokens

2025-12-26 06:11:43
Altcoins
Crypto Trading
DeFi
Investing In Crypto
Layer 2
Article Rating : 4.5
half-star
73 ratings
This article offers a comprehensive comparison of KYO and ARB, two major cryptocurrency tokens, analyzing their investment potential in terms of market performance, application scenarios, price trends, and supply mechanisms. It addresses crucial investor queries such as market status, investment strategies, and risk assessments, catering to both new and seasoned investors looking to balance portfolio choices. Readers can explore historical price trends, tokenomics, and market sentiment, while gaining insights on short and long-term price predictions. Key considerations are made regarding KYO's growth potential and ARB's stability and ecosystem maturity.
KYO vs ARB: A Comprehensive Comparison of Two Leading Cryptocurrency Tokens

Introduction: KYO vs ARB Investment Comparison

In the cryptocurrency market, the comparison between KYO and ARB has become an important consideration for investors. The two assets demonstrate significant differences in market capitalization ranking, application scenarios, and price performance, representing distinct positioning within the crypto ecosystem.

KYO (Kyo Finance): Kyo is a comprehensive liquidity technology platform that connects multiple blockchain ecosystems through cross-chain aggregation settlement technology and provides advanced decentralized exchange (DEX) experiences with white-label solutions. The platform has received investment support from Startale, Soneium Spark Fund, TBV, BuzzBridge Capital, and Castrum Capital.

ARB (Arbitrum): Arbitrum is a technology suite designed to scale Ethereum. Built as an Optimistic rollup protocol that inherits Ethereum-level security, it enables users to perform all Ethereum operations—use Web3 applications, deploy smart contracts, and more—while achieving faster and cheaper transactions.

This article will comprehensively analyze the investment value comparison between KYO and ARB through the following dimensions: historical price trends, supply mechanisms, market positioning, technological ecosystem, and market performance metrics, addressing the key question investors face:

"Which is the better choice for your portfolio?"

I. Price History Comparison and Market Status

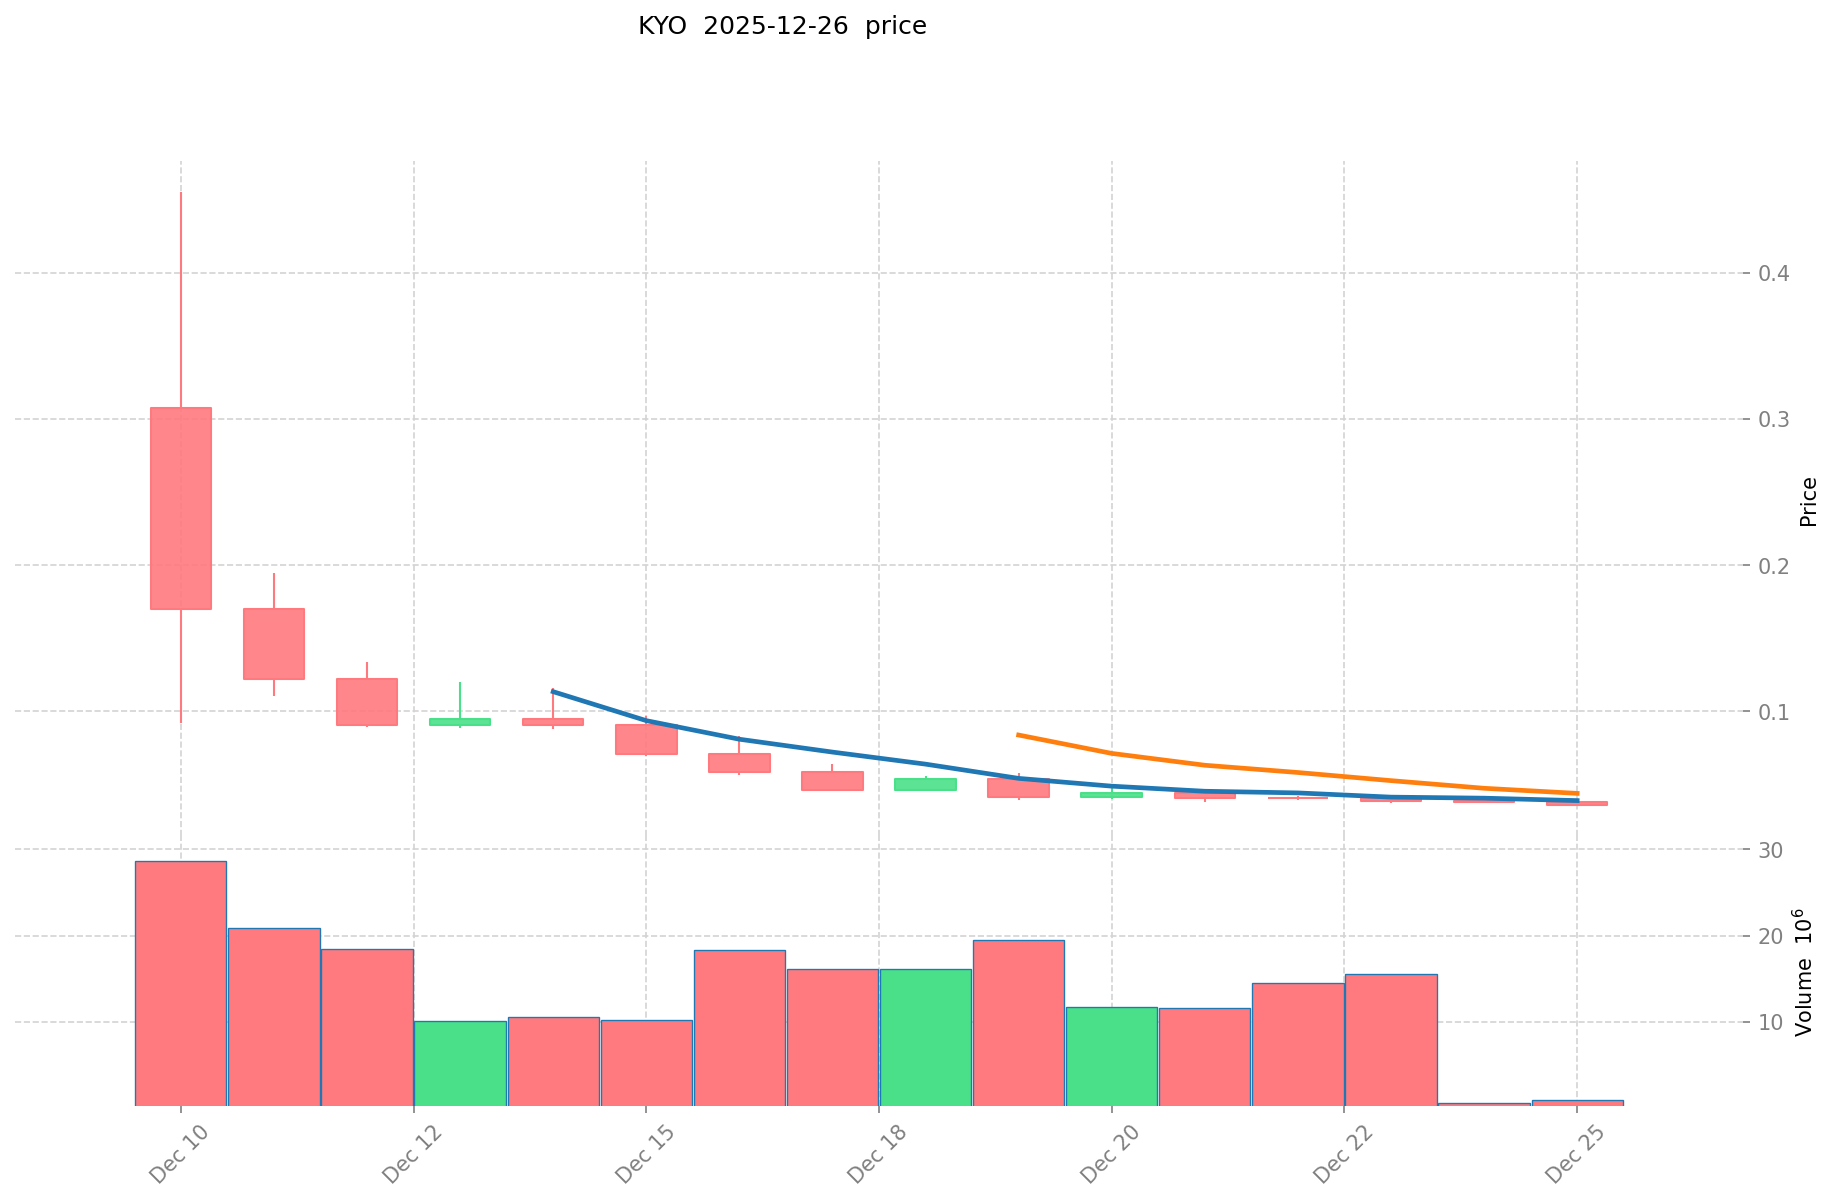
  • December 2025: KYO experienced a significant decline, with price falling from $0.4552 (all-time high on December 10) to $0.03459 (all-time low on December 26), representing a -92.41% loss within the month.
  • January 2024 - Present: ARB peaked at $2.39 on January 12, 2024, and has declined to $0.1928 as of December 26, 2025, marking a -76.09% loss over the past year.
  • Comparative Analysis: In the current market cycle, KYO has experienced a more severe correction from its peak, losing over 92% of its value in approximately 16 days, while ARB, having launched earlier (March 2023), shows a longer-term downtrend of 76% annually, indicating higher volatility for KYO in recent periods.

Current Market Status (2025-12-26)

  • KYO current price: $0.03459
  • ARB current price: $0.1928
  • 24-hour trading volume: KYO $33,988.61 vs ARB $1,568,739.46
  • Market sentiment index (Fear & Greed Index): 20 (Extreme Fear)

Click to view real-time prices:

price_image1 price_image2

二、影响 KYO vs ARB 投资价值的核心因素

供应机制对比(Tokenomics)

Based on the reference materials provided, specific tokenomics information for KYO is not available. However, the materials indicate that ARB has scheduled token unlock events that may impact supply dynamics and market value.

  • ARB: Scheduled to unlock approximately 92.65 million tokens, representing 2.56% of current circulating supply, valued at approximately $49.4 million.

  • 📌 Market Impact: Token unlock events can create supply pressure and influence price dynamics during release periods.

机构采用与市场应用

  • 机构持仓: The reference materials indicate that KYO is positioned within the Soneium ecosystem with significant partnership standing. ARB maintains institutional interest through various trading platforms and investment narratives.

  • 企业采用: Both projects operate within different blockchain ecosystems. KYO is integrated into Soneium infrastructure, while ARB functions within the Arbitrum Layer 2 ecosystem. The choice between them depends on users' specific needs within their respective network environments.

  • 国家政策: The reference materials do not provide specific information regarding differing regulatory treatment between KYO and ARB across different jurisdictions.

技术发展与生态建设

The reference materials provided do not contain detailed information regarding specific technical upgrades, development roadmaps, or ecosystem comparisons between KYO and ARB at this time.

宏观经济与市场周期

The reference materials do not provide sufficient information to establish comparative analysis regarding macroeconomic impacts, inflation resistance, or monetary policy effects on KYO versus ARB investment values.

III. 2025-2030 Year Price Prediction: KYO vs ARB

Short-term Prediction (2025)

  • KYO: Conservative $0.03013-$0.03463 | Optimistic $0.04121
  • ARB: Conservative $0.11568-$0.1928 | Optimistic $0.235216

Mid-term Prediction (2027-2028)

  • KYO may enter growth consolidation phase, expected price range $0.02396-$0.06781
  • ARB may enter moderate bull phase, expected price range $0.12388-$0.33185
  • Key drivers: institutional capital inflows, ETF approvals, ecosystem development expansion

Long-term Prediction (2030)

  • KYO: Base case $0.06055-$0.06555 | Optimistic scenario $0.08128
  • ARB: Base case $0.29651-$0.35724 | Optimistic scenario $0.40011

View KYO and ARB detailed price predictions

KYO:

年份 预测最高价 预测平均价格 预测最低价 涨跌幅
2025 0.0412097 0.03463 0.0301281 0
2026 0.0542253855 0.03791985 0.025027101 9
2027 0.0566693198325 0.04607261775 0.02395776123 33
2028 0.06780967880445 0.05137096879125 0.04726129128795 48
2029 0.07150838855742 0.05959032379785 0.039925516944559 72
2030 0.081281201660267 0.065549356177635 0.060305407683424 89

ARB:

年份 预测最高价 预测平均价格 预测最低价 涨跌幅
2025 0.235216 0.1928 0.11568 0
2026 0.27179016 0.214008 0.20758776 11
2027 0.2599020156 0.24289908 0.1238785308 25
2028 0.331848723096 0.2514005478 0.140784306768 30
2029 0.4228557213996 0.291624635448 0.218718476586 51
2030 0.400108999834656 0.3572401784238 0.296509348091754 85

四、投资策略对比:KYO vs ARB

长期 vs 短期投资策略

  • KYO:适合关注新兴生态平台、寻求高成长潜力的投资者。Kyo Finance 作为跨链流动性聚合平台,其长期价值取决于 Soneium 生态的发展和跨链应用的市场需求。短期内面临较大波动风险,需要高风险承受能力

  • ARB:适合寻求相对稳定、已验证应用场景的投资者。Arbitrum 作为成熟的以太坊 Layer 2 解决方案,已建立完整的生态应用和用户基础,更适合中长期布局和生态应用参与者

风险管理与资产配置

  • 保守型投资者:KYO 5%-10% vs ARB 15%-20%(推荐以 ARB 为主,辅以少量 KYO 作为高风险敞口)

  • 激进型投资者:KYO 20%-30% vs ARB 15%-25%(可增加 KYO 配置以获取潜在高收益,同时保持 ARB 作为生态基础敞口)

  • 对冲工具:通过稳定币配置降低波动风险;利用期权工具对冲 KYO 的极端波动风险;建立跨币种组合以分散单一资产风险

五、潜在风险对比

市场风险

  • KYO:极高的价格波动性(12月内下跌 92.41%),流动性相对较低(日交易量 $33,988.61),面临"流动性陷阱"风险;新项目的市场认知度不足,存在高度的价格发现风险

  • ARB:虽然年度跌幅为 76.09%,但交易深度更充分(日交易量 $1,568,739.46),市场风险相对可控;代币解锁事件(92.65 万枚 ARB)可能造成短期供应压力

技术风险

  • KYO:作为跨链聚合平台,存在跨链桥接的安全隐患;白标 DEX 解决方案的智能合约风险需要持续审计和监控;生态集中度风险(主要依赖 Soneium 生态发展)

  • ARB:Optimistic Rollup 机制中欺诈证明的时间延迟风险;以太坊主网风险的继承;Layer 2 标准化缺失导致的生态割裂风险

监管风险

  • 全球监管环保对两者均存在不确定性,但 ARB 作为以太坊生态的重要组成部分,监管友好度可能相对更高

  • KYO 作为跨链平台,面临多链监管协调的复杂性风险

六、结论:Which Is the Better Buy?

📌 投资价值总结:

  • KYO 优势:处于极低价格区间($0.03459),具有极高的潜在上涨空间;跨链流动性聚合赛道具有战略意义;获得多家知名资本支持,显示机构看好;预测到 2030 年可达 $0.08128(乐观情景),涨幅潜力达 135%

  • ARB 优势:已建立成熟的 Layer 2 生态和用户基础;交易流动性充分,风险更可控;技术方案经过市场验证,安全性相对较高;预测到 2030 年可达 $0.40011(乐观情景),绝对价格增长空间大;作为以太坊官方认可的扩容方案,生态地位稳固

✅ 投资建议:

  • 新手投资者:优先选择 ARB,原因是市场认知度高、流动性充分、技术风险相对可控,便于学习和实践。初期配置比例建议 80% ARB + 20% 稳定币,待经验积累后可适度增加高风险资产敞口

  • 有经验投资者:可建立 KYO 与 ARB 的组合配置(如 30% KYO + 50% ARB + 20% 稳定币),充分利用 KYO 的高成长潜力同时通过 ARB 进行风险对冲;定期监控代币解锁事件和生态进展,动态调整仓位

  • 机构投资者:应关注 ARB 的生态投资和应用布局机会,通过参与生态建设获得超额收益;对 KYO 可建立小规模战略持仓(2%-5%),跟踪 Soneium 生态发展,待验证团队执行力后适度增加敞口

⚠️ 风险提示:加密货币市场波动性极高,参考资料中的价格预测基于历史数据和模型推测,不代表未来必然走势。本文不构成投资建议,投资者应根据自身风险承受能力、投资期限和财务状况独立决策。建议在投资前进行充分的尽职调查和风险评估。

FAQ

KYO和ARB分别是什么?各自有什么主要用途?

KYO是Kyoko生态代币,主要用于平台治理和交易激励。ARB是Arbitrum网络的治理代币,用于协议决策和生态激励,驱动Layer2扩展应用。

KYO和ARB在技术架构上有什么区别?

KYO采用京都协议机制(CDM),专注碳信用额度交易。ARB则基于以太坊智能合约,提供去中心化碳资产管理和交易。两者在结算方式、交易效率和透明度上存在显著差异。

KYO和ARB的市场表现和流动性如何对比?

ARB作为主流项目,流动性充足,市场表现相对稳定。KYO流动性较弱,市场表现波动性较大,但社区热度较高,未来发展空间值得关注。

投资KYO和ARB各自需要注意什么风险?

KYO和ARB投资需关注代币解锁风险、市场流动性波动及价格下跌风险。ARB尤其面临解锁期间的价格压力,可能出现显著波动。投资者应密切关注市场动态及流动性变化。

KYO和ARB在生态应用和生态规模上有什么差异?

ARB生态应用更广泛,已集成数百个DeFi、NFT等协议,日交易额远超KYO。ARB作为Arbitrum主网代币,生态规模庞大且持续扩张,而KYO生态应用相对集中,规模较小。

从长期投资角度看,KYO和ARB哪个更有潜力?

KYO作为新上线潜力代币,具有早期增长机遇;ARB已建立稳定市场地位。长期潜力取决于生态发展和市场表现,KYO的新币红利更具吸引力。

* The information is not intended to be and does not constitute financial advice or any other recommendation of any sort offered or endorsed by Gate.
Related Articles
CRO vs DYDX: Comparing Two Leading Crypto Exchanges for Optimal Trading Experience

CRO vs DYDX: Comparing Two Leading Crypto Exchanges for Optimal Trading Experience

The article "CRO vs DYDX: Comparing Two Leading Crypto Exchanges for Optimal Trading Experience" presents a thorough analysis comparing Cronos (CRO) and dYdX (DYDX) from an investment perspective. It covers their historical price trends, current market status, supply mechanisms, institutional adoption, technological ecosystems, and potential risks. Suitable for investors uncertain about which token to choose, it addresses questions regarding historical performance, price predictions, and investment strategies. Offering insights into risk management, market cycles, and regulatory implications, the article is essential for both new and experienced investors seeking to optimize their crypto portfolio with CRO and DYDX.
2025-10-15 03:57:34
NETT vs RUNE: Comparing Two Leading Edge Technologies in Network Security

NETT vs RUNE: Comparing Two Leading Edge Technologies in Network Security

This article offers a detailed comparison between NETT and RUNE, two leading technologies in network security. It aims to provide investors with insights into historical price trends, key factors influencing investment value, and strategic portfolio allocation options. Suitable for both new and experienced investors, the content explores network stability, regulatory risks, and potential opportunities. The article concludes by addressing which coin might be a stronger investment, emphasizing growth potential on Layer 2 for NETT and cross-chain liquidity strengths for RUNE. Read more for strategic investment insights on Gate.
2025-10-31 11:12:06
Is Dfyn Network (DFYN) a good investment?: A Comprehensive Analysis of Features, Risks, and Market Potential

Is Dfyn Network (DFYN) a good investment?: A Comprehensive Analysis of Features, Risks, and Market Potential

# Is Dfyn Network (DFYN) a Good Investment? A Comprehensive Analysis This in-depth report evaluates whether DFYN represents a viable investment opportunity by analyzing its market position, technology infrastructure, tokenomics, and risk factors. The analysis addresses key investor concerns: Is DFYN worth buying given its 99.98% decline from all-time highs? What are the realistic growth prospects through 2030? What risk management strategies apply to this micro-cap asset? Structured across six major sections—price history, project overview, token economics, market performance, investment forecasts, and risk assessment—this guide serves beginners seeking foundational knowledge, experienced traders evaluating speculative positions, and institutions assessing multi-chain DEX exposure. The report combines historical performance data, technical metrics from Gate, and forward-looking scenarios to provide informed investment reference points for cryptocurrency portfolios.
2025-12-30 14:22:38
2025 CLEAR Price Prediction: Expert Analysis and Market Forecast for the Upcoming Year

2025 CLEAR Price Prediction: Expert Analysis and Market Forecast for the Upcoming Year

# Article Overview: 2025 CLEAR Price Prediction: Expert Analysis and Market Forecast This comprehensive analysis examines Everclear (CLEAR), a Layer 2 clearing infrastructure token, delivering professional price forecasts and investment strategies for 2025-2030. The report addresses critical investor needs: understanding CLEAR's market position, evaluating price trajectories, and implementing risk-managed trading approaches. The article systematically covers historical price evolution (96.77% decline from January peak), current market dynamics with $747,891 market cap, and tiered price predictions ranging from $0.00214-$0.00928 across five-year horizons. Tailored for beginners, experienced traders, and institutional investors, it provides actionable Gate trading strategies, comprehensive risk management frameworks, and detailed exposure to emerging chain abstraction infrastructure opportunities in cryptocurrency markets.
2025-12-28 08:31:20
KAT vs OP: A Comprehensive Comparison of Two Leading Trading Platforms

KAT vs OP: A Comprehensive Comparison of Two Leading Trading Platforms

# KAT vs OP: A Comprehensive Comparison of Two Leading Trading Platforms This article delivers an in-depth investment analysis comparing Karat Token (KAT), a Web3 data privacy asset, with Optimism (OP), Ethereum's leading Layer 2 scaling solution. It addresses critical investor questions about market positioning, price performance, and portfolio allocation strategies across both tokens. The guide examines historical price trends, tokenomics, ecosystem adoption, and technical development to determine optimal investment opportunities. Structured through market analysis, price projections (2025-2030), risk assessment, and strategic recommendations, this resource serves beginner, experienced, and institutional investors seeking clarity on KAT vs OP investments. View real-time prices and trading data on Gate for informed decision-making.
2025-12-29 04:14:42
SLN vs LRC: A Comprehensive Comparison of Two Leading Blockchain Token Standards

SLN vs LRC: A Comprehensive Comparison of Two Leading Blockchain Token Standards

# Article Overview: SLN vs LRC Comprehensive Comparison This comprehensive guide compares two distinct blockchain tokens—**SLN (Smart Layer Network)** and **LRC (Loopring)**—analyzing their investment potential across historical performance, tokenomics, market adoption, and technical ecosystems. The article addresses critical questions for both beginner and experienced crypto investors: Which token offers better value, and how should portfolio allocation differ based on risk tolerance? By examining price trajectories, liquidity metrics on Gate, and 2026-2031 price forecasts, this analysis equips investors with data-driven insights to make informed decisions. Structured through market status assessment, risk evaluation, and tailored investment strategies, the content serves investors seeking clarity on emerging token standards versus established DeFi protocols in volatile market conditions. --- **Key Sections:** Historical price comparison | Tokenomics analysis | Market liquidity | Risk assessment | Investm
2026-01-01 14:11:44
Recommended for You
In-Depth Analysis of Blockchain Hashing: How Hash Functions Impact Security and Price Trends

In-Depth Analysis of Blockchain Hashing: How Hash Functions Impact Security and Price Trends

The system analyzes the technical principles of Hash in Blockchain, the latest industry trends, and changes in computing power, discussing how the blockchain hash mechanism affects network security, the mining ecosystem, and cryptocurrency price trends.
2026-01-04 05:28:57
Best Crypto Wallets in Nigeria 2025: Is Gate Wallet the Best Choice?

Best Crypto Wallets in Nigeria 2025: Is Gate Wallet the Best Choice?

In-depth review of the best crypto wallet in Nigeria for 2025, focusing on the security, Web3 features, and multi-chain support of Gate Wallet, helping you determine if it is the best crypto wallet in Nigeria.
2026-01-04 05:27:15
Openverse Network (BTG) Comprehensive Analysis: Gate Listing, Price Dynamics, and Investment Opportunities

Openverse Network (BTG) Comprehensive Analysis: Gate Listing, Price Dynamics, and Investment Opportunities

In-depth interpretation of the significance of Openverse Network (BTG) launching on Gate exchange, the latest price dynamics of BTG, and the core technology of the project. This article analyzes the characteristics of Layer 0 networks, strategic financing, community activities, and market trends, providing comprehensive reference for investors.
2026-01-04 05:24:59
Stablecoin vs Bitcoin: From Payment Tools to Stores of Value — Two Development Paths of Crypto Assets

Stablecoin vs Bitcoin: From Payment Tools to Stores of Value — Two Development Paths of Crypto Assets

Stablecoin vs Bitcoin Comprehensive Analysis: Combining the latest market trends, this discussion explores the role of stablecoins in payments and liquidity, as well as the advantages and risks of Bitcoin as a long-term value asset, helping investors make rational judgments.
2026-01-04 05:23:47
ApeChain’s Ecosystem Value and APE Price Trends: A Panoramic View of Web3 Application Development

ApeChain’s Ecosystem Value and APE Price Trends: A Panoramic View of Web3 Application Development

In-depth analysis of the role and significance of ApeChain in the Web3 ecosystem, exploring its impact on the price trends of ApeCoin (APE), and assessing future opportunities and challenges for ecosystem development.
2026-01-04 05:18:39
What is NEAR Protocol's current market cap, trading volume, and supply in 2026?

What is NEAR Protocol's current market cap, trading volume, and supply in 2026?

# Article Introduction **NEAR Protocol Market Metrics & Trading Dynamics in 2026** This comprehensive guide examines NEAR Protocol's current market position with a $1.86 billion market cap, ranking #38 globally, and trading at $1.60 per token as of January 2026. The article provides essential cryptocurrency investors and traders with real-time market data, including the 1.28 billion circulating NEAR tokens and dynamic 24-hour trading volumes across major exchanges including Gate. Readers will discover how NEAR's scalability features and ecosystem development drive trading momentum, understand liquidity dynamics supporting price stability, and learn key investment considerations. Whether you're evaluating NEAR's competitive advantages against Ethereum and Solana or assessing token supply fundamentals, this resource delivers actionable market intelligence for informed trading decisions on Gate and other platforms.
2026-01-04 05:17:44