Bitcoin Price Hovers Below $120,000: Diverging Capital Flows Signal Bull Continuation or Imminent Correction?

Last Updated 2026-04-03 20:52:30
Reading Time: 1m
Bitcoin’s price remains stalled below $120,000, currently consolidating around $117,700. With bulls and bears locked in a tug-of-war, technical indicators and ETF data are producing conflicting signals. Key levels that will determine the short-term trend have now come into focus.

Latest Price Trends and Market Structure


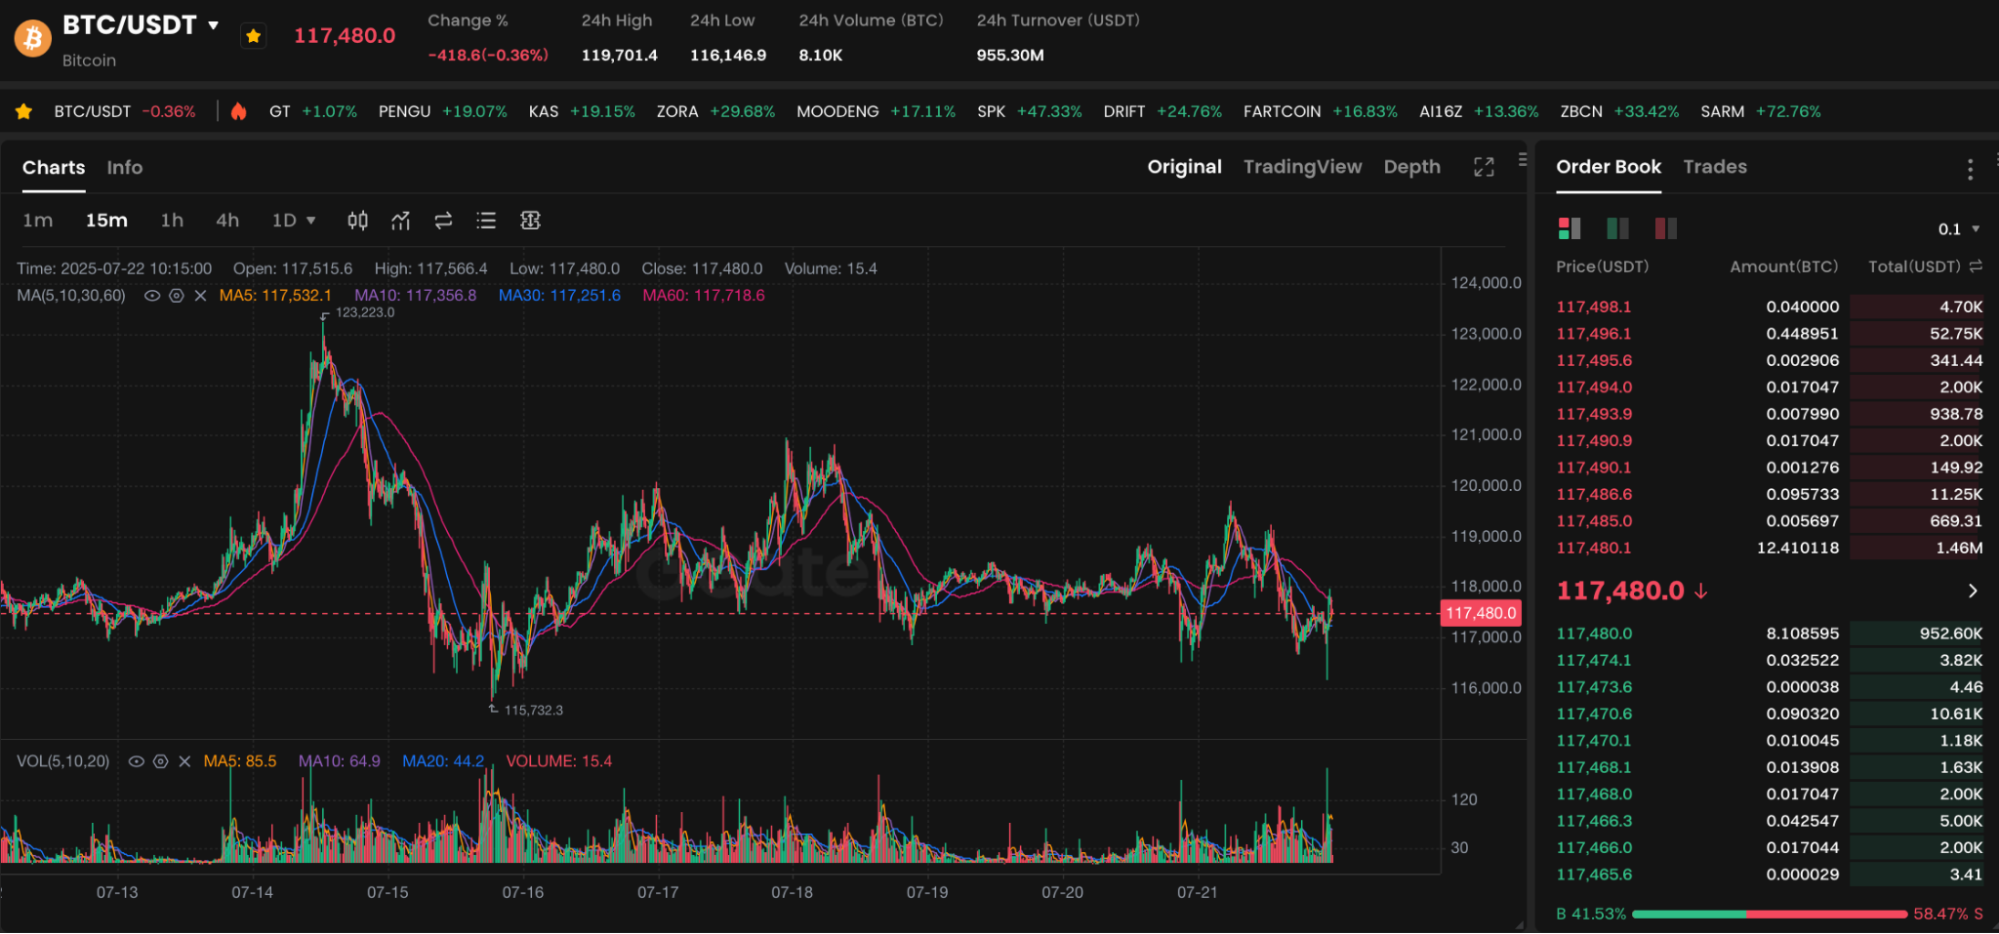
Chart: https://www.gate.com/trade/BTC_USDT

In the past two weeks, Bitcoin has attempted multiple times to break through the $120,000 threshold, but as of today, has again failed to do so. Currently, BTC is trading in a consolidation range between $117,700 and $118,500. Over the last 24 hours, BTC reached a high of $119,524 and a low of $116,767. This highlights sustained buying interest around the $116,000 level.

Meanwhile, both Ethereum and XRP continue to show strong performance, with ETH trading at $3,787 and XRP trading at $3.55. Short-term capital is increasingly flowing into these altcoins.

ETF Inflows Hit Record Highs: Bullish Sentiment Persists

The latest ETF disclosure data shows spot Bitcoin ETFs have seen cumulative net inflows of $239 million this week, marking the sixth straight week of positive inflows and underscoring continued strong institutional bullish sentiment.

BlackRock and Fidelity products continue to lead in net inflows, pointing to the steady participation of traditional financial institutions. Furthermore, recent U.S. Congressional activity around crypto regulation—such as the GENIUS Act—indicates a neutral to bullish outlook, laying the groundwork for future compliant crypto products.

However, despite robust ETF inflows, Bitcoin’s price keeps hitting resistance. This indicates that while buyer demand remains firm, active selling is equally significant, reflecting a structural tug-of-war in the market.

Technical Analysis: Watch for False Breakouts

From a technical perspective:

  • The RSI is near 66, remaining in bullish territory, but has failed to set new highs for two consecutive days.
  • The MACD histogram is narrowing, indicating waning short-term momentum.
  • The daily 10-day and 20-day moving averages are poised to form a death cross; without a swift rebound, a short-term price correction is possible.

The critical resistance remains $120,000. A breakout above this level could open up room toward $123,000 or even $125,000. Conversely, a dip below $116,000 may trigger a rapid pullback toward $113,500. The 50-day moving average support sits at $110,300.

Is the Bull Market Structure at Risk?

While the broader bull market structure is intact, short-term market confidence is under pressure. Key factors for investors to consider include:

  1. Profit-taking pressure: Many 2024 entrants are sitting on gains exceeding 50%, increasing the urge to book profits.
  2. Upcoming Fed meeting: If inflation data rises and the Fed adopts a hawkish tone, Bitcoin may come under pressure.
  3. Altcoin capital rotation: ETH and XRP are attracting new inflows, which results in a short-term shift away from Bitcoin.

Strategic Guidance for Investors

  • If BTC pulls back to the $116,000–$117,000 zone and holds support, this likely signals a consolidation phase within the uptrend.
  • If BTC breaks above $120,000, consider opening a modest long position with a clear take profit target.
  • If BTC closes below $116,000 for several sessions in a row, consider reducing exposure. Alternatively, shift to a wait-and-see approach to manage risk.

Conclusion

Bitcoin’s failure to surpass $120,000 signals the market has not yet achieved a decisive breakout. While favorable factors such as ETF growth remain in place, short-term capital flows are diverging. Investors should exercise heightened caution and adjust their strategies dynamically. They should integrate both technical indicators and macroeconomic data.

Author: Max
Disclaimer
* The information is not intended to be and does not constitute financial advice or any other recommendation of any sort offered or endorsed by Gate.
* This article may not be reproduced, transmitted or copied without referencing Gate. Contravention is an infringement of Copyright Act and may be subject to legal action.

Related Articles

What is Fartcoin? All You Need to Know About FARTCOIN
Intermediate

What is Fartcoin? All You Need to Know About FARTCOIN

Fartcoin (FARTCOIN) is a representative meme coin within the Solana ecosystem based on an AI-driven narrative. Its core concept originated from an experiment aimed at exploring the "boundaries between AI Agents and humor." More than just a digital asset with social attributes, the project deeply couples absurd humor culture with on-chain financial logic by integrating autonomous AI interaction models.
2026-04-04 22:01:19
Gold Price Forecast for the Next Five Years: 2026–2030 Trend Outlook and Investment Implications, Could It Reach $6,000?
Beginner

Gold Price Forecast for the Next Five Years: 2026–2030 Trend Outlook and Investment Implications, Could It Reach $6,000?

Analyze current gold price trends alongside authoritative five-year forecasts, integrating an evaluation of market risks and opportunities. This gives investors insight into the potential trajectory of gold prices and the main drivers expected to shape the market over the next five years.
2026-03-25 18:13:30
Aster vs Hyperliquid: Which Perp DEX Will Prevail?
Beginner

Aster vs Hyperliquid: Which Perp DEX Will Prevail?

Aster and Hyperliquid are the two representative protocols of the "purpose-built L1 path" within the current decentralized perpetual exchange (Perp DEX) sector. As a pioneer in the field, Hyperliquid has built a deep liquidity moat through its highly mature order book architecture and strong community consensus. Conversely, Aster, as a rising challenger, seeks to leapfrog the competition in high-performance trading through more aggressive multi-chain aggregation logic, private transaction modules, and an underlying execution environment optimized for 2026 market demands.
2026-03-24 11:58:33
2026 Silver Price Forecast: Bull Market Continuation or High-Level Pullback? In-Depth Analysis of Silver Candlestick Chart
Beginner

2026 Silver Price Forecast: Bull Market Continuation or High-Level Pullback? In-Depth Analysis of Silver Candlestick Chart

2026 Silver Price Forecast: Latest Outlook This article integrates current market trends, silver candlestick chart analysis, and momentum factors to assess the potential key support and resistance levels, upside targets, and pullback risks for silver prices. The goal is to help investors make informed, rational decisions.
2026-03-25 16:08:59
Crypto Future Profit Calculator: How to Calculate Your Potential Gains
Beginner

Crypto Future Profit Calculator: How to Calculate Your Potential Gains

Crypto Future Profit Calculator helps traders estimate potential earnings from futures contracts by considering entry price, leverage, fees, and market movement.
2026-04-03 23:27:09
What is Oasis Network (ROSE)?
Beginner

What is Oasis Network (ROSE)?

The Oasis Network is driving the development of Web3 and AI through smart privacy technology. With its privacy protection, high scalability, and cross-chain interoperability, the Oasis Network is providing new possibilities for the future development of decentralized applications.
2026-03-31 12:59:38