Axie Infinity (AXS) has witnessed a strong breakout in daily trading volume yesterday, Sunday, August 31st. The reason for this movement comes from a sudden surge in trading of many popular altcoins such as Ethereum (ETH) and XRP on South Korean exchanges, notably Upbit and Bithumb.
In fact, AXS recorded a trading volume of up to 423 million USD on August 31, nearly 15 times higher than the average of about 30 million USD in the previous week.
Volume increased significantly but not enough for AXS to establish a trend
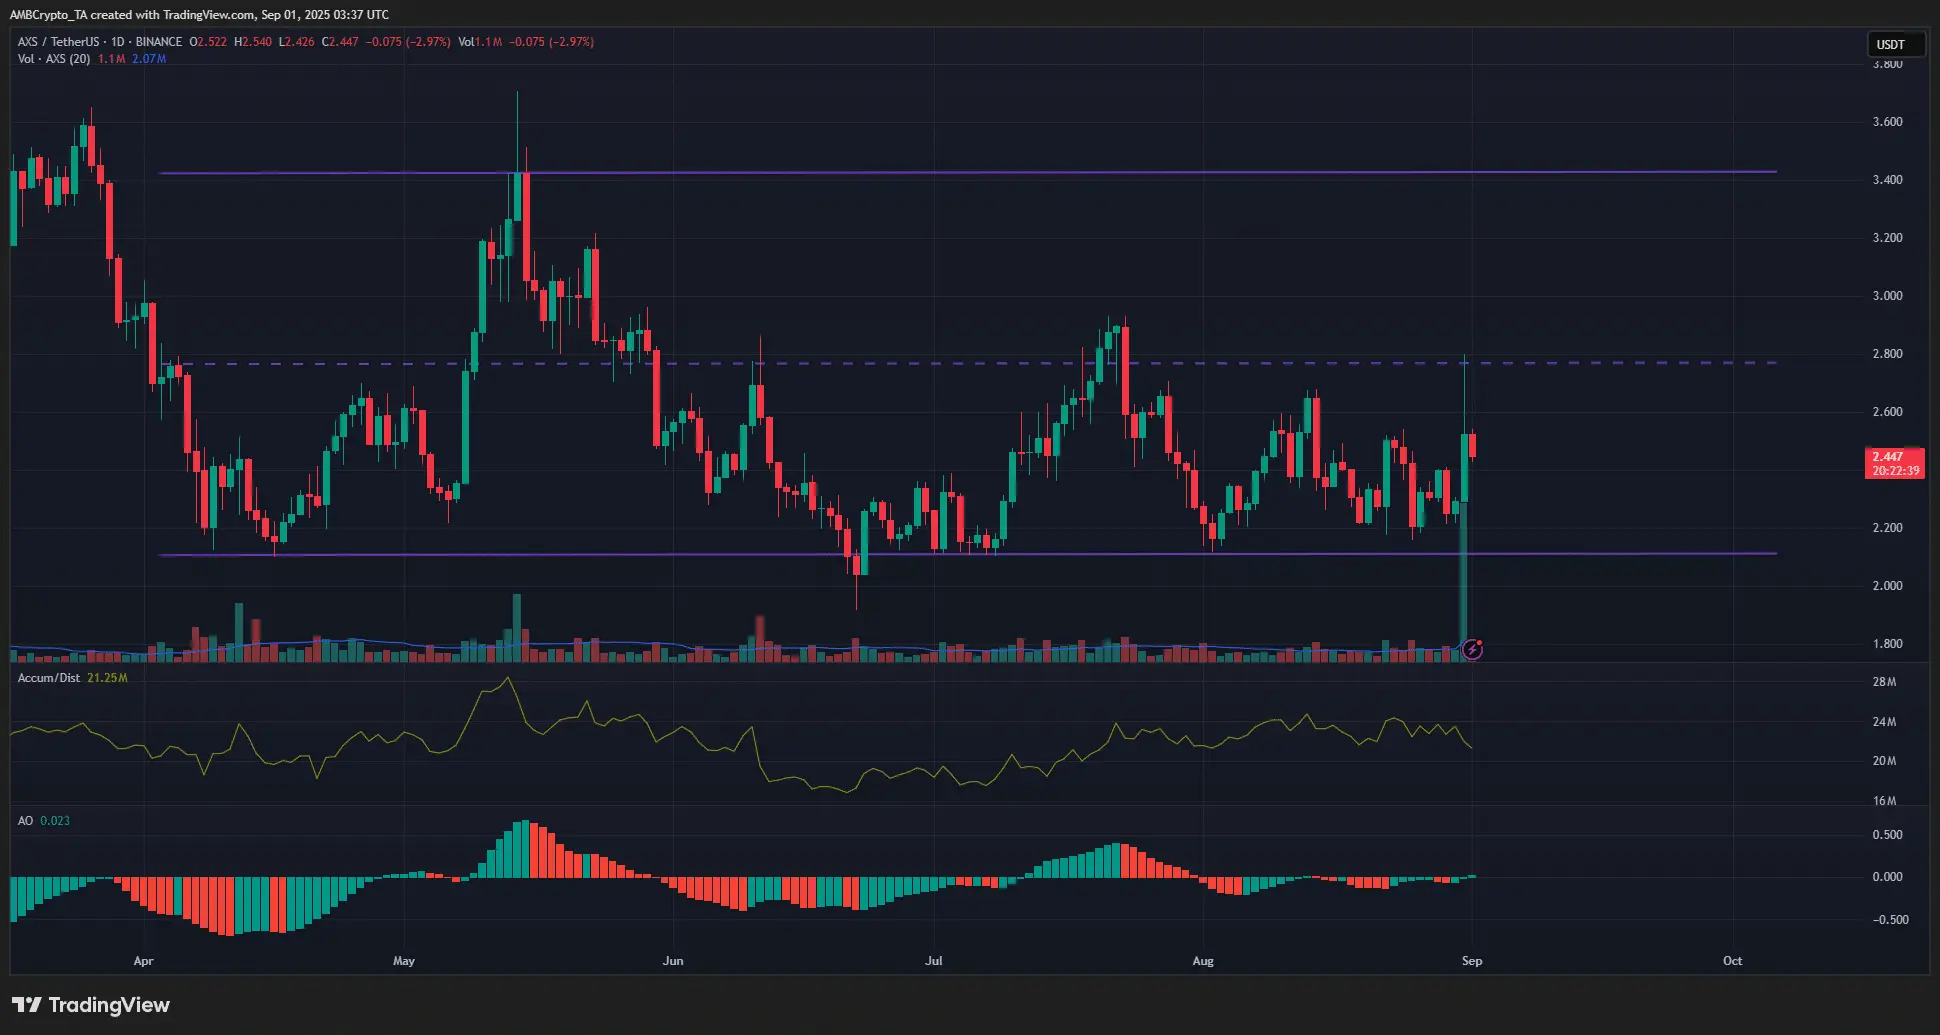 AXS/USDT Price Chart | Source: TradingViewSince April, Axie Infinity has fluctuated within a price range of 2.1 USD to 3.42 USD, with an average price of 2.76 USD (purple line). During the price surge last Sunday, AXS jumped 10% and ended the trading session of the day at 2.52 USD.
Earlier that same day, the price of AXS had reached 2.8 USD, but the bears quickly halted the upward momentum and forced the buyers to retreat from the resistance level in the middle of the range. This indicates that Axie Infinity is likely to move toward the support area around 2.1 USD in the coming days.
The A/D indicator (Accumulation/Distribution ratio ) has declined in recent days, reflecting the dominance of the selling side. Even with a massive buying spree on Sunday, this indicator’s direction still does not show a reversal signal towards an upward trend.
Meanwhile, the AO* indicator has created a bullish crossover and moved above the 0 line, signaling a shift in momentum. However, traders should be cautious with this signal. At the time of writing, AXS’s nearby resistance levels are identified at 2.51 USD, 2.65 USD, and 2.77 USD.
To break through these resistance levels, AXS needs strong confidence from the buyers along with stable buying pressure. However, in the context of the overall market still leaning towards a bearish trend, a strong growth of AXS in the short term will not be easy.
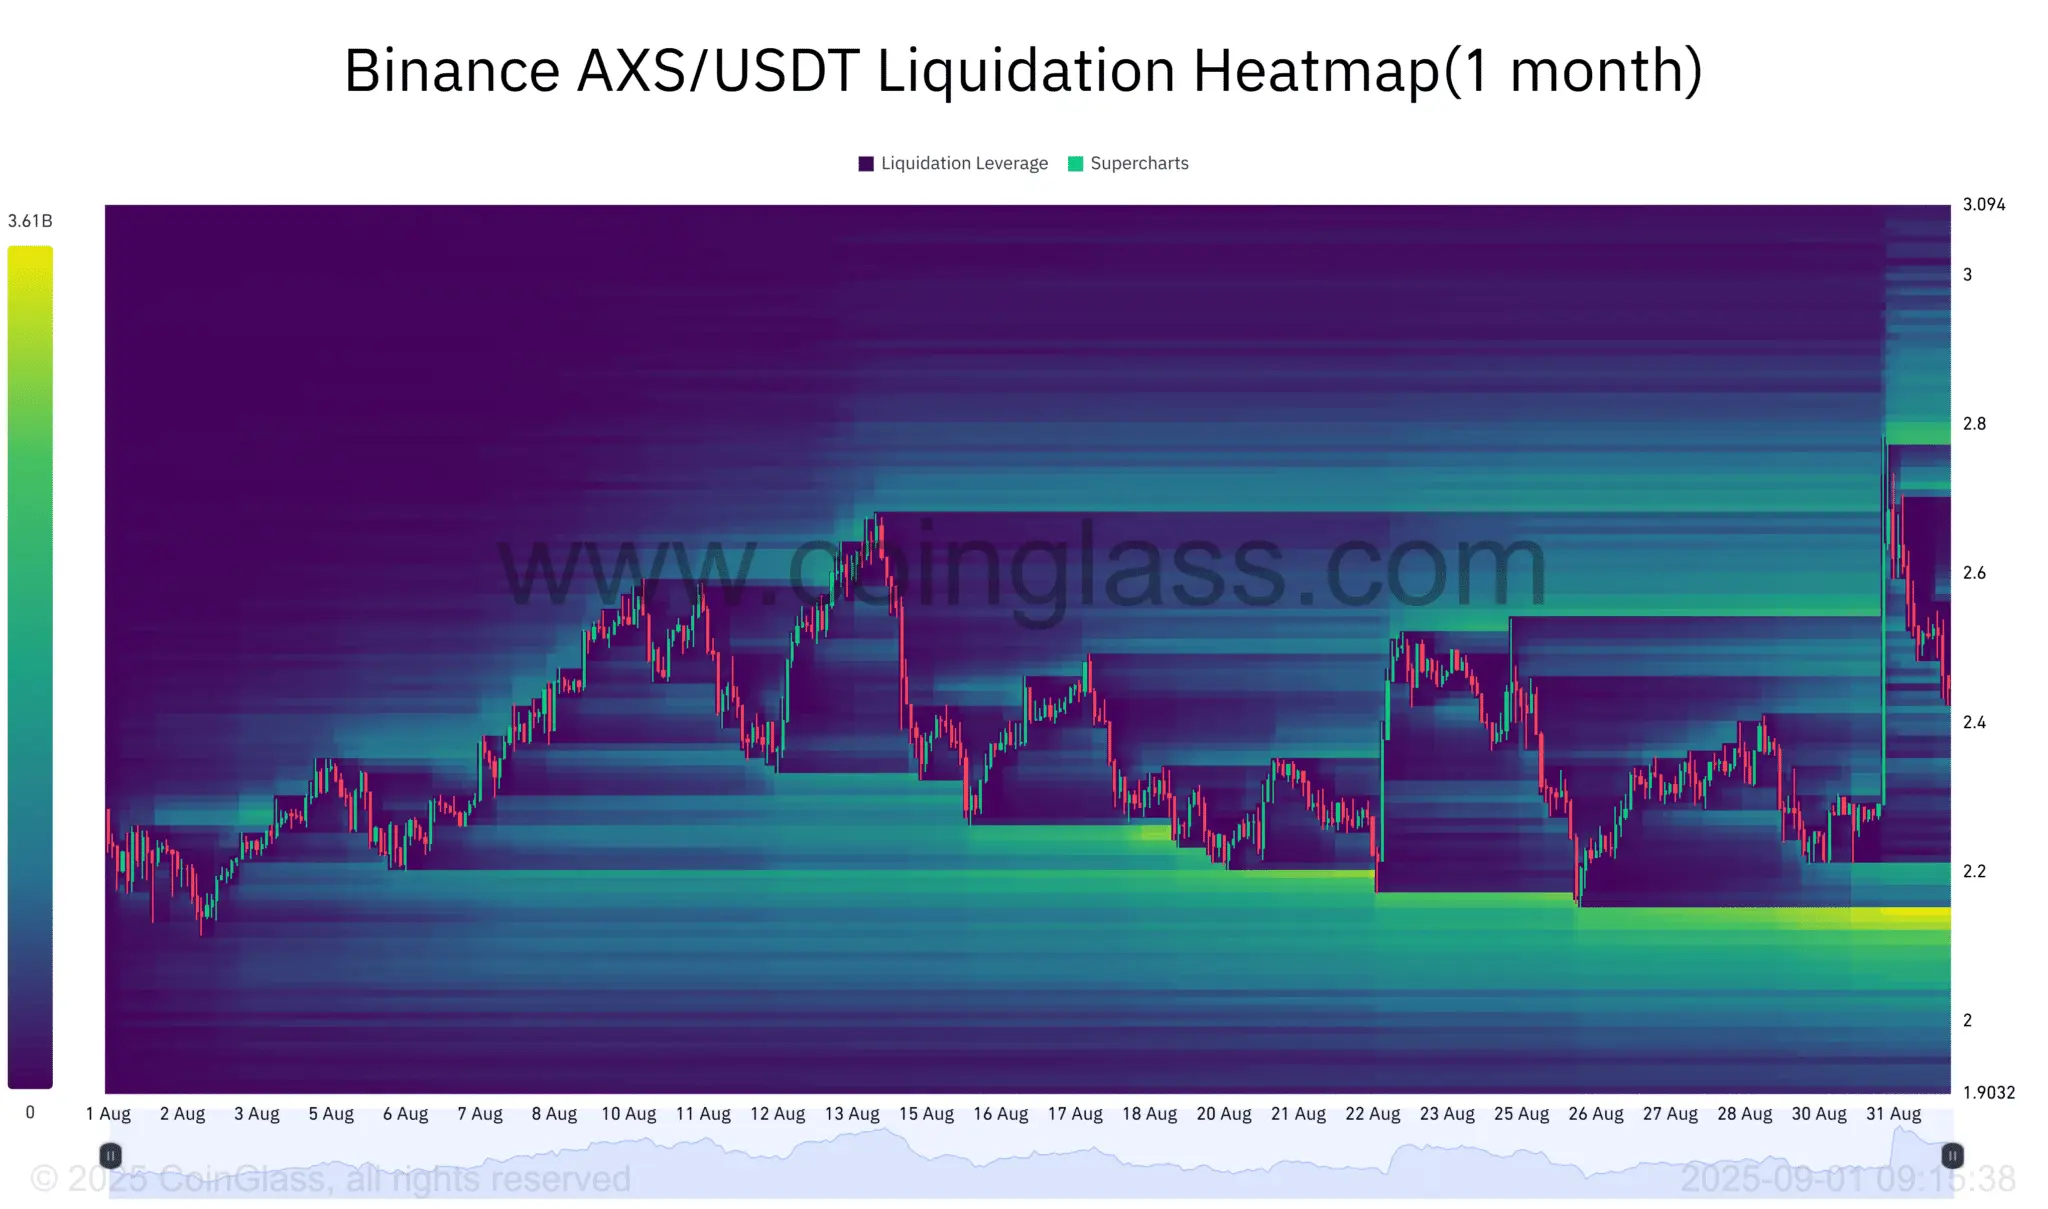 The liquidation heatmap of AXS for the last month( | Source: CoinglassFinally, the liquidation heatmap in the 1-month timeframe shows that the price range of 2.4 USD serves as a short-term liquidity cluster that could help curb the decline. However, the liquidity here is quite sparse compared to the stronger “liquidation zone” around 2.1–2.2 USD.
The combination of the price range oscillation model and the liquidation heat map indicates that considering buying AXS in this demand zone could provide a viable opportunity.
*The AO ) Awesome Oscillator ( is a technical analysis tool developed by Bill Williams, used to measure market momentum and identify trends.
Justin
Disclaimer: The information on this page may come from third parties and does not represent the views or opinions of Gate. The content displayed on this page is for reference only and does not constitute any financial, investment, or legal advice. Gate does not guarantee the accuracy or completeness of the information and shall not be liable for any losses arising from the use of this information. Virtual asset investments carry high risks and are subject to significant price volatility. You may lose all of your invested principal. Please fully understand the relevant risks and make prudent decisions based on your own financial situation and risk tolerance. For details, please refer to
Disclaimer.