The price of Aptos (APT) fell nearly 1% at the time of writing on Monday, after recording an increase of over 5% in the previous session. Despite a slight adjustment, the token of this Parallel Execution mechanism blockchain is still expected to continue its upward momentum, thanks to a breakout signal from a descending triangle pattern, increased retail demand, along with the ever-increasing issuance of stablecoins on the network.
Stablecoin flows into the Aptos network
Aptos just revealed on Monday that the amount of stablecoin on their network is growing rapidly. Typically, the increase in stablecoin market capitalization on a blockchain is a sign that liquidity is improving, which in turn boosts the activity of decentralized finance protocols (DeFi).
In just the past 24 hours, the Aptos network has recorded a stablecoin inflow of over 110 million USD, equivalent to a 500% increase compared to the same period last year (YoY) – a clear testament to the trend of expanding liquidity. Notably, in this surge, the supply of USDT has increased eightfold, while USDC has doubled, further reinforcing the “duopoly dominance” in the stablecoin market.
Strong retail demand for Aptos
Retail investor attention continues to play a key role in driving the upward momentum of Aptos. Data from CoinGlass shows that derivatives traders are aggressively opening more long positions on APT. The open interest on the futures market for Aptos has surged to a record level of 522.23 million USD, compared to 492.57 million USD recorded the previous Sunday. The strong inflow of funds into futures contracts indicates that risk appetite is becoming increasingly evident within the trading community.
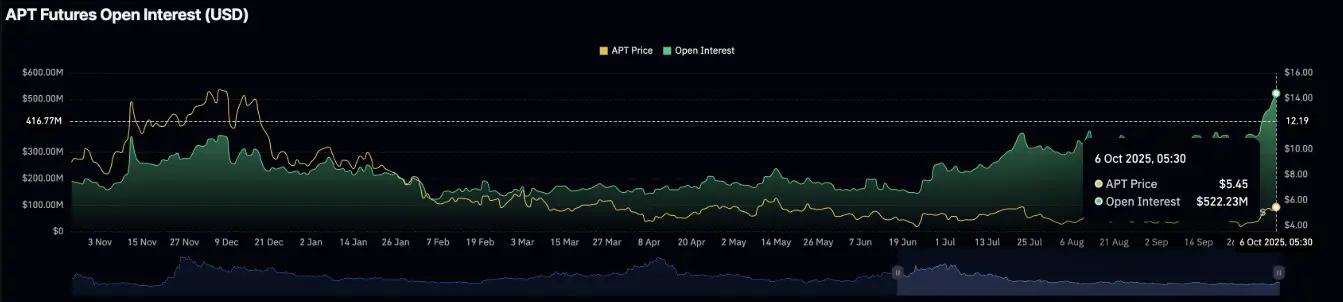 Aptos Open Contract | Source: CoinGlass## Aptos aims for a new upward trend thanks to a bullish cross signal
Currently, Aptos (APT) is trading around the 200-day exponential moving average (EMA) at a level of 5.166 USD. Notably, the 50-day EMA and 100-day EMA are approaching a golden cross (bullish cross) — a signal that indicates short-term momentum is accelerating strongly, even outperforming the long-term trend.
On the daily chart, technical indicators are also collectively reinforcing a positive outlook. The Relative Strength Index (RSI) currently stands at 68 points, nearing the overbought zone, indicating that buying pressure is clearly dominating. At the same time, the MACD indicator continues to maintain an upward trend, further reinforcing bullish momentum.
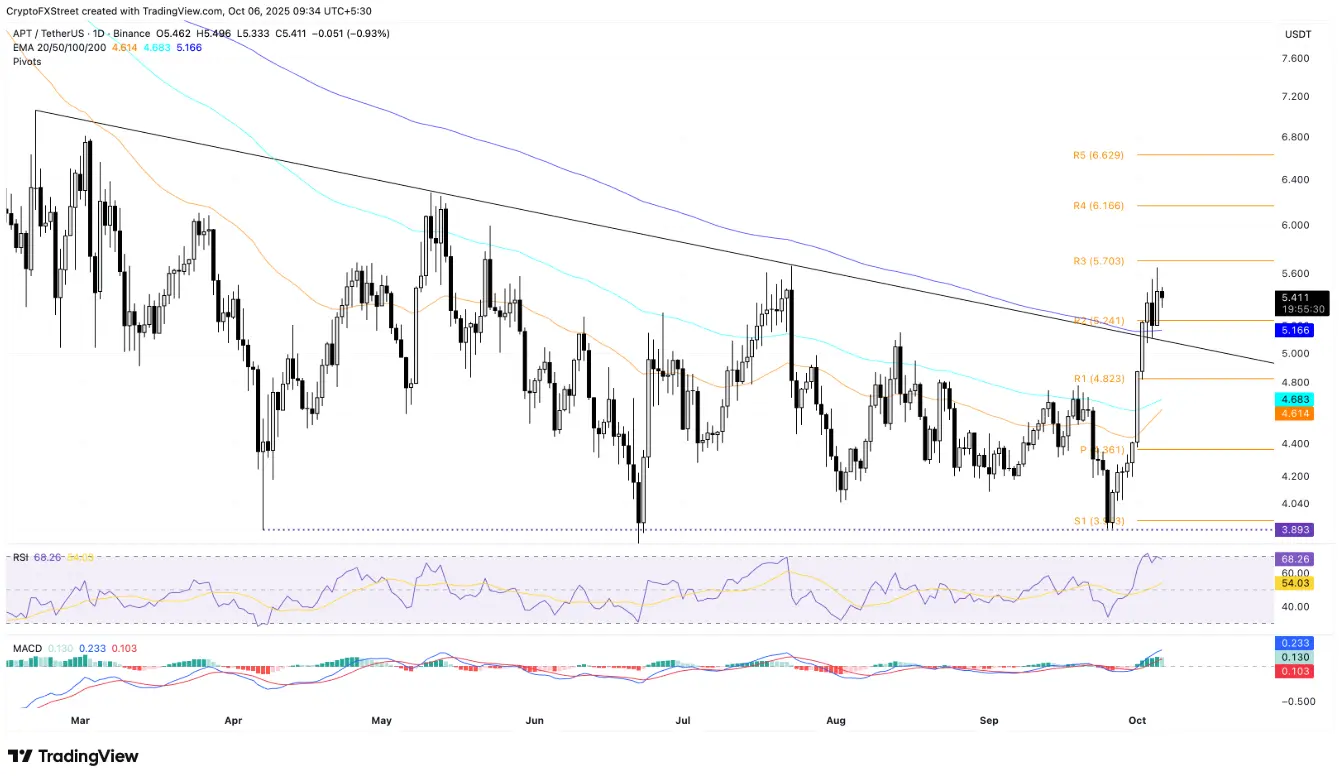 Daily APT/USDT Chart | Source: TradingViewIf this momentum is maintained, APT could break through the resistance zone R3 at 5,703 USD and extend its target to the R4 area around 6,166 USD. Conversely, the 200-day EMA at 5,166 USD — coinciding with the broken trend line of the descending triangle pattern — now serves as a key support zone, safeguarding the current bullish structure.
SN_Nour
Disclaimer: The information on this page may come from third parties and does not represent the views or opinions of Gate. The content displayed on this page is for reference only and does not constitute any financial, investment, or legal advice. Gate does not guarantee the accuracy or completeness of the information and shall not be liable for any losses arising from the use of this information. Virtual asset investments carry high risks and are subject to significant price volatility. You may lose all of your invested principal. Please fully understand the relevant risks and make prudent decisions based on your own financial situation and risk tolerance. For details, please refer to
Disclaimer.