Author: Lucida Source: Medium
A Dramatic Market Reversal in October: Federal Reserve Rate Cuts Didn’t Boost the Markets but Triggered a $400 Billion Flash Crash in Crypto. The Core Issue Isn’t Macro Policy but a Critical Internal Weakness—When Trump’s Tariff Black Swan Struck, High Leverage Pierced Thin Liquidity Instantly. Yet, the True Story Lies Beneath the Ruins: New Narratives like AI + Crypto, RWA, and Prediction Markets Are Quietly Rising, Setting the Stage for the Next Bull Run. This article will cut through the fog of price swings to reveal the truth behind the liquidity crisis and future opportunities.
1. The Big Picture of the Fed’s Rate Cut: A Liquidity Feast and Structural Shifts
On October 30, the Federal Reserve implemented its second rate cut of the year, lowering the federal funds rate target to 3.75%-4.00%. This decision stemmed from a unique U.S. economic dilemma—rising inflation pressures alongside a slowing labor market.
Fed Chair Jerome Powell admitted, “There is no risk-free path.” This predicament made the Fed’s decision-making extremely difficult and introduced uncertainty for future policies.
Market reactions to the rate cut were unexpected. Normally, rate cuts should boost risk assets, but in October, crypto markets experienced massive sell-offs. This indicates investors had already priced in the cut; when it finally happened, it triggered profit-taking.
(1) Federal Funds Rate
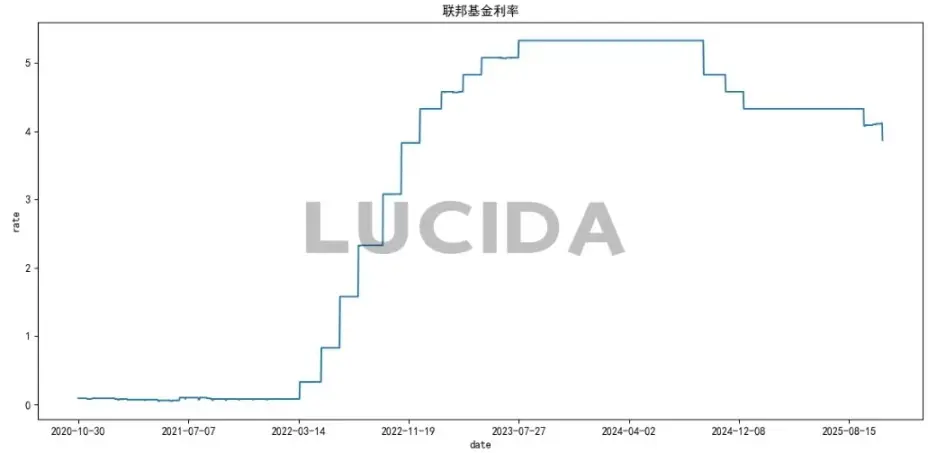
The Fed’s 25 basis point cut in October was largely in line with expectations. The key driver was a noticeable slowdown in the employment market. The policy statement removed the phrase “labor market remains strong,” replacing it with “employment growth has slowed and the unemployment rate has increased slightly.”
(2) Fed’s Balance Sheet
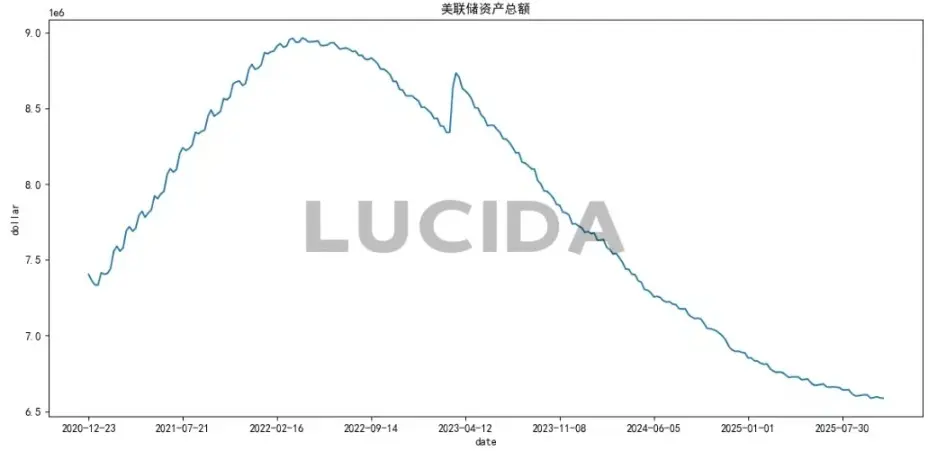
On October 30, after the policy meeting, the Fed made two critical decisions: first, to cut rates by 25 basis points; second, to stop shrinking its balance sheet starting December 1 (ending quantitative tightening, QT). This means the current monthly reduction of $5 billion in U.S. Treasuries and $35 billion in MBS will cease. Chairman Powell explained this move was due to “pressure in the money markets requiring immediate adjustment of balance sheet operations,” and acknowledged “clear signs” that it’s time to halt QT.
This policy shift appears to address liquidity tightening—overnight reverse repo usage has plummeted from a high of $460 billion to less than $6 billion, and bank reserve ratios hover near a critical 12.2%. However, behind this is the Fed’s dilemma amid high debt constraints. U.S. federal debt has surpassed $38 trillion, with net interest costs nearing defense spending levels. Continuing balance sheet contraction would help curb inflation but would significantly raise government borrowing costs and risk debt sustainability. Halting QT is thus a tough balancing act between inflation control and debt management.
Looking ahead, the Fed’s balance sheet is likely to follow a “pause then expand” path. Powell explicitly stated in October that “the Fed will eventually expand its balance sheet again,” as the economy and banking system require more reserves. This suggests that after stopping QT in December and maintaining stability for a period, the Fed may restart asset purchases, likely focusing on short-term Treasuries to reduce overall duration.
These changes are significant for markets. Pausing QT is seen as a form of “implicit easing,” as it stops draining liquidity and could even have a 25 basis point easing effect. Historically, changes in the Fed’s balance sheet impact yields, dollar flows, and risk appetite notably. If liquidity conditions improve, risk-sensitive assets like Bitcoin could receive valuation support.
(3) September Core PCE Price Index
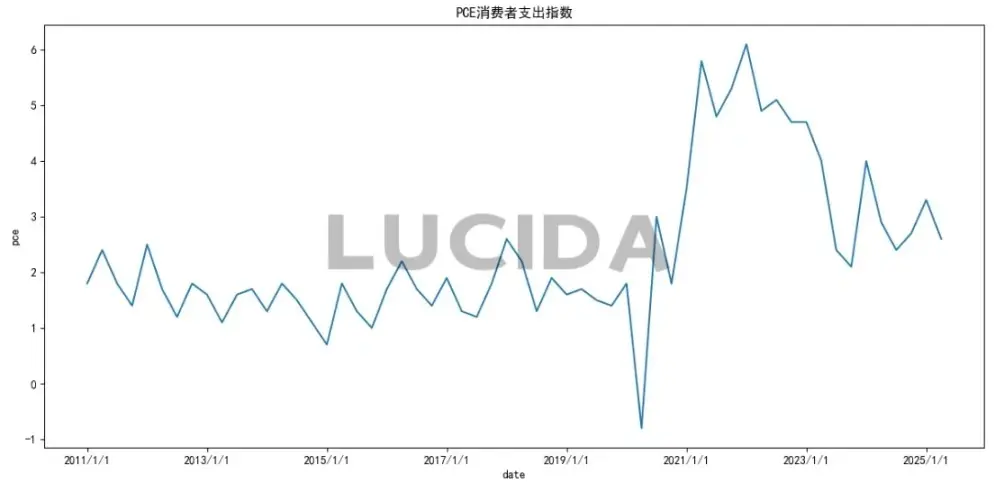
Due to the U.S. government shutdown, October’s core PCE data was not released. However, as the Fed’s preferred inflation gauge, September’s PCE rose 2.7% year-over-year, slightly above July’s 2.6%; month-over-month, it increased by 0.3%, faster by 0.1 percentage points. The core PCE (excluding food and energy) rose 0.2% monthly and 2.9% annually, unchanged from July. Service prices increased by 0.3%, mainly in airline tickets, hotels, financial services, insurance, housing, and utilities. Goods prices rose slightly by 0.1%, offset by declines in entertainment and transportation, with some increases in durable goods and gasoline. The Fed views tariffs’ inflation impact as moderate—contributing about 0.3%-0.4% to core PCE with a slow transmission speed. Powell noted, “In the short term, inflation risks are skewed upward, while employment risks are skewed downward—a challenging situation.”
(4) US Dollar Index
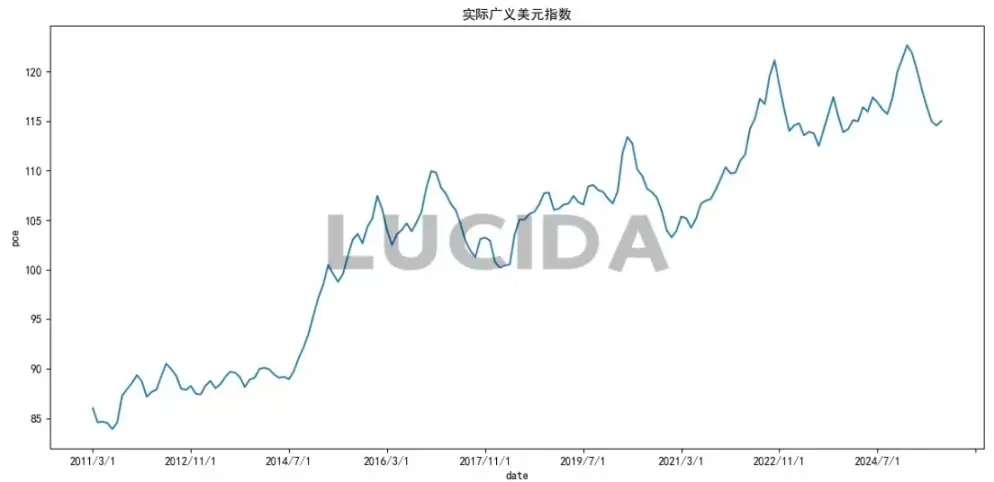
The dollar index weakened initially after the rate cut but did not decline further due to continued easing policies by the European Central Bank and Bank of Japan. This reflects policy divergence among major central banks. Although the Fed has started easing, other major central banks remain accommodative, limiting dollar depreciation. Meanwhile, long-term U.S. Treasury yields remain high (10-year yield at 4.145%), attracting safe-haven flows back to the U.S. and further restraining dollar weakness.
Summary
The rate cut reflects the Fed’s response to a triple dilemma. Weakening employment was the key trigger. The October rate cut faced rare internal opposition: Kansas City Fed President Esther George opposed easing, advocating for unchanged rates; while Governor Christopher Waller argued for a 50 basis point cut. This split underscores the Fed’s struggle to balance inflation and growth. Powell described the current outlook as “driving in fog,” emphasizing policy uncertainty. Despite signals of easing, crypto markets reacted tepidly—Bitcoin fell nearly 5% in October, breaking a six-year “Uptober” rally streak. This divergence reveals skepticism about easing when cuts are driven by economic worries rather than healthy growth, making risk assets less likely to sustain gains.
2. Market Sentiment in Cryptocurrency
(1) Total Market Cap
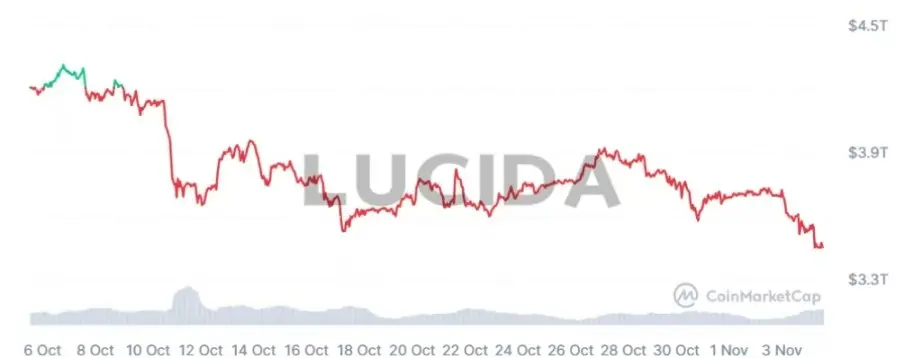
Market cap reflects overall sentiment and is the aggregate of all tokens’ prices, capital flows, and confidence. In October, it experienced a rollercoaster: on October 5, buoyed by strong gains in Bitcoin and Ethereum, it hit a record high of $4.35 trillion. But during the “10/11” crash, it plunged over 9% in a single day, wiping out billions. By the end of October, it had fallen back to about $3.4 trillion, illustrating how panic and deleveraging sharply contracted wealth effects.
(2) Altcoin Season Index
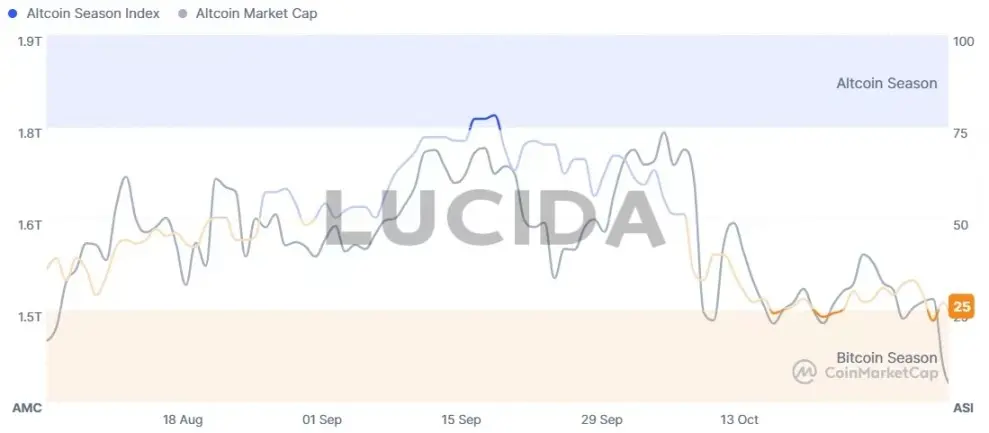
The Altcoin Season Index measures how many major altcoins outperform Bitcoin in a given cycle. When below 75, especially in the 20-30 range (a “Bitcoin season”), it indicates funds are flowing from riskier altcoins into Bitcoin—typical of risk-off or early bull phases. In late October, the index was at 32, confirming a risk-averse mode. Earlier in October, it reached 78, signaling “altcoin season.” Rapid shifts from “altcoin season” to “Bitcoin season” reveal changing market hot spots. Historically, a rebound from low levels (like 15 or 17) above 30 can signal capital rotation and early opportunities in altcoins. But caution is advised, as altcoin cycles tend to be shorter and more volatile than Bitcoin’s.
(3) Fear & Greed Index
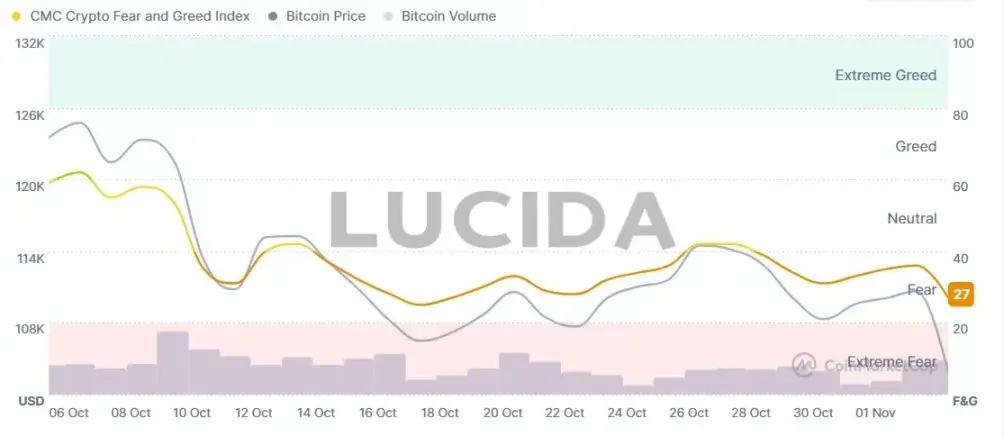
The Crypto Fear & Greed Index swung sharply from “Greed” at 74 on October 5—near historic highs—to “Extreme Fear” at 21 on November 4 amid macro worries (e.g., tariffs) and structural risks (high leverage liquidations). This extreme reversal reflects fragile investor confidence and often signals oversold conditions or potential bottoms—some analysts see such fear as a contrarian buy signal. During October’s crash, Bitcoin dominance rose, while trading volume and social sentiment declined, pushing the market into “fear.”
3. Hot Sectors and Core Narratives
Despite overall weakness, capital and enthusiasm didn’t vanish but reallocated into key sectors, revealing structural differentiation. Institutional flows contrast with community-driven hype, painting a complex market picture.
(1) Institutional Focus: Core Narratives
Institutional investors remain committed to core narratives. Bitcoin and Ethereum spot ETFs saw net inflows of $5.55 billion and $1.01 billion, respectively, signaling long-term confidence. Stablecoins’ circulation increased by $9.38 billion, indicating large off-market funds waiting to deploy. Key themes include:
- AI + Crypto: Deepening integration around “compute power, data, and agent ownership.” ERC-8004 tokenizes AI agents; Coinbase’s x402 protocol enables open payments among agents.
- RWA (Real-World Assets): Explosive growth, with tokenized U.S. Treasuries surging from $80 million to over $730 million, led by giants like BlackRock’s BUIDL and Franklin Templeton.
- Prediction Markets: Continued hot, with Polymarket and Kalshi volumes up nearly 5x. NYSE’s parent plans up to $2 billion in investments, pushing mainstream adoption.
(2) Tech & Regulation
Technological evolution and regulatory reforms are creating new opportunities:
- Privacy tech competition heats up: Trusted execution environments, zero-knowledge proofs, and fully homomorphic encryption vie for dominance.
- Yield protocols: September DeFi revenue hit ~$600 million; Hyperliquid’s recent 30-day revenue used 95% for buybacks and rewards.
- Crypto banks and stablecoins: Post-GENIUS bill, stablecoin payments grew ~70%, showing regulatory clarity boosts adoption.
(3) Community & Meme Coins
Contrasting institutional restraint, meme coins are on fire. Projects like BALZ on BNB Chain raised over $2 million in days, attracting 40,000+ community members. Chinese meme tokens on Binance, Solana, and Base ecosystems surged, with projects like “Binance Life” experiencing short-term market cap explosions. While these hype cycles attract new traders, their sustainability remains questionable.
This divergence illustrates a market with dual tracks: institutions building for the long term, while communities chase short-term gains in meme coins—together shaping October’s market landscape.
4. Regulatory Landscape: East vs. West
Global regulatory stances are diverging sharply.
- UK: Adopts a more permissive approach, opening London Stock Exchange to digital assets and lifting a four-year ban on crypto exchange notes. Analysts estimate this could boost UK crypto markets by 20%.
- China: PBOC Governor Pan Gongsheng emphasized ongoing crackdowns, stating, “The People’s Bank will continue to combat crypto speculation and maintain financial order, while monitoring offshore stablecoin developments.”
- US: Major breakthrough as SEC approves Hashdex Nasdaq Crypto Index US ETF under new listing standards, allowing holdings beyond BTC and ETH, including XRP, SOL, and XLM. This paves the way for more diversified institutional crypto ETFs, potentially reshaping asset allocations.
5. Investment Outlook: Finding Certainty in Uncertainty
Looking ahead, the crypto market stands at a pivotal point of narrative transition.
Future Fed policy hinges on two factors: the degree of employment slowdown and the sustainability of inflation decline. Standard Chartered predicts the dollar may slightly rebound to 100 within 1-3 months.
The October flash crash, though painful, was a necessary deleveraging. Data shows open interest dropped from $4.87 billion to $4.51 billion, and funding rates fell 51%. A belief-driven market with institutions seeking new allocations is forming.
Technological innovation will continue to propel growth. Narratives like AI agents, prediction markets, and RWA are not only cutting-edge but also capital flow drivers. In a sluggish traditional economy, these sectors could lead the market recovery in the coming months.
