The current price of Bitcoin is $86,661.2. Altcoins are showing mixed performance, with QKA leading the gains at 53.84%, reaching a price of $1.6774. The Fear and Greed Index stands at 19 (Extreme Fear), reflecting a persistently bearish market sentiment, but this may also present an opportunity for bargain hunting. BTC’s short-term support is at $85,422.3, with resistance at $88,124.9.
Major Coins Recover and Stabilize as Institutional Holdings Exceed One Million BTC
Bitcoin is currently priced at $86,661.2, down only 0.2% in the past 24 hours, indicating that prices are stabilizing after last week’s volatility. A key point in this crypto market analysis is the strong institutional interest, with public companies’ BTC holdings surpassing the historic milestone of one million coins. This figure includes MicroStrategy’s 649,000 BTC, Marathon Digital’s holdings, and the combined holdings of other publicly listed companies.
The short-term support is at $85,422.3, a level tested multiple times during last week’s sell-off and held firm. Order book data shows a large number of limit buy orders in the $85,000 to $85,500 range, mainly from long-term investors and institutional funds, providing a solid price floor. Resistance is at $88,124.9, the high from last week’s rebound and the final technical hurdle before the psychological $90,000 mark.
Bitcoin’s trading volume is close to $1 billion, signaling robust market activity. Even during price declines, BTC liquidity remains strong, which is reassuring for institutional investors. Ample liquidity means large buy and sell orders can be executed quickly without significant price slippage.
Ethereum’s current price is $2,787.03, down 0.54% in the past 24 hours. Despite short-term fluctuations, the long-term outlook remains optimistic, with support at $2,763.21 and resistance at $2,858.19. Ethereum’s trading volume is about $300 million—lower than Bitcoin but still active among major coins. Technically, ETH is consolidating between $2,700 and $2,900, a sideways pattern that typically builds momentum for the next directional breakout.
Key Price Levels for Major Coins
BTC Support: $85,422.3 (Multiple successful tests last week)
BTC Resistance: $88,124.9 (Rebound high, just below the psychological barrier)
ETH Support: $2,763.21 (Lower bound of the consolidation range)
ETH Resistance: $2,858.19 (Upper bound of the consolidation range)
Altcoin Surge: QKA Up 53.84%
Altcoins are standing out in this round of crypto market analysis, contrasting sharply with major coins. QKA is currently priced at $1.6774, with a 24-hour gain of 53.84%, indicating strong market demand. Support is at $0.9403, meaning even a 44% pullback from the current price would find technical support. Such large gains are often driven by major positive news or the entry of big capital; investors should keep an eye on QKA’s fundamentals.
SQUAD is currently priced at $0.0000726, up 38.94%, showing increased market activity. Support is at $0.00005, a key area from previous consolidation. KINGSHIB is priced at $0.002416, up 38.85%, reflecting renewed investor confidence. Support is at $0.0017, leaving about 30% downside buffer from the current price.
All three of these altcoins have gained more than 38% and are small-cap coins. When major coins are consolidating or dipping slightly, funds often flow into altcoins seeking higher returns. This “majors stable, alts rise” pattern usually appears when market sentiment is gradually recovering but a trend reversal hasn’t been fully confirmed.
However, high gains in altcoins come with high risks. These coins lack the liquidity of BTC and ETH, and their prices can swing wildly, with 50% gains one day and 40% pullbacks the next. Additionally, small-cap coins are more susceptible to manipulation, and some of the gains may be due to pump-and-dump schemes. Therefore, while altcoins offer high potential returns in this round of crypto market analysis, investors must strictly control position sizes and are advised not to allocate more than 20% of total capital to altcoins.
Fear and Greed Index at 19: Opportunities Amid Extreme Fear
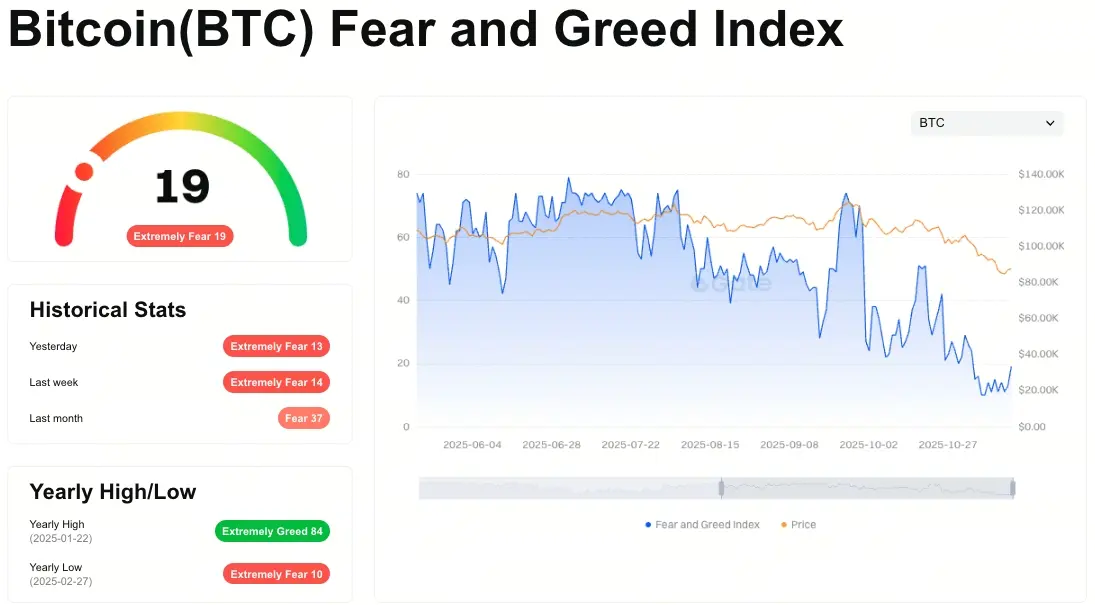
(Source: Gate)
The current Fear and Greed Index is 19 (Extreme Fear), reflecting bearish market sentiment. The Fear and Greed Index is a sentiment indicator calculated using price volatility, trading volume, social media sentiment, market dominance, and Google search trends, with scores ranging from 0 (extreme fear) to 100 (extreme greed). A score of 19 means the market is in a state of extreme fear, with widespread investor pessimism.
From a contrarian investment perspective, extreme fear often occurs near market bottoms. When retail investors panic-sell at any cost, it’s an opportunity for long-term investors to buy the dip. Buffett’s famous saying, “Be fearful when others are greedy, and greedy when others are fearful,” also applies to the crypto market. Historical data shows that when the index drops below 20, there’s a more than 70% chance of a rebound within the next 1-3 months.
However, extreme fear can persist for weeks or even months. During the 2022 bear market, the index stayed below 20 for an extended period, with BTC dropping from $40,000 to $15,000. Therefore, extreme fear only signals very pessimistic sentiment but does not guarantee a price bottom. Current crypto market analysis suggests using a dollar-cost averaging strategy rather than going all-in at once.
Momentum indicators show intensified short-term bull-bear battles, so keep an eye on trading volume and volatility indicators to judge the probability of a trend reversal. Trading volumes for BTC and ETH have remained stable in recent days, with no signs of panic selling—this is relatively positive. Volatility indicators show the market is still highly volatile, with intraday price swings of 3% to 5%.
Short-Term Trading Strategies and Position Management
Entry Timing Recommendations
Ethereum: Consider staggered buying near the $2,763 support, which is the lower bound of the consolidation range and has held up repeatedly.
Bitcoin: Consider accumulating near $85,422, the key support from last week’s sell-off, with strong buying interest.
Take-Profit and Stop-Loss Settings
ETH Stop-Loss: Set at $2,700; a break below confirms the range has failed.
BTC Stop-Loss: Set at $84,000; a break below may test lower support.
ETH Take-Profit: Target $2,858 (resistance); if broken, look for $3,000.
BTC Take-Profit: Target $90,000 (psychological barrier); if broken, look for $95,000.
For position management, it is recommended to allocate 30% to 50% of funds to major coins, with the remainder selectively in altcoins for higher return potential. This allocation balances stability and returns—major coins provide a portfolio base, while altcoins offer flexible gains. The current market risk is moderately high; stay vigilant and maintain robust risk controls.
Mid-Term Allocation: Rebound Expected, But Watch Policy Shifts
This crypto market analysis forecasts a moderate mid-term rebound but advises watching macroeconomic and policy changes. Fed Chair Williams’ hawkish remarks have provided short-term support, but the US government shutdown and missing economic data add uncertainty.
For allocation, a BTC to ETH ratio of 60:40 is recommended to reduce overall portfolio risk. This allocation favors Bitcoin due to its stronger status as “digital gold” and greater institutional recognition. While Ethereum is more volatile, its smart contract ecosystem and DeFi applications provide additional value support.
Key factors to monitor include upcoming regulations and major institutional investment moves, as these could drive the market. If a bull market emerges, increase positions to 70-80%; in a bear market, consider reducing exposure to 20-30% or using hedging strategies; in a sideways market, flexibly adjust holdings to capture short-term opportunities.

