Kaspa (KAS), Flare (FLR) and SPX6900 (SPX) continue to bounce back, standing out amidst the gloomy picture of the market as Bitcoin (BTC), Ethereum (ETH), and other major altcoins are facing strong pressure from macroeconomic instability and a lack of significant price stimulus.
Kaspa reclaims support as bulls aim to take control of the trend
Kaspa has surged strongly, increasing by 67% from the floor price of $0.0358 set last Friday, currently trading around $0.0597 at the time of writing on Friday. The breach of the 50-day exponential moving average (EMA) at $0.0536 has confirmed the bullish trend and paved the way for a bounce back on the daily chart that has been under pressure from the descending trend line.
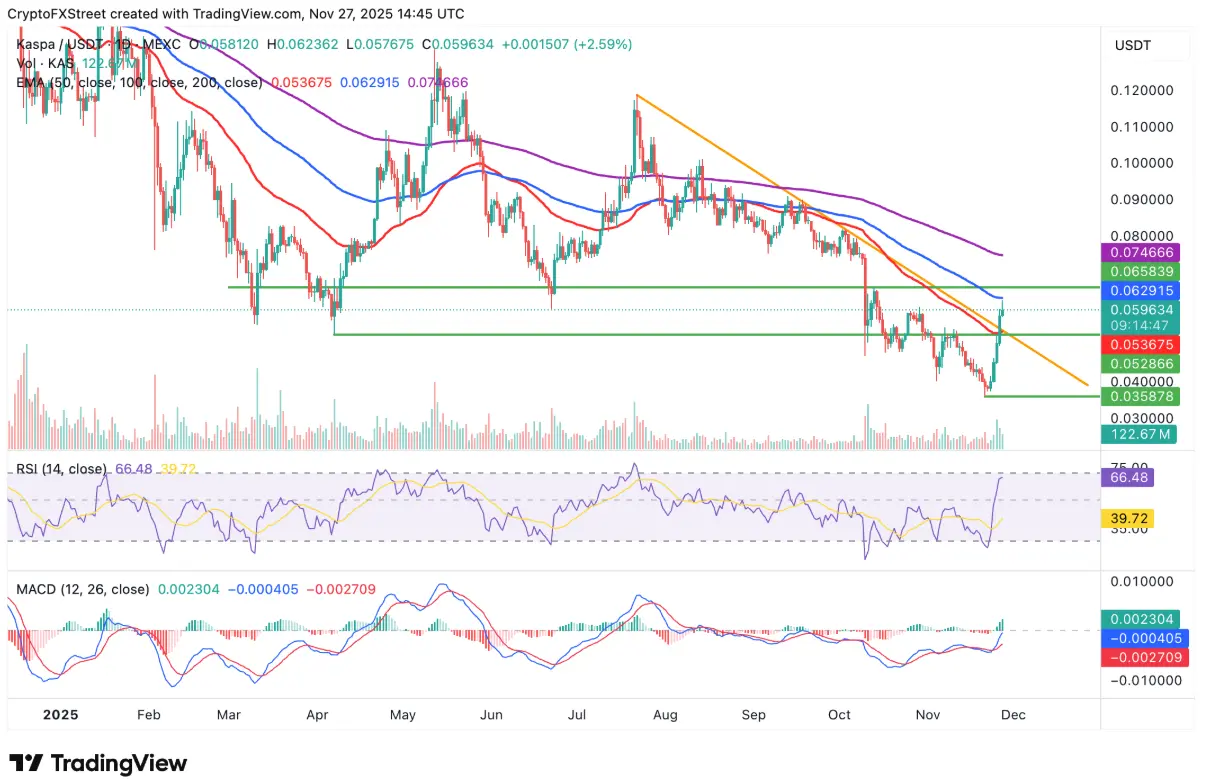 Daily KAS/USDT Chart | Source: TradingViewAlthough the 100-day EMA at $0.0629 may create a barrier for the bounce back, the Relative Strength Index (RSI) is approaching the overbought area, indicating that buying pressure remains strong. At the same time, the MACD indicator continues to signal buy on the daily chart, emphasizing the opportunity to increase risk levels for trend-following investors.
If Kaspa maintains a sustainable upward trend and breaks through the 100-day EMA, the bounce back potential could extend to the 200-day EMA at $0.0746. Conversely, a reversal below the downtrend line and the 50-day EMA would wipe out this week's gains, pushing the price back to the important support level of $0.0358.
Flare bulls tighten control
Flare (FLR) is challenging a key resistance level around $0.0150 on the daily chart, after recording a consecutive five-day price increase since Sunday. The RSI index climbed to 52, reinforcing a positive short-term outlook for FLR, while a buy signal from the MACD appeared on Monday, encouraging investors to cautiously increase their risk.
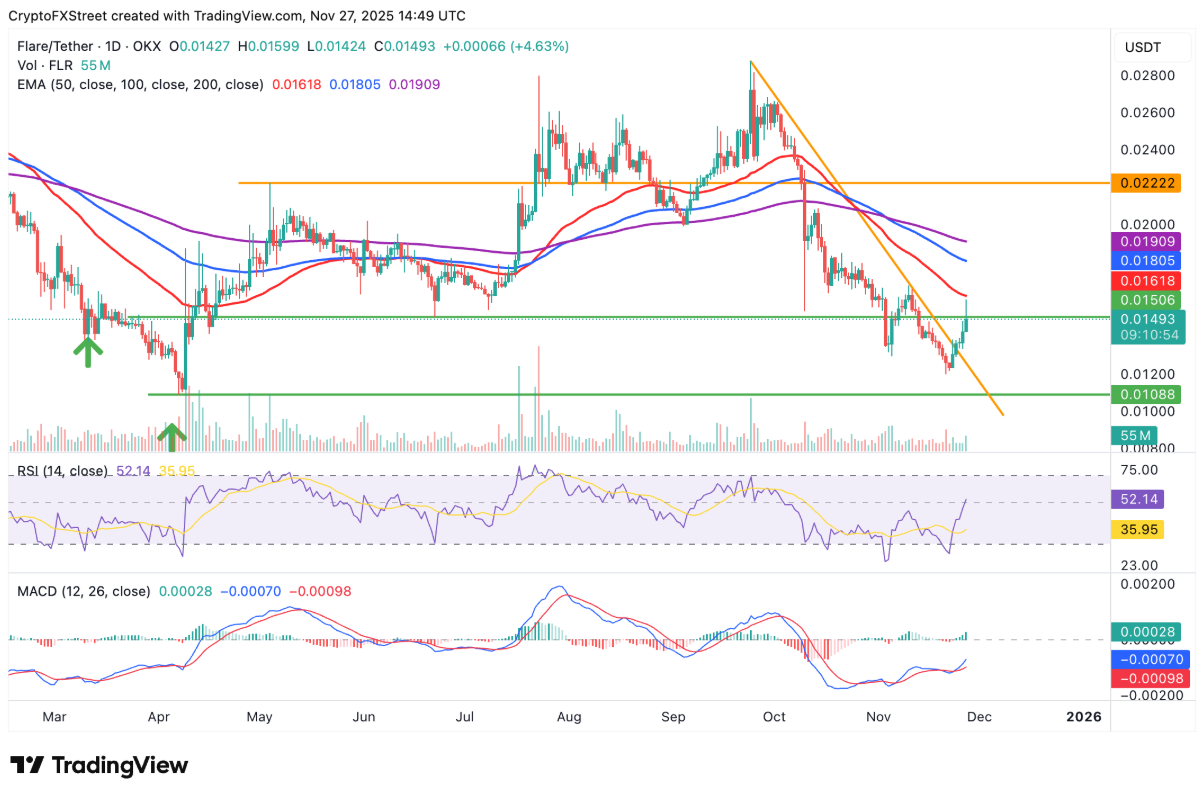 FLR/USDT Daily Chart | Source: TradingViewTo confirm the bounce back trend, Flare needs to firmly break the immediate resistance level of $0.0150, aiming towards the key EMA lines: 50-day EMA at $0.0161, 100-day EMA at $0.0180, and 200-day EMA at $0.0190.
However, the pressure to take profits early along with the overall volatility of the cryptocurrency market could still cause a trend reversal, bringing the price of FLR back to the support range of $0.0108 to $0.0120.
SPX6900 holds steady amid a bleak crypto market
As of the time of writing on Friday, SPX6900 is trading around $0.7267, supported by positive short-term technical signals. The RSI on the daily chart is at 54, indicating that bullish momentum is gradually strengthening.
Meanwhile, the MACD line approaches the 0 level, implying that investors may consider increasing their positions when the green histogram bars expand, signaling that buying pressure is rising.
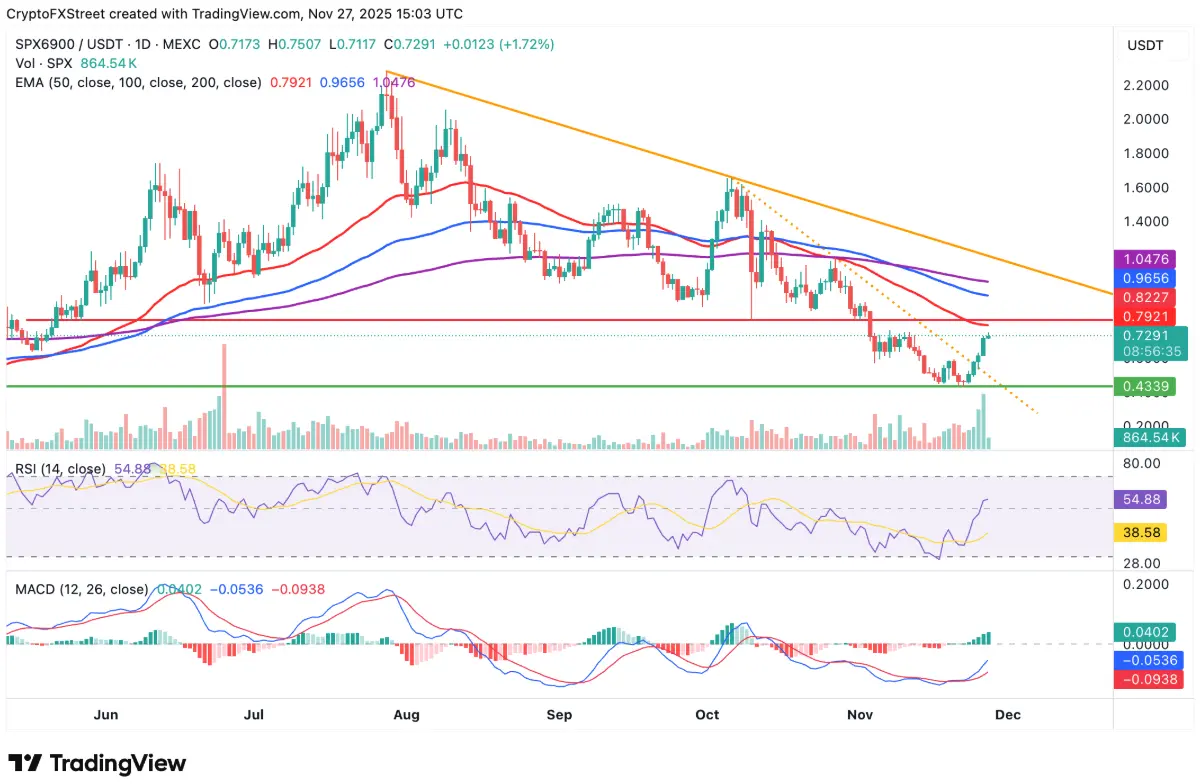 SPX6900/USDT daily chart | Source: TradingViewTraders will pay attention to the potential breakout of the 50-day EMA at $0.7921, a confirmation sign that bulls are dominating SPX. If successful, the next step will target key resistance levels at the 100-day EMA ($0.9656) and the 200-day EMA ($1.0476), opening up opportunities for a sustainable uptrend.
SN_Nour
Disclaimer: The information on this page may come from third parties and does not represent the views or opinions of Gate. The content displayed on this page is for reference only and does not constitute any financial, investment, or legal advice. Gate does not guarantee the accuracy or completeness of the information and shall not be liable for any losses arising from the use of this information. Virtual asset investments carry high risks and are subject to significant price volatility. You may lose all of your invested principal. Please fully understand the relevant risks and make prudent decisions based on your own financial situation and risk tolerance. For details, please refer to
Disclaimer.
Related Articles
Polkadot to Reset Tokenomics on March 12 With Major DOT Supply and Staking Changes
Polkadot will introduce a new monetary framework on March 12 that sets DOT’s supply cap at 2.1 billion and lowers emissions by 53.6%.
The overhaul will also create a Dynamic Allocation Pool and shorten the DOT unbonding period from 28 days to 24–48 hours.
On March 12, Polkadot will reset
CryptoNewsFlash2h ago
Bitcoin May Be Closer to a Bottom Than Most Think, Chart Signals
The Bitcoin price slipped about 2% today, trading slightly below $68,000 after pushing above $73,000 earlier this week, as already covered on our site. The move added fresh pressure to a market that still feels shaky, especially after several failed attempts to hold higher levels.
Still, not e
CaptainAltcoin3h ago
Dogecoin Monthly Breakdown Pattern Reappears as Price Tests $0.0918
Dogecoin is currently trading at $0.09205 at a gain of 2.3, with support of above $0.08878.
As can be seen in the monthly chart, there are recurring breakdown areas that have been followed by significant expansions in price.
The short-term trading range is narrow and the immediate point o
CryptoNewsLand3h ago
Solana Eyes $90.6 Trigger Point as $83 Support Holds and Liquidation Pressure Builds
A large cluster of short positions faces liquidation if SOL reaches $90.6, potentially increasing volatility.
SOL trades between $83.00 support and $89.58 resistance, keeping price action compressed in the short term.
SOL posts a 0.8% daily gain and rises 0.7% against BTC, holding
CryptoNewsLand3h ago
Crypto Market Plunges As Extreme Fear Controls Investor Sentiment
The global crypto market is notably bearish, with a 2.93% drop in market capitalization to $2.32T. Bitcoin and Ethereum saw decreases of 3.07% and 4.01%, respectively. Meanwhile, notable gainers include $XBTC, $TRUMP, and $PEPE. DeFi TVL and NFT sales also declined significantly, while key investments from YZi Labs and Kazakhstan's central bank emerged.
BlockChainReporter3h ago
HBAR at a Crossroads: Will $0.095 Support Trigger a Break Toward $0.106?
HBAR is trading at $0.09739 and above the S/R flip of $0.094-$0.096 in the 12H chart.
The nearest resistance will be at $0.10 with a falling trendline pressure at around $0.104-$0.106.
The support is at $0.095835 and a breakdown at the
CryptoNewsLand4h ago