Trade
Trading Type
Spot
Trade crypto freely
Pre-Market
Trade new tokens before they are officially listed
Margin
Magnify your profit with leverage
Convert & Block Trading
0 Fees
Trade any size with no fees and no slippage
Alpha
Points
Get promising tokens in streamlined on-chain trading
Leveraged Tokens
Get exposure to leveraged positions simply
Futures
Futures
Hundreds of contracts settled in USDT or BTC
Options
HOT
Trade European-style vanilla options
Unified Account
Maximize your capital efficiency
Demo Trading
Futures Kickoff
Get prepared for your futures trading
Futures Events
Participate in events to win generous rewards
Demo Trading
Use virtual funds to experience risk-free trading
Earn
Launch
CandyDrop
Collect candies to earn airdrops
Launchpool
Quick staking, earn potential new tokens
HODLer Airdrop
Hold GT and get massive airdrops for free
Launchpad
Be early to the next big token project
Alpha Points
NEW
Trade on-chain assets and enjoy airdrop rewards!
Futures Points
NEW
Earn futures points and claim airdrop rewards
Investment
Simple Earn
Earn interests with idle tokens
Auto-Invest
Auto-invest on a regular basis
Dual Investment
Buy low and sell high to take profits from price fluctuations
Soft Staking
Earn rewards with flexible staking
Crypto Loan
0 Fees
Pledge one crypto to borrow another
Lending Center
One-stop lending hub
VIP Wealth Hub
Customized wealth management empowers your assets growth
Private Wealth Management
Customized asset management to grow your digital assets
Quant Fund
Top asset management team helps you profit without hassle
Staking
Stake cryptos to earn in PoS products
Smart Leverage
NEW
No forced liquidation before maturity, worry-free leveraged gains
GUSD Minting
Use USDT/USDC to mint GUSD for treasury-level yields
More
Promotions
Activity Center
Join activities and win big cash prizes and exclusive merch
Referral
20 USDT
Earn 40% commission or up to 500 USDT rewards
Announcements
Announcements of new listings, activities, upgrades, etc
Gate Blog
Crypto industry articles
VIP Services
Huge fee discounts
Proof of Reserves
Gate promises 100% proof of reserves
The Biggest Mistake XRP Haters Keep Making About Ripple’s Business Model
2h ago
Here’s Why Cardano’s Midnight and XRP Together Could Break the Banking Model
3h ago
Trending Topics
View More13.61K Popularity
13.36K Popularity
38.71K Popularity
84.61K Popularity
2.82K Popularity
Hot Gate Fun
View More- MC:$3.56KHolders:10.00%
- MC:$3.56KHolders:10.00%
- MC:$3.55KHolders:10.00%
- MC:$4.3KHolders:23.01%
- MC:$3.58KHolders:10.00%
Pin
Zcash Price Just Pulled an 80% Bounce – But This ZEC Chart Still Warns of a Crash
What the ZEC Chart Is Showing The recent bounce fits cleanly inside a larger corrective structure. The ZEC price rallied straight into a heavy resistance zone between $550 and $600, an area that has already rejected price multiple times. This zone lines up with prior distribution and failed breakouts, which makes it a natural place for sellers to step back in. The chart also shows that the move from $300 to $550 happened quickly, with little consolidation along the way. Rallies like that often attract late buyers near the top, especially after a big percentage gain. That’s where risk increases fast. Above this zone, the next key level is around $720. A strong higher-timeframe close above that level would invalidate the bearish setup. Until that happens, price remains capped below major resistance.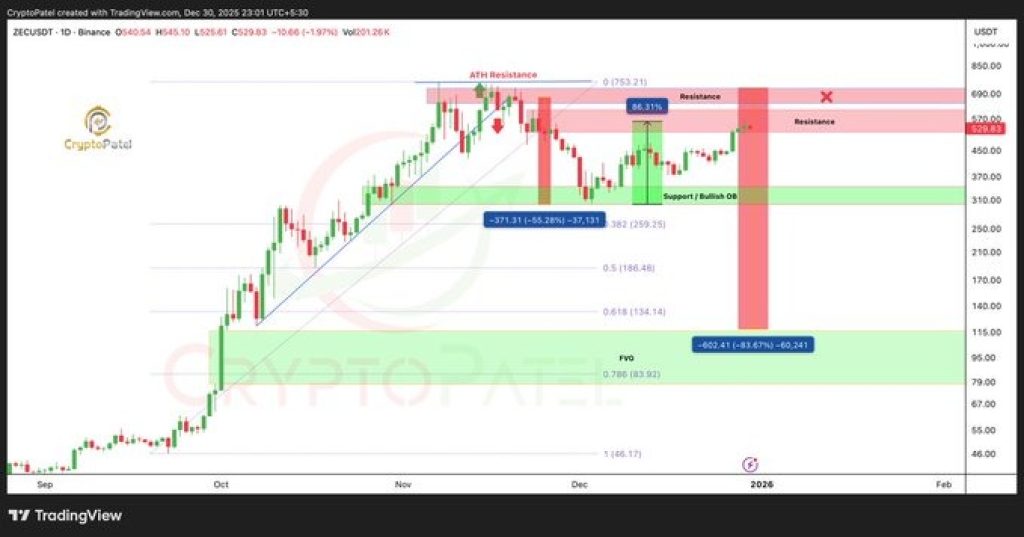
Source: X/CryptoPatel
Why the $300 Bounce Doesn’t Mean Safety For ZEC Price It’s important to separate a bounce from a trend change. ZEC bouncing off $300 doesn’t automatically mean the worst is over. In fact, sharp rebounds are common in downtrends, especially after large drops. The chart structure shows there is still room for price to move lower later on. If the Zcash price fails to hold above the mid-range and loses momentum near resistance, a deeper move becomes more likely. The next major downside area sits below $200, where long-term support and prior accumulation zones start to appear. That doesn’t mean price collapses immediately. It means the risk-to-reward for new longs above $500 is poor compared to earlier entries near $300. _Read Also: _****Solana’s Validator Collapse Exposes a Harsh Truth About SOL’s Economics Key Levels Traders Are Watching For Zcash Right now, the market is focused on a few clear levels. The $550–$600 area acts as a decision zone. Holding below it keeps pressure on the downside. A clean break and hold above $720 would change the picture and force bears to step aside. On the downside, $300 remains the first major support. If that level fails on a future retest, the chart opens up toward the sub-$200 region, where the next meaningful base could form. Moreover, the ZEC price has already delivered the easy part of the move. The bounce from $300 to $550 rewarded patience and discipline. From here, the trade gets harder. Chasing longs at these levels carries high risk, while the chart still allows for a much deeper pullback later. Until ZEC proves it can reclaim and hold above major resistance, the warning signs remain firmly in place.