Trade
Trading Type
Spot
Trade crypto freely
Pre-Market
Trade new tokens before they are officially listed
Margin
Magnify your profit with leverage
Convert & Block Trading
0 Fees
Trade any size with no fees and no slippage
Alpha
Points
Get promising tokens in streamlined on-chain trading
Leveraged Tokens
Get exposure to leveraged positions simply
Futures
Futures
Hundreds of contracts settled in USDT or BTC
Options
HOT
Trade European-style vanilla options
Unified Account
Maximize your capital efficiency
Demo Trading
Futures Kickoff
Get prepared for your futures trading
Futures Events
Participate in events to win generous rewards
Demo Trading
Use virtual funds to experience risk-free trading
Earn
Launch
CandyDrop
Collect candies to earn airdrops
Launchpool
Quick staking, earn potential new tokens
HODLer Airdrop
Hold GT and get massive airdrops for free
Launchpad
Be early to the next big token project
Alpha Points
NEW
Trade on-chain assets and enjoy airdrop rewards!
Futures Points
NEW
Earn futures points and claim airdrop rewards
Investment
Simple Earn
Earn interests with idle tokens
Auto-Invest
Auto-invest on a regular basis
Dual Investment
Buy low and sell high to take profits from price fluctuations
Soft Staking
Earn rewards with flexible staking
Crypto Loan
0 Fees
Pledge one crypto to borrow another
Lending Center
One-stop lending hub
VIP Wealth Hub
Customized wealth management empowers your assets growth
Private Wealth Management
Customized asset management to grow your digital assets
Quant Fund
Top asset management team helps you profit without hassle
Staking
Stake cryptos to earn in PoS products
Smart Leverage
NEW
No forced liquidation before maturity, worry-free leveraged gains
GUSD Minting
Use USDT/USDC to mint GUSD for treasury-level yields
More
Promotions
Activity Center
Join activities and win big cash prizes and exclusive merch
Referral
20 USDT
Earn 40% commission or up to 500 USDT rewards
Announcements
Announcements of new listings, activities, upgrades, etc
Gate Blog
Crypto industry articles
VIP Services
Huge fee discounts
Proof of Reserves
Gate promises 100% proof of reserves
Bittensor (TAO) Price Looks Ready for Double-Digit Rally: The Outlook
13m ago
Why ASTER Could See a 10x Spike in 2026 as Price Begins to Rise Again
1h ago
Trending Topics
View More19.23K Popularity
47.01K Popularity
55.62K Popularity
89.67K Popularity
3.7K Popularity
Pin
XRP Liquidity Is Tightening Fast as a New Buyer Steps In
A CoinDesk post paired with a CoinGlass chart makes a simple point: spot ETF flow has become a steady source of demand for XRP, even while price action has struggled to hold its earlier momentum. The chart tracks “Total XRP Spot ETF Net Inflow” in USD terms, with green bars for net inflow and a yellow line for XRP price. The last update stamp shows 2025-12-30, and the timeline spans mid-November through late December. The biggest signal sits at the start of the window. Net inflow prints a large spike in mid-November, then settles into a pattern of smaller but frequent positive days. A second burst appears around late November, followed by another noticeable inflow pop around early December. After that, the bars compress, but they do not disappear. In plain terms, inflows cool from the initial surge, yet they keep showing up. The XRP price tells a different story. The yellow line starts near the top of the chart’s range and trends lower through the period, moving from the low $2.30s toward the high $1.80s. There is a brief rebound into mid-December, but the line fails to reclaim earlier levels and drifts back toward the lower end by late December. The key takeaway is divergence: inflows persist while price grinds down.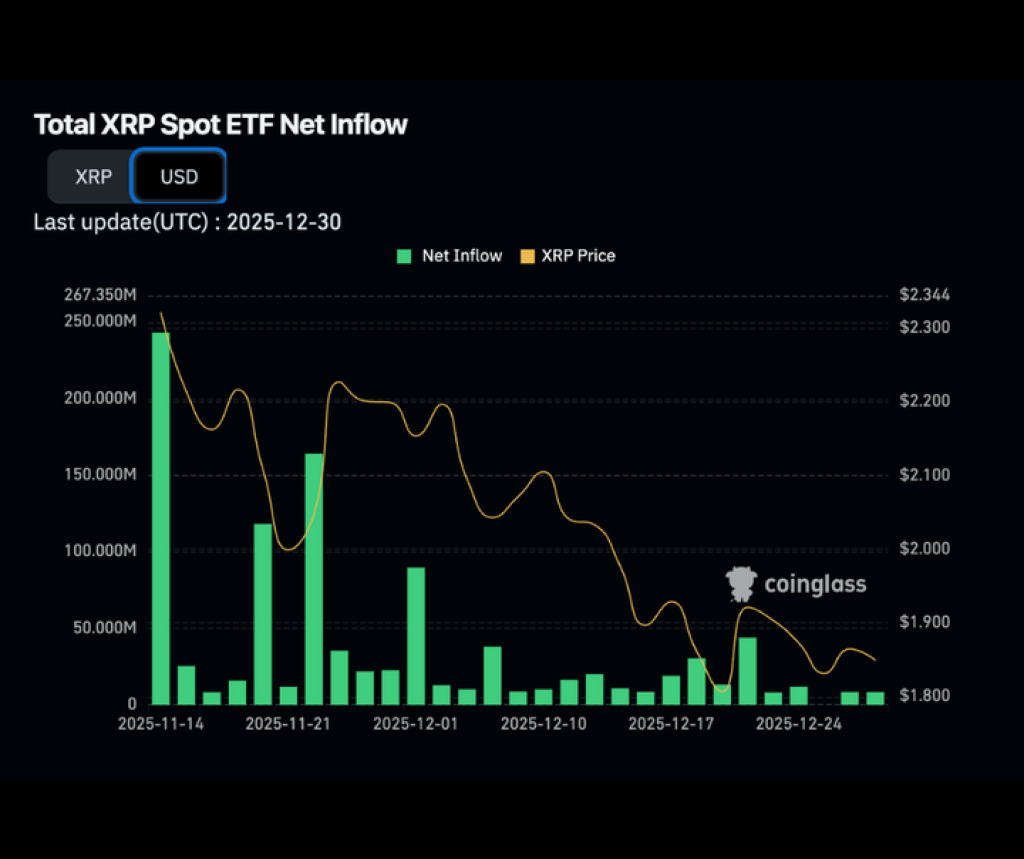
Source: X/@CoinDesk
CoinDesk frames the move as aggressive absorption. The post says XRP ETFs pulled in over $1B in about 50 days and locked 746M XRP, which it labels as 1.14% of circulating supply. It also notes only one zero-inflow day since launch, which supports the “consistent bid” narrative. From there, the post extrapolates: at a $27.7M-per-day pace, ETF assets could reach $5B by mid-May 2026, potentially locking 2.6B XRP, or roughly 4% of supply. It adds another pressure point: exchange balances are down 58% in 2025. The bullish case makes sense on structure. If a large buyer keeps absorbing spot supply while exchange balances fall, liquidity tightens and the market needs less incremental demand to move higher. The risk sits in the extrapolation. Flow pace rarely stays linear. A few quiet weeks can break the “daily run-rate” math, and price can still drift if broader crypto sentiment turns risk-off. Even so, the chart supports the core idea: XRP has a consistent demand source in the background, and that changes the setup heading into 2026. Read also: “The Timeline Was Wrong”: XRP Community Confronts Reality After 7 Years of Waiting