
Date: Fri, Jan 02, 2026 | 09:15 AM GMT
The broader cryptocurrency market has started the new year on a stable footing, with both Bitcoin (BTC) and Ethereum (ETH) trading slightly higher and posting gains of over 1.5%. This modest strength across major assets has provided breathing room for risk-on sentiment, allowing several memecoins to show early signs of recovery — including Popcat (SOL) (POPCAT).
POPCAT is currently trading by solid 19% higher on the day, but the more important development lies in its broader technical structure. After months of consistent downside pressure, the price action is now beginning to hint at a potential trend reversal, supported by a well-defined bullish pattern forming on the daily chart.
Source: Coinmarketcap
Falling Wedge Pattern in Play
On the daily timeframe, POPCAT appears to be carving out a falling wedge formation — a classic bullish reversal pattern that often develops after extended downtrends. This structure is characterized by lower highs and lower lows that gradually converge, reflecting weakening selling pressure and growing buyer interest near the lows.
Following weeks of steady decline, POPCAT recently established a local bottom near the $0.0725 region. This area acted as a strong demand zone, where buyers stepped in aggressively and prevented further downside. The resulting rebound pushed price back toward the $0.088 level, placing POPCAT just beneath the wedge’s upper resistance trendline.
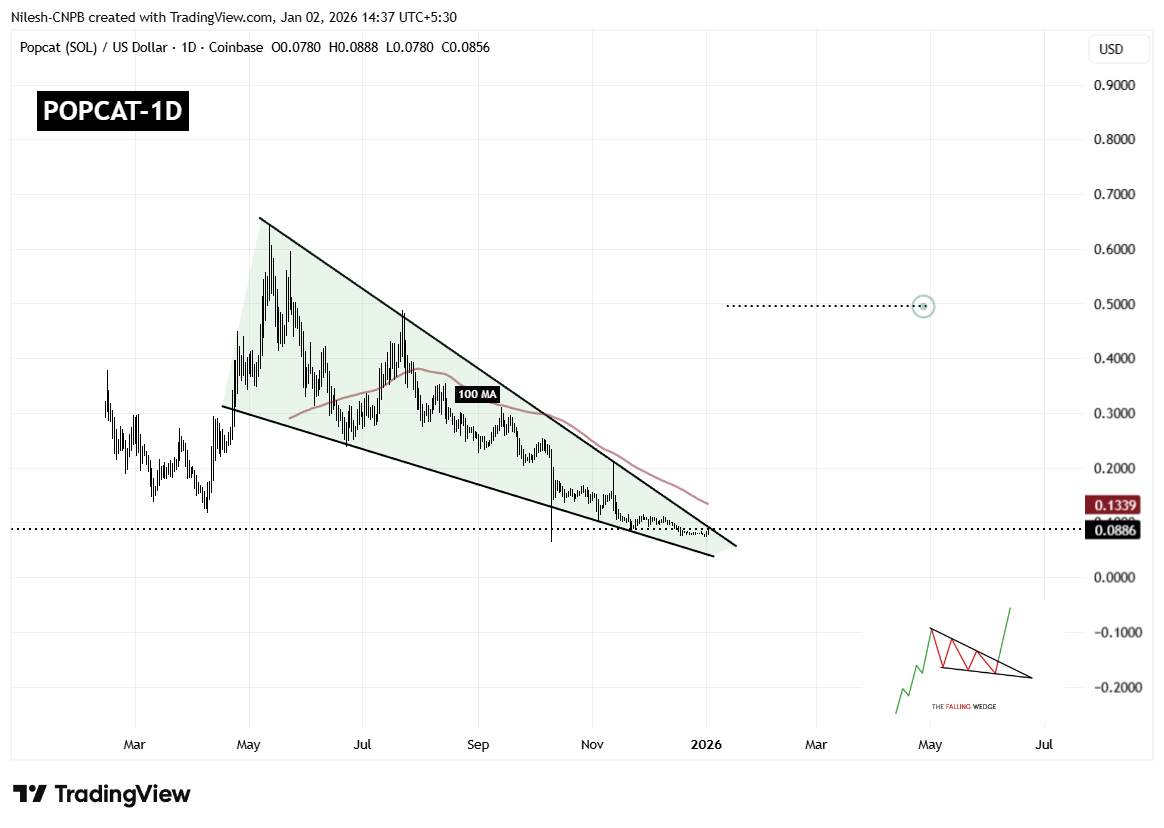
Popcat (POPCAT) Daily Chart/Coinsprobe (Source: Tradingview)
This compression near resistance is technically significant, as falling wedges tend to resolve with a sharp upside move once price breaks out of the structure. The longer price coils within the wedge, the stronger the eventual breakout tends to be.
However, overhead resistance remains notable. The 100-day moving average, currently hovering around $0.1339, represents a major technical barrier. This level has previously acted as dynamic resistance and will likely be a key area to watch if a breakout occurs.
What’s Next for POPCAT?
If buyers manage to push price decisively above the wedge resistance and reclaim the 100-day moving average with a strong daily close, POPCAT could confirm a bullish breakout. Such a move would mark a clear shift in trend structure and could open the door for a larger recovery rally.
Based on the measured move of the falling wedge pattern, the upside projection points toward the $0.49 region. Reaching this level would represent a substantial recovery from current prices and could attract renewed interest from momentum traders and sidelined participants.
That said, failure to break above resistance could result in continued consolidation. In a bearish scenario, POPCAT may revisit the $0.072 support zone once again. As long as this level continues to hold, the broader falling wedge structure would remain intact, keeping the bullish reversal thesis alive.
Overall, POPCAT is approaching a technically critical juncture. With price tightly compressed, selling pressure fading, and buyers defending key support levels, the coming sessions could prove decisive in determining whether this memecoin is ready to stage its next meaningful move higher.
Disclaimer: The views and analysis presented in this article are for informational purposes only and reflect the author’s perspective, not financial advice. Technical patterns and indicators discussed are subject to market volatility and may or may not yield the anticipated results. Investors are advised to exercise caution, conduct independent research, and make decisions aligned with their individual risk tolerance.
About Author: Nilesh Hembade is the Founder and Lead Author of Coinsprobe, with over 5 years of experience in the cryptocurrency and blockchain industry. Since launching Coinsprobe in 2023, he has been providing daily, research-driven insights through in-depth market analysis, on-chain data, and technical research.
Disclaimer: The information on this page may come from third parties and does not represent the views or opinions of Gate. The content displayed on this page is for reference only and does not constitute any financial, investment, or legal advice. Gate does not guarantee the accuracy or completeness of the information and shall not be liable for any losses arising from the use of this information. Virtual asset investments carry high risks and are subject to significant price volatility. You may lose all of your invested principal. Please fully understand the relevant risks and make prudent decisions based on your own financial situation and risk tolerance. For details, please refer to
Disclaimer.
Related Articles
Ethereum Tests Critical Support Zone, Risk of Breakdown and Extended Downtrend?
The Ethereum Foundation has allocated 3,400 ETH to the decentralized lending protocol Morpho, enhancing its treasury strategy. This includes 1,000 ETH in Morpho Vaults V2, aimed at sustainable DeFi yields, following an earlier deployment of 2,400 ETH last October.
TapChiBitcoin8m ago
Solana on-chain revenue hits 18-month low, SOL may test $80 level
The Solana ecosystem has come under pressure recently, with SOL's price retreating from $97.70 to $87, representing a three-day decline of approximately 11%. Sentiment in the derivatives market is insufficient, with funding rates approaching historic lows, and on-chain DApp revenue has dropped to an 18-month low. Despite relatively solid performance on decentralized exchanges, new products and competition are putting pressure on capital flows. SOL is expected to remain range-bound and weak in the near term.
GateNews19m ago
Analysts Recommend Holding "Dry Powder" During Price Volatility, BTC Oscillates Near $70,000
Gate News reported that on March 20, a certain analyst advised investors to hold "dry powder" (referring to cash reserves or funds awaiting investment) during periods of price volatility. On Thursday, Bitcoin price fluctuated around $70,377.59 and moved in the direction of $69,000.
GateNews20m ago
PHA Soars 27.93% as Broader Crypto Market Shifts
PHA experienced a remarkable price surge of 27.93% in one hour, rising to $0.0426 amid mixed market signals. Increased trading volume and speculative interest suggest a shift in investor sentiment towards altcoins, highlighting potential breakout levels to watch.
Coinfomania40m ago
Cryptocurrency Fear and Greed Index Falls to 11, Market Panic Sentiment Rises Significantly
Gate News: On March 20, according to Alternative data, today's cryptocurrency Fear and Greed Index is 11, down significantly from 23 yesterday, indicating a notable rise in market panic sentiment. The index threshold ranges from 0-100 and is composed of the following indicators: volatility accounts for 25%, market trading volume accounts for 25%, social media heat accounts for 15%, market surveys account for 15%, Bitcoin's proportion in the overall market accounts for 10%, and Google Trends analysis accounts for 10%.
GateNews47m ago
Mainstream CEX and DEX funding rates show the market maintains a comprehensive bearish outlook
On March 20th, Gate News reported that according to Coinglass data, Bitcoin experienced a slight pullback, with funding rates on mainstream CEX and DEX showing an overall bearish market sentiment. Funding rates impact traders' costs and returns, with rates below 0.005% indicating widespread market bearish outlook.
GateNews54m ago
