
JasmyCoin is back in the spotlight after a sharp move that caught attention even as the wider crypto market stayed quiet. JASMY price jumped more than 30% in a single day and stretched the weekly gain to about 54%. The timing raised eyebrows because nothing obvious changed on the news front. The explanation sits more in charts, volume, and sector strength than headlines.
That context sets the tone for what is happening now. Momentum arrived fast, volume followed, and traders are trying to decide whether this move has legs or if it fades just as quickly.
- JasmyCoin Price Surge Stands Out Despite A Flat Market
- Technical Structure Explains Why JASMY Price Reacted So Fast
- What Key Resistance And Support Levels Say About Sustainability
- Can JasmyCoin Price Hold Its Momentum From Here?
JasmyCoin Price Surge Stands Out Despite A Flat Market
Joseph Alalade, a DeFi writer known online as Joseph Alalade, highlighted how unusual the move looked on the day it happened. According to his post, JasmyCoin climbed over 30% while the broader market barely moved. Weekly performance pushed past 50%, creating a sharp contrast with the calm elsewhere.
Trading activity added another layer to the story. Volume expanded by roughly 440%, reaching about $157 million. That kind of spike rarely appears without some form of conviction behind it. Alalade pointed to technical breakout signals and renewed strength across DePIN tokens as key forces driving the move rather than a single announcement or catalyst.
Those conditions explain why JASMY price moved so quickly. Momentum traders noticed the breakout, liquidity rushed in, and price reacted in a compressed timeframe.
Technical Structure Explains Why JASMY Price Reacted So Fast
Cihan Türkmen, who shares technical analysis under the handle Cihan Türkmen, focused on the structure that formed before the rally. His chart work showed JasmyCoin spending an extended period building a base between $0.0063 and $0.0071. That zone acted like a pressure chamber, holding price steady until momentum finally broke it free.
Once price pushed higher, volume expanded and short term momentum became visible on the daily chart. Türkmen described the area between $0.00715 and $0.00640 as the main support zone. As long as JASMY price holds above that region, the rebound structure remains intact rather than broken.
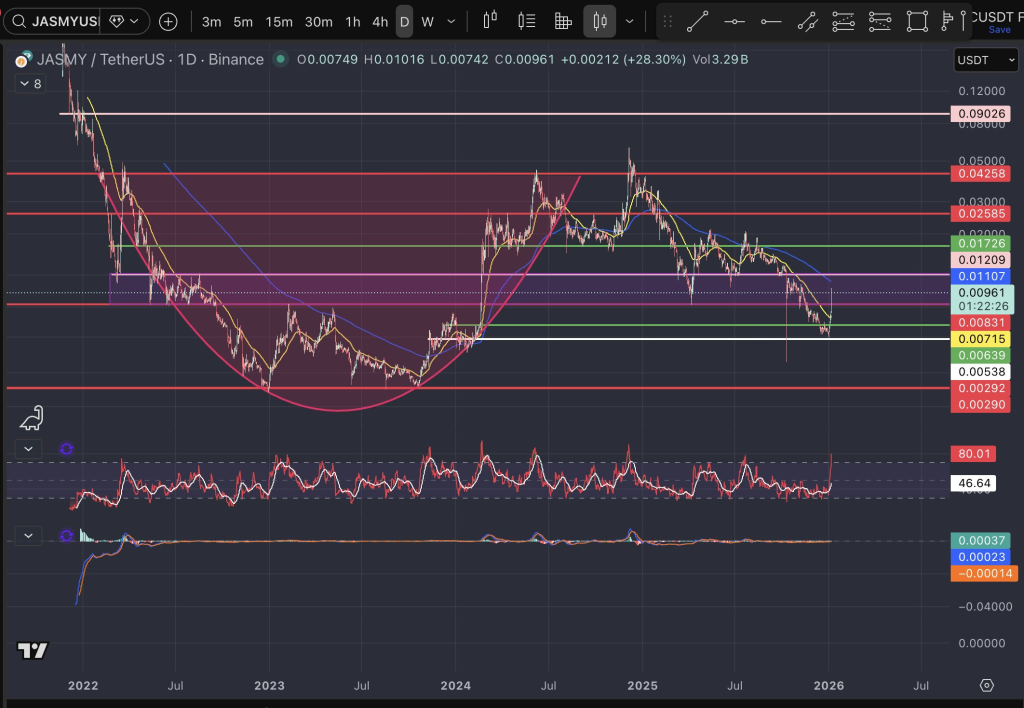
@noktali_kanca / X
Resistance levels now matter just as much. Türkmen identified the $0.0096 to $0.0110 region as the first major barrier. That zone lines up with a previous trading range and key moving averages. Without reclaiming that area, confirmation of a full trend reversal stays off the table.
What Key Resistance And Support Levels Say About Sustainability
The path forward depends heavily on how price behaves near those technical markers. Türkmen outlined two clear scenarios based on price reaction. A failure near $0.0110 could send JasmyCoin back toward the $0.0071 area for a retest. That move would cool momentum but would not automatically invalidate the broader structure if support holds.
A different picture emerges if daily closes push above $0.0110. That development would signal a stronger medium-term recovery. Under that scenario, $0.0129 becomes the next area to watch, followed by $0.0172 as a higher upside target if momentum continues to build.
Momentum indicators support the idea of caution. RSI has moved rapidly toward overbought territory, while MACD is attempting to flip into positive momentum. Those signals often appear during strong rallies but can also precede pauses or pullbacks. Türkmen emphasized that discipline and patience matter most at this stage rather than chasing price blindly.
Solana Is Suddenly Leading The ETF Flow Conversation_**
Can JasmyCoin Price Hold Its Momentum From Here?
JasmyCoin price action looks impressive on the surface, yet the foundation of the move matters more than the percentage gain itself. Technical breakout, sector rotation toward DePIN tokens, and a surge in volume explain why JASMY moved when it did. Those factors can sustain momentum, though they also demand respect for nearby support and resistance.
What happens next will depend on whether price can hold above its new support zones and challenge higher resistance levels with steady volume. Watching how JASMY behaves around $0.0110 could reveal whether this rally evolves into something more durable or settles into consolidation.
Curiosity now shifts toward the next few daily closes. Price behavior there may quietly answer the question everyone is asking without saying a word.
Disclaimer: The information on this page may come from third parties and does not represent the views or opinions of Gate. The content displayed on this page is for reference only and does not constitute any financial, investment, or legal advice. Gate does not guarantee the accuracy or completeness of the information and shall not be liable for any losses arising from the use of this information. Virtual asset investments carry high risks and are subject to significant price volatility. You may lose all of your invested principal. Please fully understand the relevant risks and make prudent decisions based on your own financial situation and risk tolerance. For details, please refer to
Disclaimer.
Related Articles
Crypto Fear & Greed Index Rises to 28, Exits Extreme Fear Zone
Gate News bot message, the Crypto Fear & Greed Index climbed to 28 today, up from 23 yesterday and 13 last week, transitioning from Extreme Fear into Fear territory. Market sentiment demonstrates early signs of recovery, while participants maintain a cautious stance with limited risk appetite.
GateNews7m ago
Shiba Inu Death Cross Emerges as SHIB Price Slips Below Key Support
Key Insights
Shiba Inu confirms a death cross on the daily chart as the short term moving average drops below the long term average.
Over 112 billion SHIB moved to exchanges within two days, increasing market attention on potential selling activity and near term price pressure.
SHIB
CryptoFrontNews46m ago
Iran Conflict Recalls "Ghost" of 2008: Securities, Crypto Face Risks
Mike McGlone from Bloomberg warns that escalating tensions between the US-Israel and Iran could lead to significant declines in stock and cryptocurrency markets, reminiscent of the 2008 financial crisis. He advises traders to capitalize on price fluctuations while predicting Bitcoin could drop to around $10,000.
TapChiBitcoin53m ago
Crypto Market Records Modest Gains Amid Growing Optimism
The crypto market has seen slight gains, with a total capitalization of $2.52T and a 56.66% increase in trading volume. Bitcoin dipped slightly, while Ethereum rose. Notable gainers include HARRIS DOGS and PEPE. DeFi and NFT sectors also showed growth, alongside significant industry developments.
BlockChainReporter58m ago
Bitcoin records 8 consecutive trading days of gains, a first in nearly 4 years
Gate News reports that as of March 17, Bitcoin recorded 8 consecutive trading days of gains since March 9, marking the first occurrence in nearly 4 years. According to Glassnode data, Bitcoin has experienced at least 8 consecutive days of gains 15 times throughout history. Following these streaks, there were 9 instances of continued gains and 6 instances of declines over the next 30 days, with a median gain of approximately 19% over the 30-day period.
GateNews1h ago
Crypto Market Rally Has Begun With Bitcoin and Altcoin Prices Rising, ETH Pump Could Be Strong
Crypto market rally has begun with Bitcoin and altcoin prices rising.
Some expect the price of ETH to see a very strong pump.
Analysts debate the many possibilities of a bullish rally peak.
The crypto market seems to have already entered a promising bullish recovery phase. At the
CryptoNewsLand2h ago
