
**Date: **Wed, Jan 07, 2026 | 06:20 AM GMT
The broader cryptocurrency market continues to show strong New Year momentum, with Bitcoin (BTC) up around 4% and Ethereum (ETH) gaining over 9% on a weekly basis. This improving sentiment is gradually spilling over into major altcoins — including the DePIN-focused token Akash Network (AKT).
AKT has already posted an impressive 20% weekly gain. While this short-term strength has caught traders’ attention, the more important development is unfolding on the higher-timeframe chart. Recent price action suggests a meaningful shift in market structure, hinting that AKT may be transitioning out of a prolonged corrective phase and into the early stages of a bullish continuation.
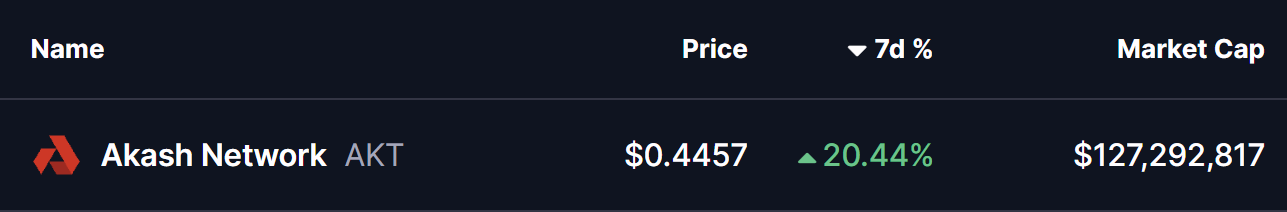
Source: Coinmarketcap
Falling Wedge and Rounding Bottom in Play
On the daily chart, AKT has been trading within a broader falling wedge — a structure that often precedes bullish reversals as selling pressure gradually weakens. Within this larger wedge, price action is also shaping a developing rounding bottom pattern, reflecting steady accumulation and seller exhaustion.
The formation began after AKT faced strong rejection near the $0.5441 resistance zone in late November. That rejection triggered a sharp sell-off, pushing price lower toward the $0.3465 region. However, bears failed to extend losses beyond this area. Instead, demand stepped in, downside momentum slowed, and price began to stabilize.
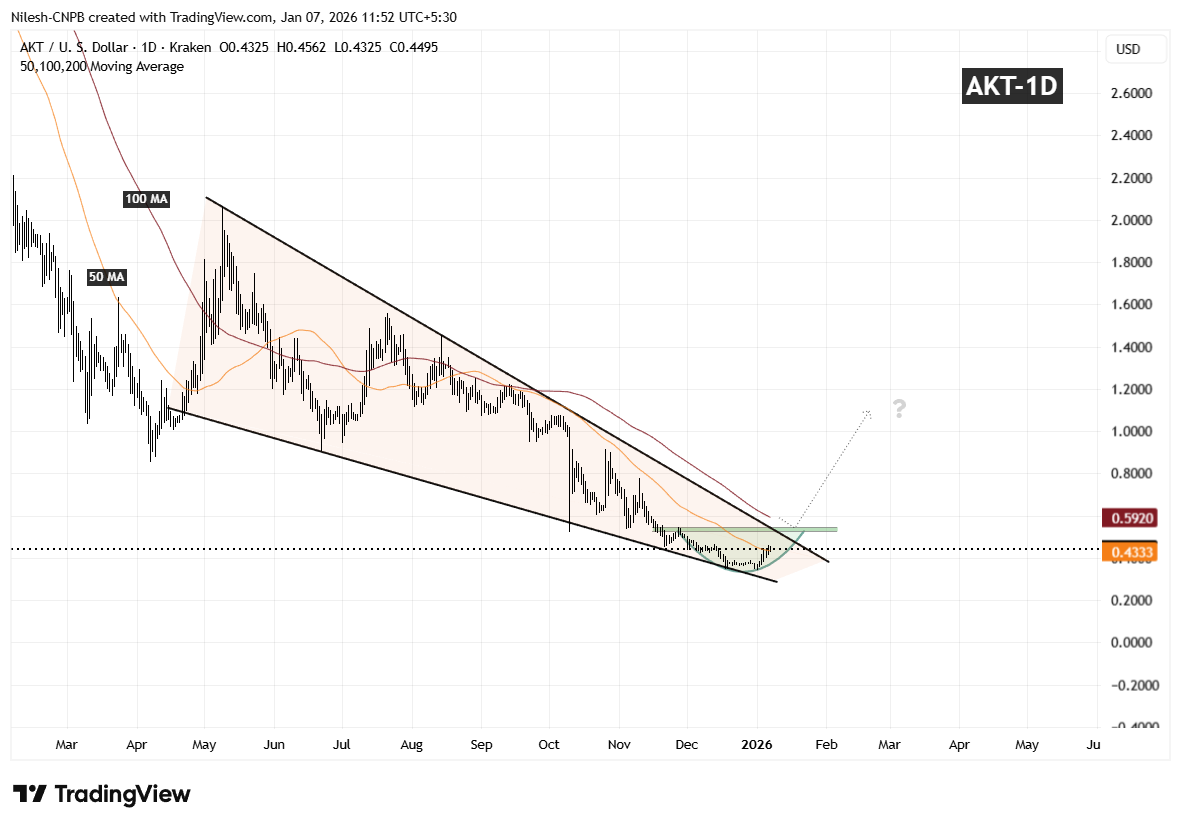
Akash Network (AKT) Daily Chart/Coinsprobe (Source: Tradingview)
Over the following weeks, volatility compressed and AKT started to curl higher in a smooth, rounded fashion — closely matching the textbook behavior of a rounding bottom. Importantly, the recent rebound has pushed price back above the 50-day moving average around $0.4333, a level that had previously acted as resistance and is now beginning to flip into support.
What’s Next for AKT?
If AKT can continue to hold above the 50-day moving average, this area may act as a solid base for further upside attempts. From here, attention shifts toward the descending resistance trendline of the falling wedge, which aligns closely with the $0.5441 resistance zone.
A clean and decisive breakout above this confluence area, followed by sustained acceptance, would confirm a broader bullish expansion phase and mark a clear trend reversal from the prior downtrend. Such a move would likely attract renewed momentum participation as the market recognizes the structural shift.
Until that breakout occurs, the pattern remains in development. Short-term consolidation or shallow pullbacks are still possible as price digests recent gains. However, as long as AKT continues to print higher lows above the established base, the broader technical structure remains constructive.
Overall, the chart suggests AKT is approaching a critical inflection point — one that could determine whether this recovery evolves into a sustained bullish trend as 2026 progresses.
Disclaimer: The views and analysis presented in this article are for informational purposes only and reflect the author’s perspective, not financial advice. Technical patterns and indicators discussed are subject to market volatility and may or may not yield the anticipated results. Investors are advised to exercise caution, conduct independent research, and make decisions aligned with their individual risk tolerance.
About Author: Nilesh Hembade is the Founder and Lead Author of Coinsprobe, with over 5 years of experience in the cryptocurrency and blockchain industry. Since launching Coinsprobe in 2023, he has been providing daily, research-driven insights through in-depth market analysis, on-chain data, and technical research.
Disclaimer: The information on this page may come from third parties and does not represent the views or opinions of Gate. The content displayed on this page is for reference only and does not constitute any financial, investment, or legal advice. Gate does not guarantee the accuracy or completeness of the information and shall not be liable for any losses arising from the use of this information. Virtual asset investments carry high risks and are subject to significant price volatility. You may lose all of your invested principal. Please fully understand the relevant risks and make prudent decisions based on your own financial situation and risk tolerance. For details, please refer to
Disclaimer.
Related Articles
「刻舟求劍」式幣價預測走紅,玄學預言的實戰邏輯與缺陷
作者:Frank,PANews
每當市場進入不上不下的迷惘階段,就會有人試圖用「刻舟求劍」式的歷史回溯方法去預測下一段走勢。在這種情況下,人們往往能從這些理論和圖表中看到歷史總是在重演,並似乎自動將未來一段時間的行情走勢與過去的某一段進行重疊驗證。
這種重合似乎有著神奇的效果,也常常被驗證。有部落客自稱這種預測的準確率能到達 75%~80% 。
這種在社群媒體上屢屢爆紅的「刻舟求劍」式價格預測,究竟是在幫助市場識別階段,還是在把噪音包裝成預言?
從「滴答分形」到「歷史押韻」
關於 2025 年 10 月市場頂點預測的巔峰操作是名為 CryptoBullet 的分析師,他所創建的一種名為「ti
区块客42m ago
Dogecoin (DOGE) Prints Abnormal $0 as Short Sellers Disappear - U.Today
Dogecoin's recent rally saw $0 in short liquidations, indicating traders were betting long. Despite a 4.61% decline due to market pullback, volume remained high. The potential for DOGE to reach $0.10 depends on Bitcoin's recovery.
UToday1h ago
Bitcoin Holds Steady Amid Middle East Escalation
Bitcoin demonstrates resilience at $70K amid geopolitical tensions in the Middle East, with declining exchange-held Bitcoin indicating investor confidence. Market reactions reflect a growing stability, despite volatility from conflict risks.
CryptoFrontNews1h ago
Liệu Dogecoin có chững lại trong một phạm vi giá kéo dài nhiều tuần bất chấp đợt tăng giá 15%?
Dogecoin (DOGE) has successfully defended the crucial support level of $0.088 despite recent selling pressure, aided by Bitcoin's recovery. While DOGE saw a significant 15% increase recently, long-term trends remain bearish. Rising social media interactions and potential short liquidations could drive short-term growth, but long-term recovery may require surpassing $0.127.
TapChiBitcoin2h ago
Analyst Says XRP Is ‘Criminally Undervalued’ as RSI Drops
Analyst says XRP RSI reached oversold levels last seen during the 2022 bear market bottom.
XRP trades near $1.39 with key support at $1.30–$1.35 and resistance between $1.45 and $1.70.
Price has declined from about $3.10 since Sept 2025, forming a prolonged downward trend.
XRP trades near
CryptoFrontNews3h ago
Shiba Inu Death Cross Appears on Daily Chart as Price Loses Support - U.Today
Shiba Inu (SHIB) is battling bearish pressure that threatens to undo its over 8.85% weekly gains. In the last 24 hours, the meme coin’s price and volume flipped negative as it recorded a death cross on its charts.
Death cross signals weakening momentum for Shiba Inu
For context, a death cross eme
UToday3h ago