Date: Fri, Jan 02, 2026 | 09:15 AM GMT
The broader cryptocurrency market has started the new year on a stable footing, with both Bitcoin (BTC) and Ethereum (ETH) trading slightly higher and posting gains of over 1.5%. This modest strength across major assets has provided breathing room for risk-on sentiment, allowing several memecoins to show early signs of recovery — including Popcat (SOL) (POPCAT).
POPCAT is currently trading by solid 19% higher on the day, but the more important development lies in its broader technical structure. After months of consistent downside pressure, the price action is now beginning to hint at a potential trend reversal, supported by a well-defined bullish pattern forming on the daily chart.
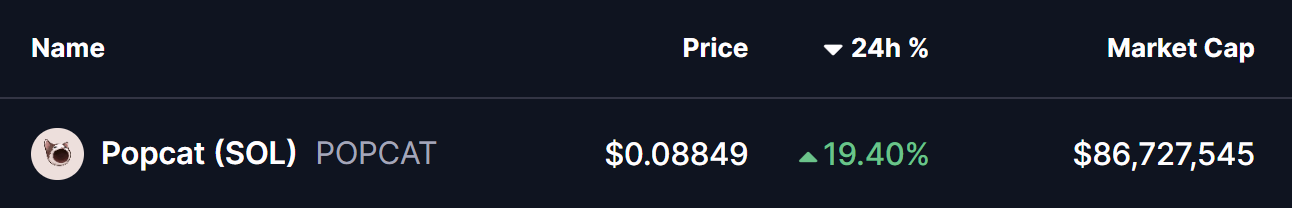
Source: Coinmarketcap
Falling Wedge Pattern in Play
On the daily timeframe, POPCAT appears to be carving out a falling wedge formation — a classic bullish reversal pattern that often develops after extended downtrends. This structure is characterized by lower highs and lower lows that gradually converge, reflecting weakening selling pressure and growing buyer interest near the lows.
Following weeks of steady decline, POPCAT recently established a local bottom near the $0.0725 region. This area acted as a strong demand zone, where buyers stepped in aggressively and prevented further downside. The resulting rebound pushed price back toward the $0.088 level, placing POPCAT just beneath the wedge’s upper resistance trendline.
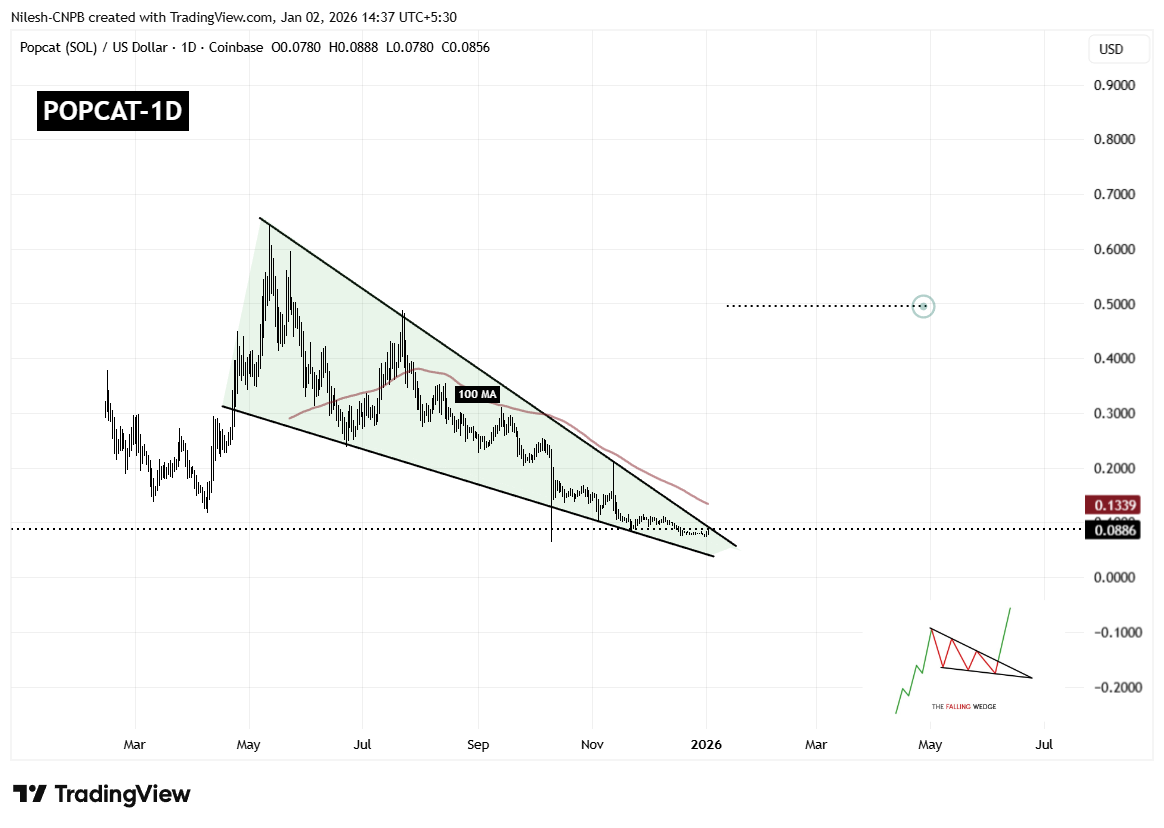
Popcat (POPCAT) Daily Chart/Coinsprobe (Source: Tradingview)
This compression near resistance is technically significant, as falling wedges tend to resolve with a sharp upside move once price breaks out of the structure. The longer price coils within the wedge, the stronger the eventual breakout tends to be.
However, overhead resistance remains notable. The 100-day moving average, currently hovering around $0.1339, represents a major technical barrier. This level has previously acted as dynamic resistance and will likely be a key area to watch if a breakout occurs.
What’s Next for POPCAT?
If buyers manage to push price decisively above the wedge resistance and reclaim the 100-day moving average with a strong daily close, POPCAT could confirm a bullish breakout. Such a move would mark a clear shift in trend structure and could open the door for a larger recovery rally.
Based on the measured move of the falling wedge pattern, the upside projection points toward the $0.49 region. Reaching this level would represent a substantial recovery from current prices and could attract renewed interest from momentum traders and sidelined participants.
That said, failure to break above resistance could result in continued consolidation. In a bearish scenario, POPCAT may revisit the $0.072 support zone once again. As long as this level continues to hold, the broader falling wedge structure would remain intact, keeping the bullish reversal thesis alive.
Overall, POPCAT is approaching a technically critical juncture. With price tightly compressed, selling pressure fading, and buyers defending key support levels, the coming sessions could prove decisive in determining whether this memecoin is ready to stage its next meaningful move higher.
Disclaimer: The views and analysis presented in this article are for informational purposes only and reflect the author’s perspective, not financial advice. Technical patterns and indicators discussed are subject to market volatility and may or may not yield the anticipated results. Investors are advised to exercise caution, conduct independent research, and make decisions aligned with their individual risk tolerance.
About Author: Nilesh Hembade is the Founder and Lead Author of Coinsprobe, with over 5 years of experience in the cryptocurrency and blockchain industry. Since launching Coinsprobe in 2023, he has been providing daily, research-driven insights through in-depth market analysis, on-chain data, and technical research.
Disclaimer: The information on this page may come from third parties and does not represent the views or opinions of Gate. The content displayed on this page is for reference only and does not constitute any financial, investment, or legal advice. Gate does not guarantee the accuracy or completeness of the information and shall not be liable for any losses arising from the use of this information. Virtual asset investments carry high risks and are subject to significant price volatility. You may lose all of your invested principal. Please fully understand the relevant risks and make prudent decisions based on your own financial situation and risk tolerance. For details, please refer to
Disclaimer.
Related Articles
Luke Gromen Says 'Nuclear Printing' Needed to Push Bitcoin Back Into Bull Market
Bitcoiners often argue that BTC should thrive when the global financial system starts to look unstable. But Luke Gromen says that this time, BTC simply was not behaving the way he thought it should, and that was enough for him to slash a position he described as “irresponsibly large.”
Gromen
Coinpedia42m ago
$1.68 Billion Exits Exchanges As Bitcoin Holds Above $70,000
A fresh wave of withdrawals from trading platforms has injected cautious optimism into the Bitcoin market this week. Sentora reported that $1.68 billion in net outflows left exchange wallets over the past seven days, a move the firm described on X as “continued accumulation into cold storage and
BlockChainReporter1h ago
GROK Corrects to $0.0004846, Gets Ready for Next Leg Up With 100% Spike Ahead: Analyst
The GROK coin is attracting market attention due to its latest exciting price action. With its ongoing consolidation, the analyst CryptoGems2016 believes that the crypto asset is almost ready to experience moves on the massive upside.
The Grok (GROK) coin is a meme coin cryptocurrency named after
BlockChainReporter2h ago
Aave Price Holds Near $111 After $27M Liquidation Error Shakes DeFi
Key Insights
Aave traded near $111 after a CAPO oracle configuration error triggered $27 million in liquidations across 34 wstETH-backed accounts.
Trading activity cooled as derivatives volume dropped and open interest declined, signaling that traders stepped back following the liquidation i
CryptoFrontNews3h ago
Cardano Price Holds Above $0.26 as Upgrade Buzz Builds Toward $0.30
Key Insights
Cardano price trades above $0.26 as investors position ahead of the Leios and Midnight upgrades, while derivatives data reflect rising bullish sentiment.
Futures open interest reached $416 million while funding rates favor long positions, signaling stronger trader confidence des
CryptoFrontNews3h ago
Cardano’s 307% Rally Started With This Signal – And ADA Price Just Flashed It Again
Cardano has been quietly building something that caught the interest of technical analysts. After months of grinding sideways and frustrating holders, the ADA price finally showed signs of life.
The move caught many off guard, but for those watching the charts, the signal was impossible to
CaptainAltcoin3h ago