Chiliz (CHZ) records an increase of over 3% at the time of writing on Thursday, recovering after two consecutive correction sessions and continuing to consolidate the main upward trend. Notably, demand for the CHZ token from investors holding large wallets—commonly referred to as “whales”—has been significantly increasing since the beginning of the year. However, Chiliz’s technical outlook still shows mixed signals as the price approaches a key resistance zone, an area that has repeatedly limited upward momentum in January, after a strong breakout of 40% in December.
Whales’ interest surges ahead of the 2026 World Cup
During the 2022 World Cup, the wave of launching official Fan Tokens and NFTs greatly expanded the Chiliz ecosystem, providing a significant boost to the value of CHZ. Moving into a new phase, this blockchain dedicated to sports is gradually regaining growth momentum as the FIFA World Cup 2026 is expected to return to the US in June. This global event is anticipated to spark increased interest and participation from US investors in the Chiliz ecosystem in the near future.
From an on-chain data perspective, “whales” continue to quietly accumulate CHZ, despite the token having decreased by 48% last year—marking the fourth consecutive year of decline. Specifically, investor groups holding between 100 million and 1 billion CHZ increased their ownership share to 5.23% of the total on-chain supply, a significant rise from 3.84% recorded on January 1. Meanwhile, the group holding over 1 billion CHZ remains stable at 65.12%—a silent signal but one that indicates long-term confidence still exists.
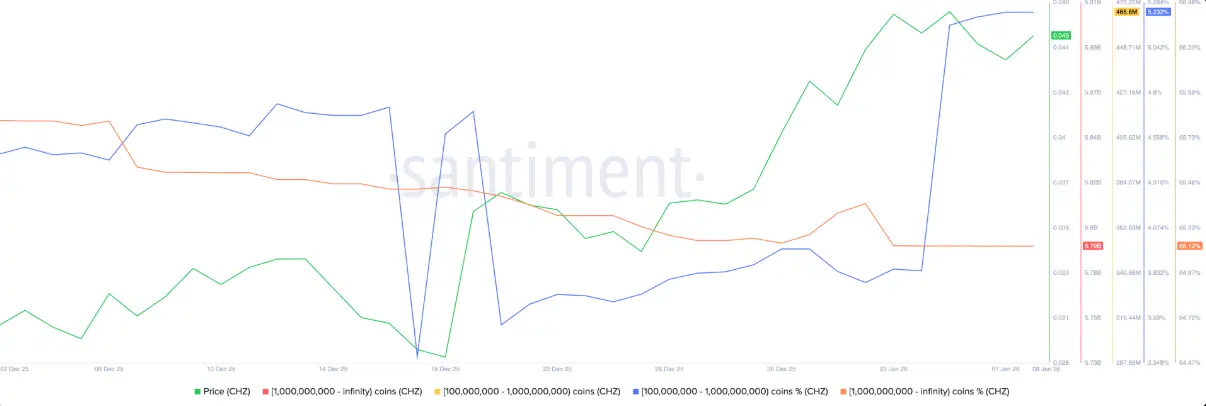 CHZ supply distribution data | Source: Santiment## Chiliz’s recovery momentum faces a crossroads below the psychological level of 0.0500 USD
Chiliz is approaching an important resistance zone at 0.04635 USD—the most recent test level on Monday—and has been continuously restrained since late July. In a successful breakout above this level, CHZ is likely to extend its upward momentum toward the psychological threshold of 0.0500 USD.
The positive outlook is reinforced as the 50-day (EMA) moving average crosses above the 100-day EMA, forming a “golden cross”—a signal indicating that short-term bullish momentum is prevailing.
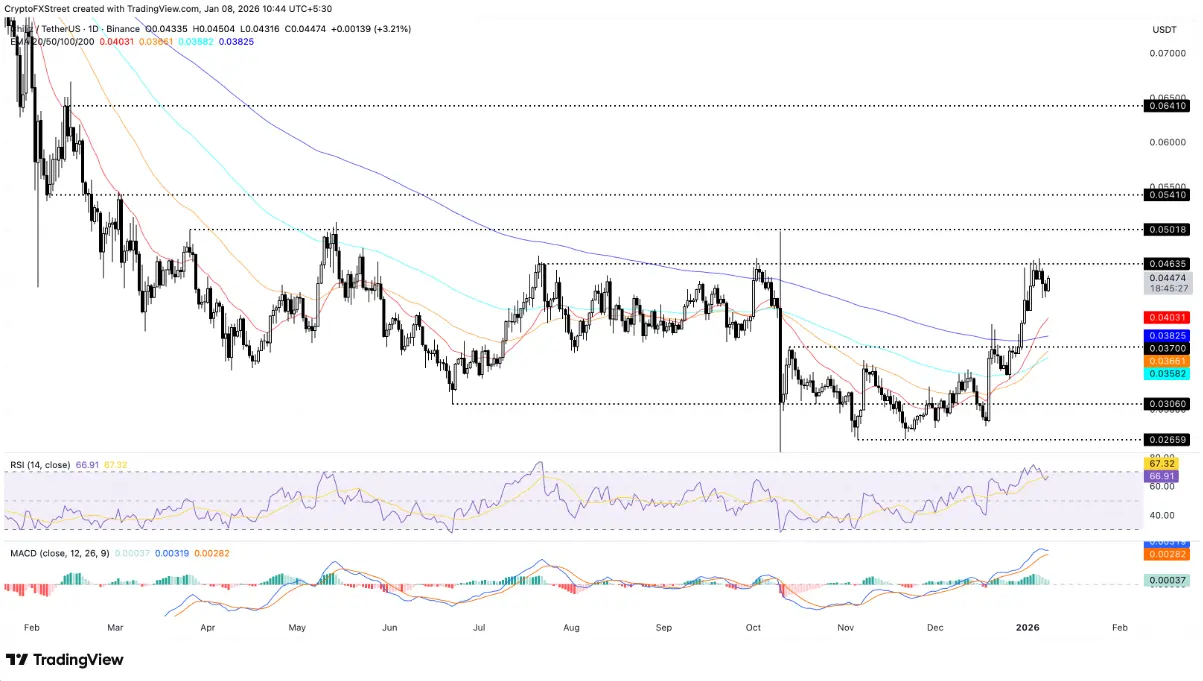 Daily CHZ/USDT chart | Source: TradingViewHowever, technical indicators on the daily timeframe are beginning to issue caution signals. The (RSI) has retreated to 66 after leaving the overbought zone, reflecting weakening upward momentum. At the same time, the MACD line is at risk of crossing below the signal line, which could trigger short-term selling pressure.
If CHZ reverses from the 0.04635 USD zone, the 20-day EMA and 200-day EMA, approximately around 0.04031 USD and 0.03825 USD respectively, are expected to serve as important dynamic support levels for the price.
SN_Nour
Disclaimer: The information on this page may come from third parties and does not represent the views or opinions of Gate. The content displayed on this page is for reference only and does not constitute any financial, investment, or legal advice. Gate does not guarantee the accuracy or completeness of the information and shall not be liable for any losses arising from the use of this information. Virtual asset investments carry high risks and are subject to significant price volatility. You may lose all of your invested principal. Please fully understand the relevant risks and make prudent decisions based on your own financial situation and risk tolerance. For details, please refer to
Disclaimer.
Related Articles
Bitcoin Holds Steady Amid Middle East Escalation
Bitcoin demonstrates resilience at $70K amid geopolitical tensions in the Middle East, with declining exchange-held Bitcoin indicating investor confidence. Market reactions reflect a growing stability, despite volatility from conflict risks.
CryptoFrontNews7m ago
Liệu Dogecoin có chững lại trong một phạm vi giá kéo dài nhiều tuần bất chấp đợt tăng giá 15%?
Dogecoin (DOGE) has successfully defended the crucial support level of $0.088 despite recent selling pressure, aided by Bitcoin's recovery. While DOGE saw a significant 15% increase recently, long-term trends remain bearish. Rising social media interactions and potential short liquidations could drive short-term growth, but long-term recovery may require surpassing $0.127.
TapChiBitcoin55m ago
Analyst Says XRP Is ‘Criminally Undervalued’ as RSI Drops
Analyst says XRP RSI reached oversold levels last seen during the 2022 bear market bottom.
XRP trades near $1.39 with key support at $1.30–$1.35 and resistance between $1.45 and $1.70.
Price has declined from about $3.10 since Sept 2025, forming a prolonged downward trend.
XRP trades near
CryptoFrontNews1h ago
Shiba Inu Death Cross Appears on Daily Chart as Price Loses Support - U.Today
Shiba Inu (SHIB) is battling bearish pressure that threatens to undo its over 8.85% weekly gains. In the last 24 hours, the meme coin’s price and volume flipped negative as it recorded a death cross on its charts.
Death cross signals weakening momentum for Shiba Inu
For context, a death cross eme
UToday2h ago
加密货币恐慌指数升至16,市场仍处「极度恐慌」状态
Gate News 消息,3 月 14 日,据 Alternative 数据,今日加密货币恐慌与贪婪指数小幅升至 16,上月均值为 5,市场仍处于「极度恐慌」状态。恐慌指数阈值为 0-100,其计算包含以下指标:波动性(25%)、市场交易量(25%)、社交媒体热度(15%)、市场调查(15%)、比特币在整个市场中的比例(10%)及谷歌热词分析(10%)。
GateNews3h ago
Japan XRP Payment Rumors Ignite Massive Market Speculation
Japan's crypto landscape is buzzing with potential XRP adoption for payments, fueled by partnerships and regulatory developments, though no official mandate is in place yet. Speculative claims highlight a promising future for XRP amid ongoing fintech experiments.
Coinfomania4h ago