
**Date: **Wed, Jan 07, 2026 | 10:40 AM GMT
Key Takeaways:
-
Whale Activity: Three wallets linked to a single entity accumulated 3,000 BTC during this week’s price dip.
-
Technical Setup: BTC is forming an Ascending Triangle on the daily chart, a classic bullish continuation signal.
-
Key Levels: Support at $89,900 is the line in the sand; a breakout above $95,000 triggers the $108K target.
The broader cryptocurrency market is showing a mild pullback today after a strong start to the year. Bitcoin (BTC), which had rallied close to the $94,000 mark earlier this week, has cooled off and is now trading below $92,000, down around 1.89% on the day.
While short-term price action reflects some profit-taking, activity beneath the surface tells a different story. Large holders appear to be positioning for a bigger move, and the latest daily chart structure continues to hint at a potential upside resolution.
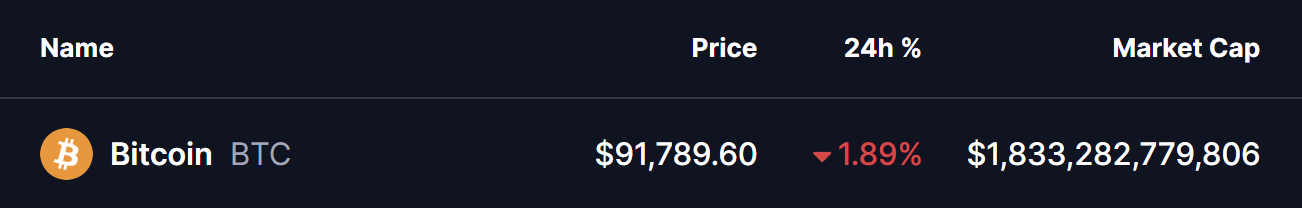
Source: Coinmarketcap
Is This Whale Buying a Sign of the Next BTC Breakout?
As Bitcoin gained momentum over the past several sessions, whales quietly stepped in with significant accumulation. According to data shared by Lookonchain, three wallets — potentially linked to the same entity — accumulated a combined 3,000 BTC worth roughly $280 million just hours ago.
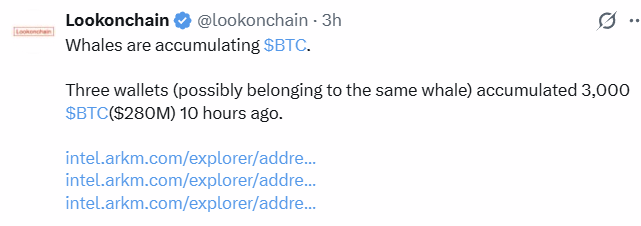
Source: Lookonchain (X)
This type of buying activity during a pullback often suggests long-term conviction rather than short-term speculation.
Ascending Triangle Taking Shape on the Daily Chart
On the daily timeframe, BTC appears to be forming an ascending triangle pattern — a structure commonly associated with bullish continuation when confirmed.
The pattern is defined by a rising trendline that has consistently supported higher lows since December, while price continues to face resistance in the $94,000–$95,000 zone. Each pullback has been increasingly shallow, signaling steady demand at higher price levels.
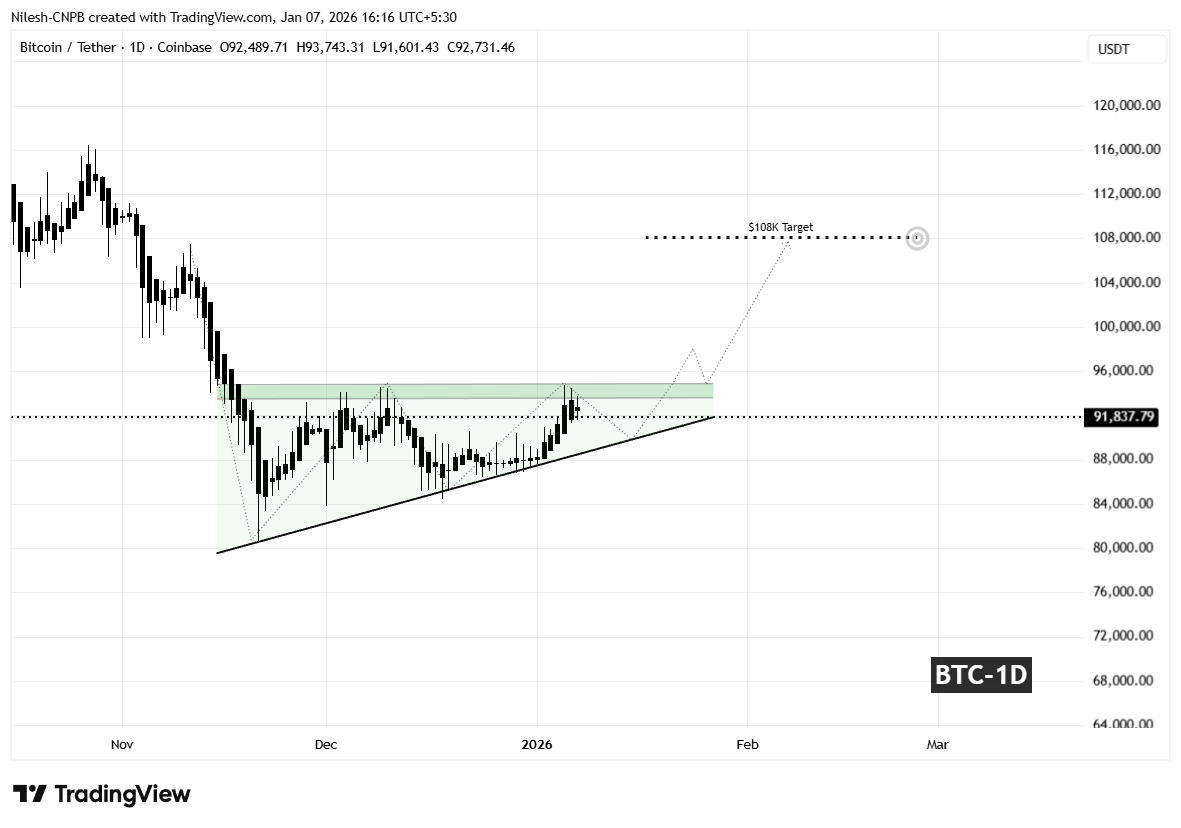
Bitcoin (BTC) Daily Chart/Coinsprobe (Source: Tradingview)
Today’s rejection from resistance pushed BTC back below $92,000, but price remains well above the ascending support trendline. A controlled pullback toward the $89,900–$90,000 area would still keep the broader structure intact and could serve as a healthy reset before the next attempt higher.
Will BTC Hit $108,000? The Scenario Outlook
The $89,000–$90,000 region now plays a crucial role in maintaining bullish structure. As long as BTC continues to hold above this rising trendline, the probability of another move toward the $94,000–$95,000 resistance zone remains elevated.
A decisive daily close above horizontal resistance would confirm an ascending triangle breakout and shift momentum firmly back in favor of the bulls. Such a move could also trigger fresh participation from sidelined buyers.
Based on the measured move projection of the triangle, a confirmed breakout points toward a potential upside target near $108,000 — matching the extension zone marked on the chart. From the breakout area, this would represent roughly a 14% upside move.
On the flip side, failure to hold the ascending support could invalidate the pattern and expose BTC to a deeper corrective move. Until either scenario is confirmed, price action within this structure remains a battle between patient accumulation and short-term selling pressure.
The Bottom Line: While Bitcoin (BTC) has dipped below $92,000, “Smart Money” is using the pullback to load up. On-chain data confirms that three major whales just accumulated $280 million in BTC. Technically, Bitcoin is coiled inside a massive Ascending Triangle, with a confirmed breakout targeting the $108,000 level.
Disclaimer: The views and analysis presented in this article are for informational purposes only and reflect the author’s perspective, not financial advice. Technical patterns and indicators discussed are subject to market volatility and may or may not yield the anticipated results. Investors are advised to exercise caution, conduct independent research, and make decisions aligned with their individual risk tolerance.
About Author: Nilesh Hembade is the Founder and Lead Author of Coinsprobe, with over 5 years of experience in the cryptocurrency and blockchain industry. Since launching Coinsprobe in 2023, he has been providing daily, research-driven insights through in-depth market analysis, on-chain data, and technical research.
Disclaimer: The information on this page may come from third parties and does not represent the views or opinions of Gate. The content displayed on this page is for reference only and does not constitute any financial, investment, or legal advice. Gate does not guarantee the accuracy or completeness of the information and shall not be liable for any losses arising from the use of this information. Virtual asset investments carry high risks and are subject to significant price volatility. You may lose all of your invested principal. Please fully understand the relevant risks and make prudent decisions based on your own financial situation and risk tolerance. For details, please refer to
Disclaimer.
Related Articles
Bitcoin Gets Its Own ‘Fear Gauge’ as Cboe Announces BITVX Index
Cboe Global Markets is bringing Wall Street’s favorite volatility playbook to bitcoin, announcing plans to launch a new index designed to track the market’s expected price swings using options tied to the popular Ishares Bitcoin Trust ETF.
BITVX: Cboe Applies VIX Methodology to Bitcoin ETF
Coinpedia2h ago
Strategy’s Michael Saylor Reveals $1.28B Bitcoin Purchase, Holdings Reach 738,731 BTC
Michael Saylor, executive chairman of Strategy, posted a brief but blunt update that stopped scrolling feeds: “Strategy has acquired 17,994 BTC for ~$1.28 billion at ~$70,946 per Bitcoin. As of 3/8/2026, we hodl 738,731 $BTC acquired for ~$56.04 billion at ~$75,862 per Bitcoin.” The numbers speak fo
BlockChainReporter2h ago
ETH 15-minute increase of 1.96%: On-chain large fund inflows and technical breakthroughs jointly amplify the rally
2026-03-09 19:15 to 19:30 (UTC), ETH achieved a short-term return of 1.96%, with the price range between 2010.14 and 2050.5 USDT, and an amplitude of 2.01%. Trading volume during this period significantly increased, market attention rapidly grew, and price fluctuations drew high investor interest.
The main driver of this movement was multiple large transfers of over 10,000 ETH on the blockchain, primarily flowing to a major exchange, indicating institutional or large investor accumulation, with positive capital inflows. At 19:15, ETH suddenly
GateNews4h ago
BTC 15-minute increase of 1.42%: On-chain capital inflow and technical breakout points resonate to trigger buying interest
From 19:15 to 19:30 on March 9, 2026 (UTC), the BTC price experienced a 15-minute return of +1.42%, with trading ranges between 68,377.3 and 69,365.3 USDT, and a volatility of 1.44%. This fluctuation far exceeds the regular intraday volatility levels, with market attention significantly heightened, and short-term buying surges intensifying the volatility.
The main driver of this movement was net inflow of on-chain funds, triggered by large transfers from major holder accounts, along with buy orders breaking through key technical resistance levels.
GateNews4h ago
Dogecoin Tests $0.090 Support After 3.4% Drop as Traders Watch Key Price Range
Dogecoin is currently trading at $0.09061 which is a drop of 3.4 percent, and the price is close to the important level of $0.09011 support.
The chart indicates a series of tests of the support zone of $0.089-$0.090, and the closest resistance is represented by $0.09353.
A hold of
CryptoNewsLand4h ago